Solution Report: Solution Diagnostics: SW52ZXJzaW9uU29sdXRpb246MTQ1MzUuMFZQb2VY
| Num Ruptures | 997,545 |
|---|
| Num Single-Stranded Ruptures | 997,545 (100.00%) |
| Total Supra-Seis Rupture Rate | 0.04561298 |
| Total Supra-Seis Recurrence Interval | 21.92 yrs |
| Total Moment Rate | 1.9418393E19 N-m/yr |
| Deformation Model Total Moment Rate | 3.174542E19 N-m/yr |
| Magnitude Range | [5.73,8.41] |
| Length Range | [1.86,1132.40] km |
| Rupture Section Count Range | [2,117] |
Table Of Contents
(top)
Test down-dip subsectioning rup set
Solution MFDs
(top)
Total Target MFDs
(top)
| Incremental MFDs | Cumulative MFDs |
|---|
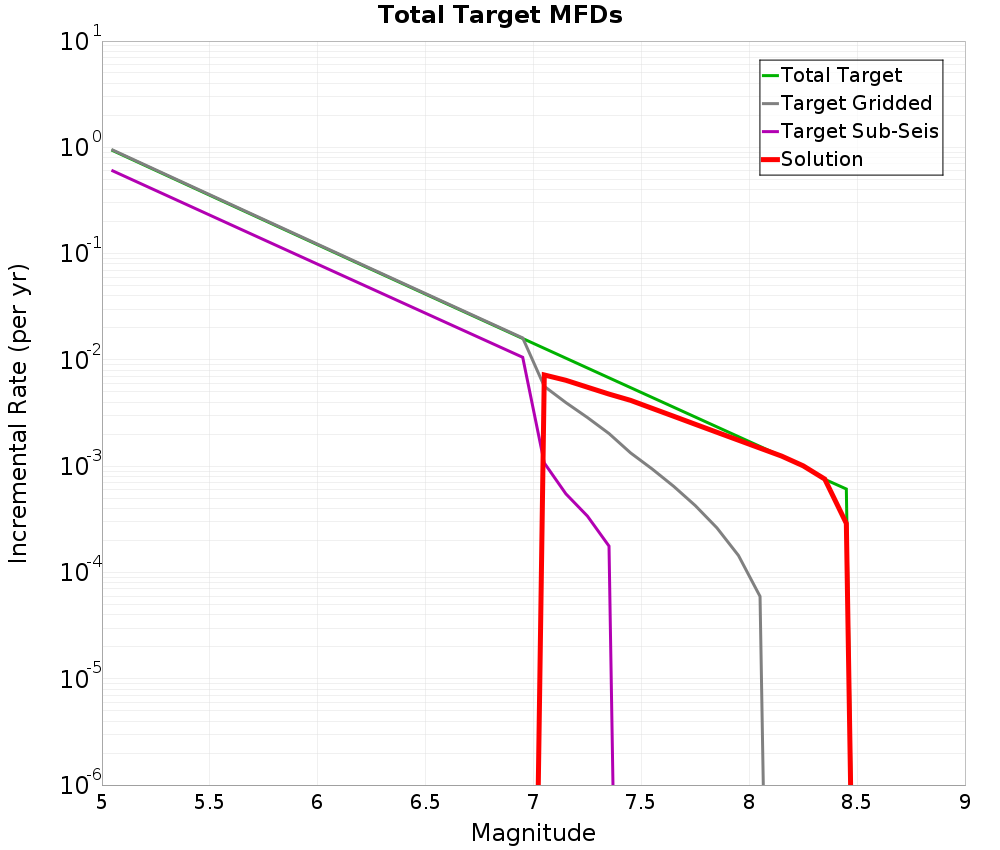 | 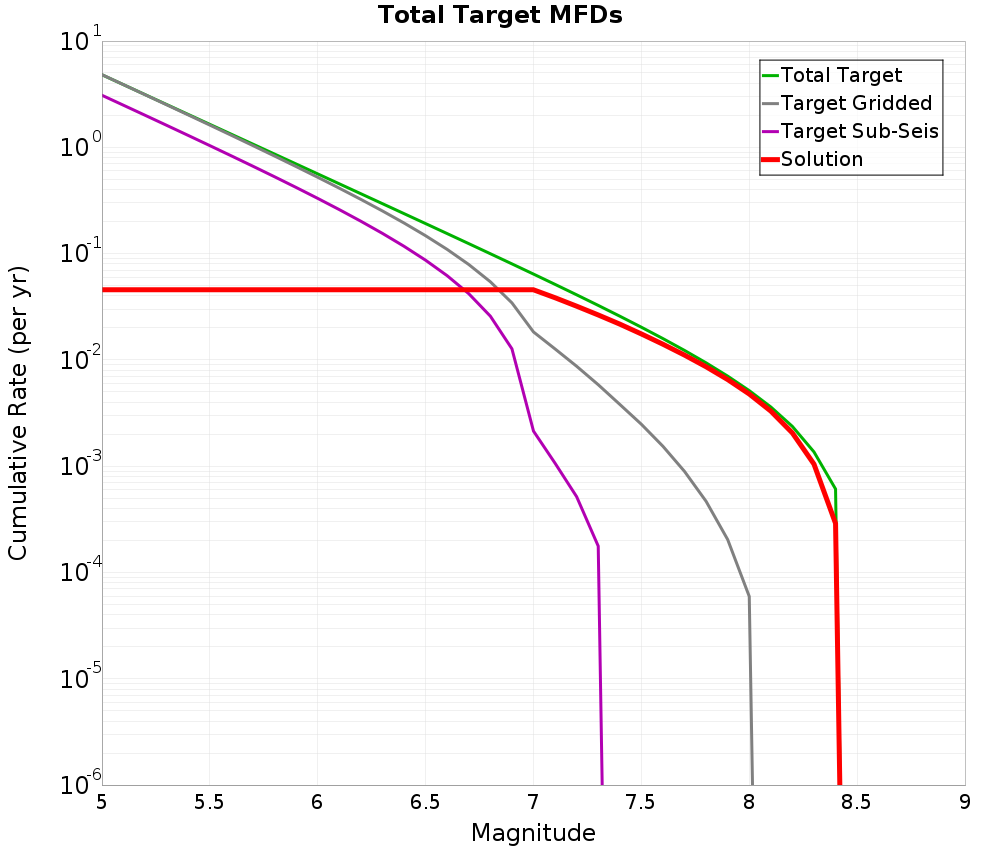 |
NZ RECTANGLE SANS TVZ Gridded Region
(top)
| Incremental MFDs | Cumulative MFDs |
|---|
 | 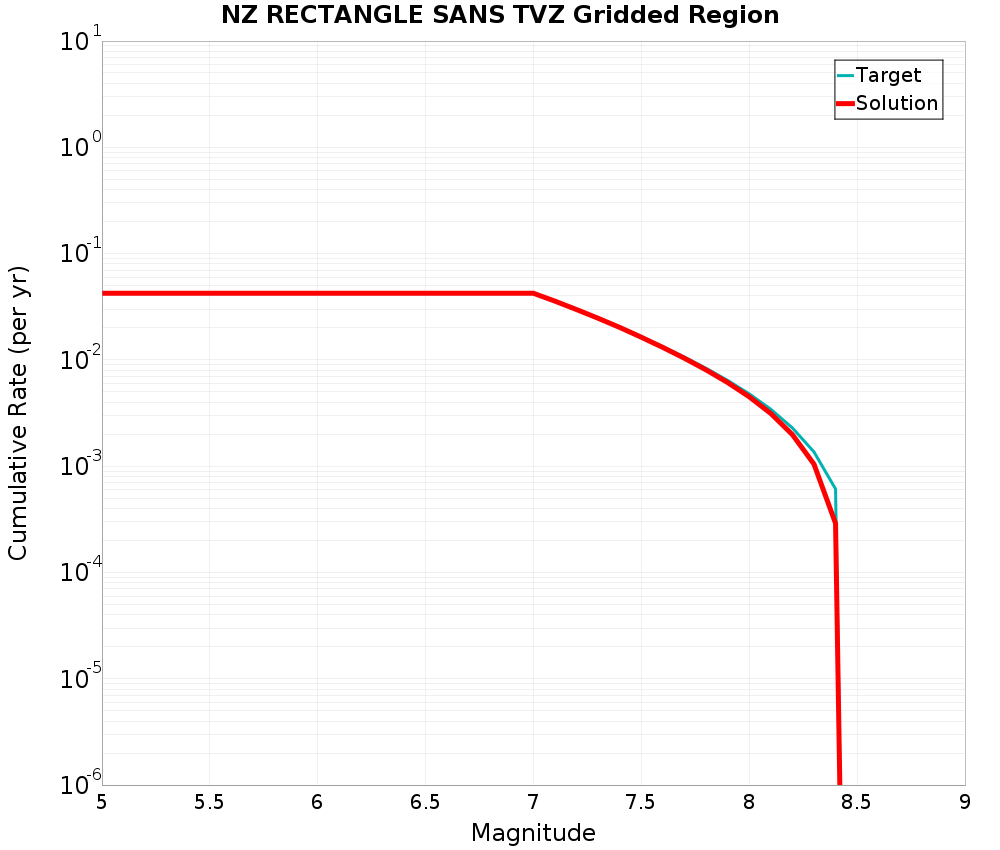 |
NZ TVZ Gridded Region
(top)
| Incremental MFDs | Cumulative MFDs |
|---|
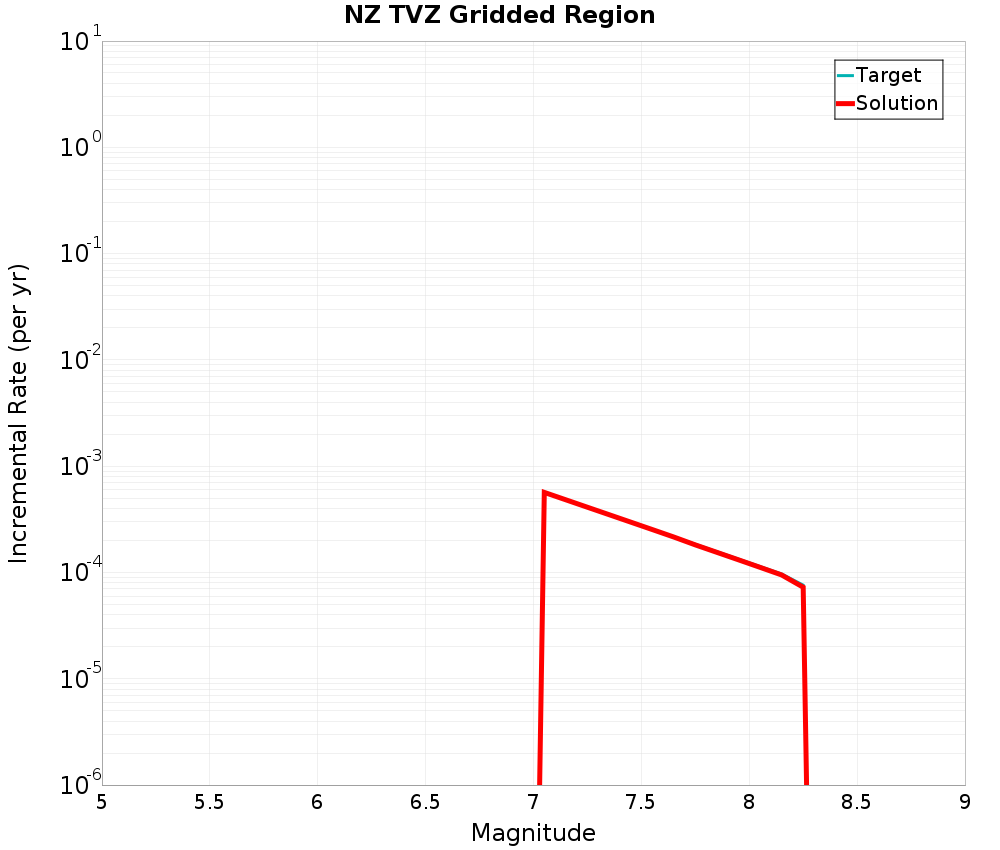 | 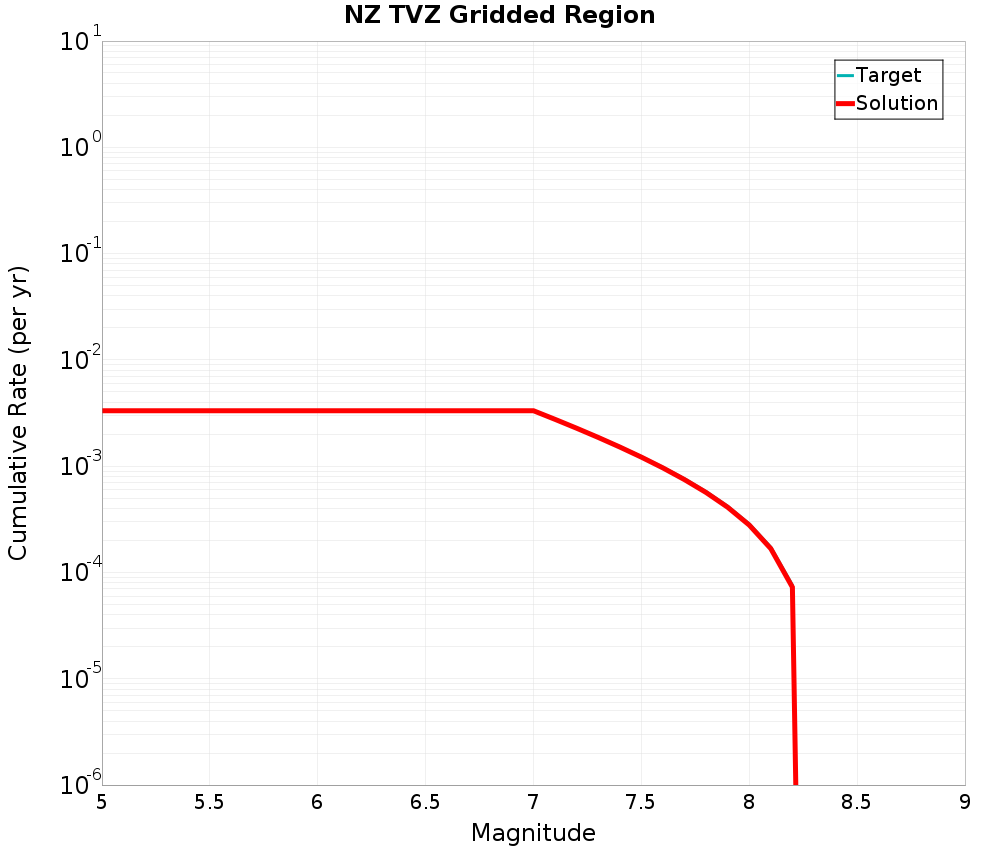 |
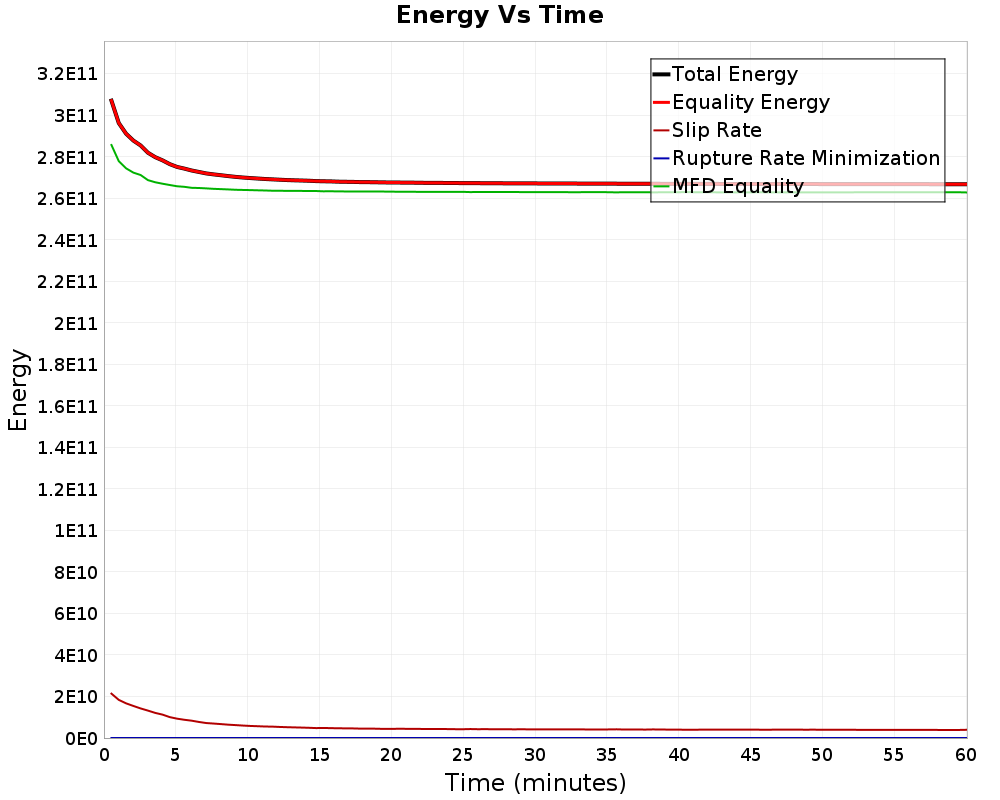
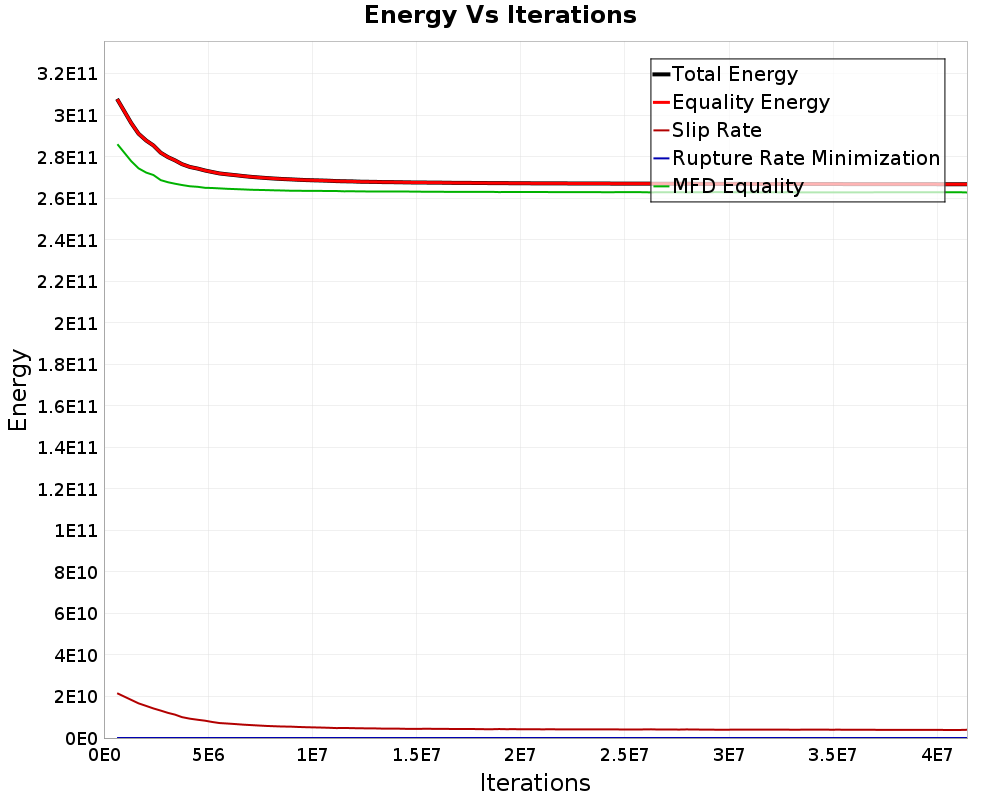
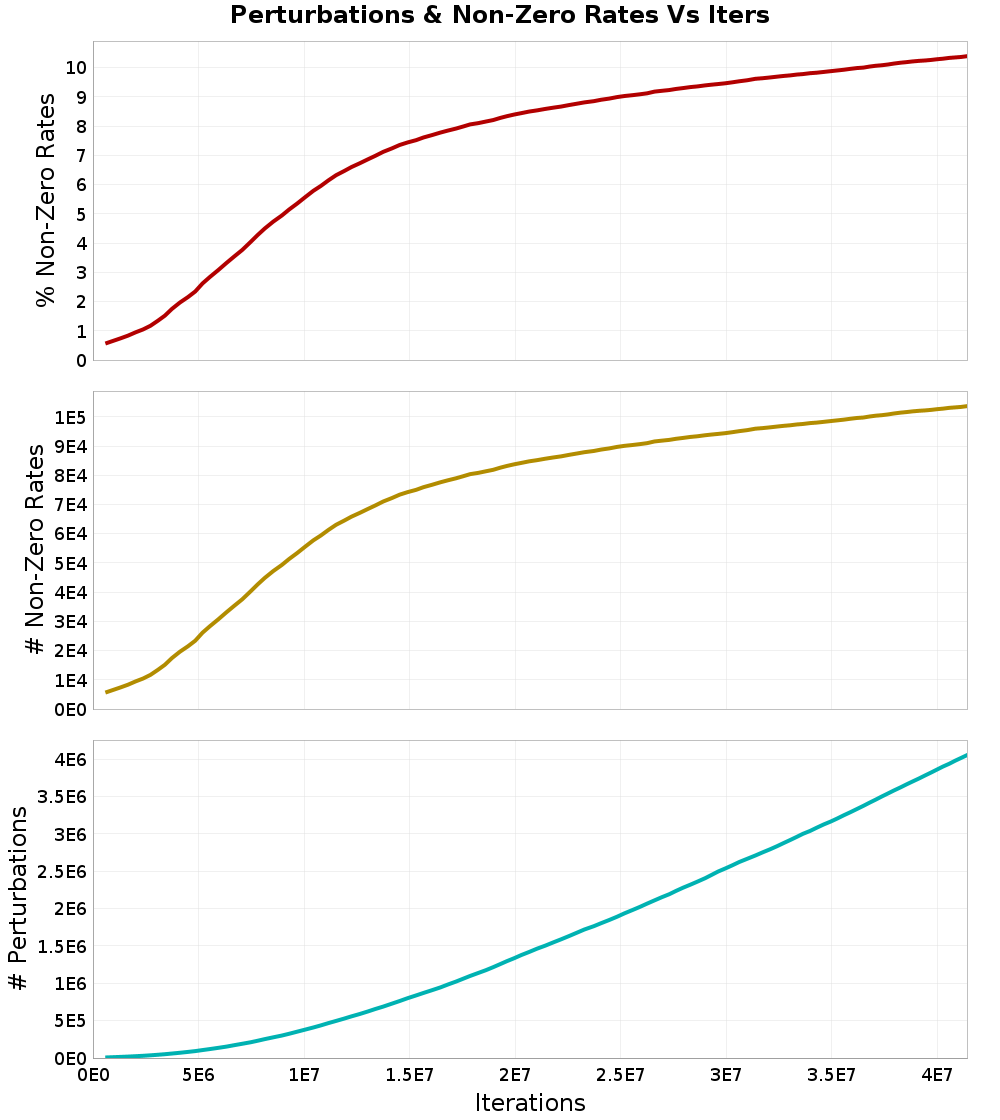
Simulated Annealing Energy
(top)
- Iterations: 41,412,435 (11,492 /sec)
- Time: 1 hour 0.1 mins
- Perturbations: 4,055,927
- Total energy: 2.6675449E11
Final Energies
(top)
| Energy Type | Final Energy (1 hour 0.1 mins) | % of Total | After 30 mins |
|---|
| Total Energy | 2.6675449E11 | | 2.67147149E11 |
| Equality Energy | 2.6675449E11 | 100.00% | 2.67147149E11 |
| Entropy Energy | 0.0 | 0.00% | 0.0 |
| Inequality Energy | 0.0 | 0.00% | 0.0 |
| Slip Rate | 3.95945318E9 | 1.48% | 4.16624435E9 |
| Rupture Rate Minimization | 0.0 | 0.00% | 0.0 |
| MFD Equality | 2.62795035E11 | 98.52% | 2.62980911E11 |
Energy Progress
(top)
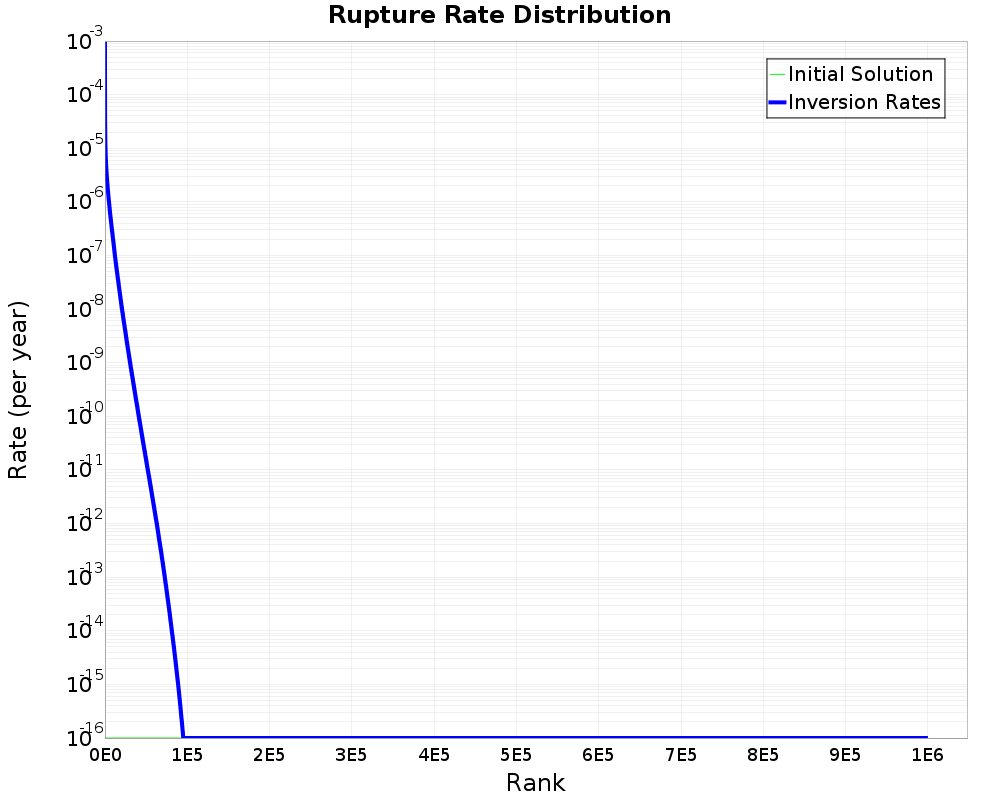
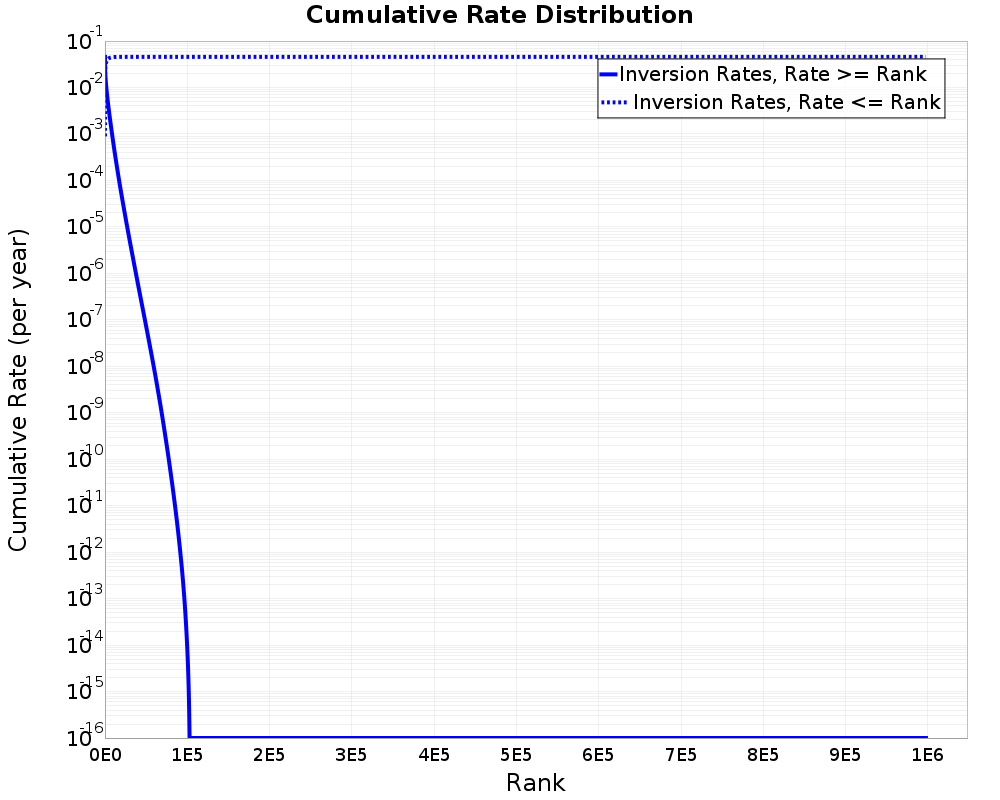
Rate Distribution
(top)
- Non-zero ruptures: 103,646 (10.39%)
- Avg. # perturbations per rupture: 4.065909
- Avg. # perturbations per perturbed rupture: 39.1325
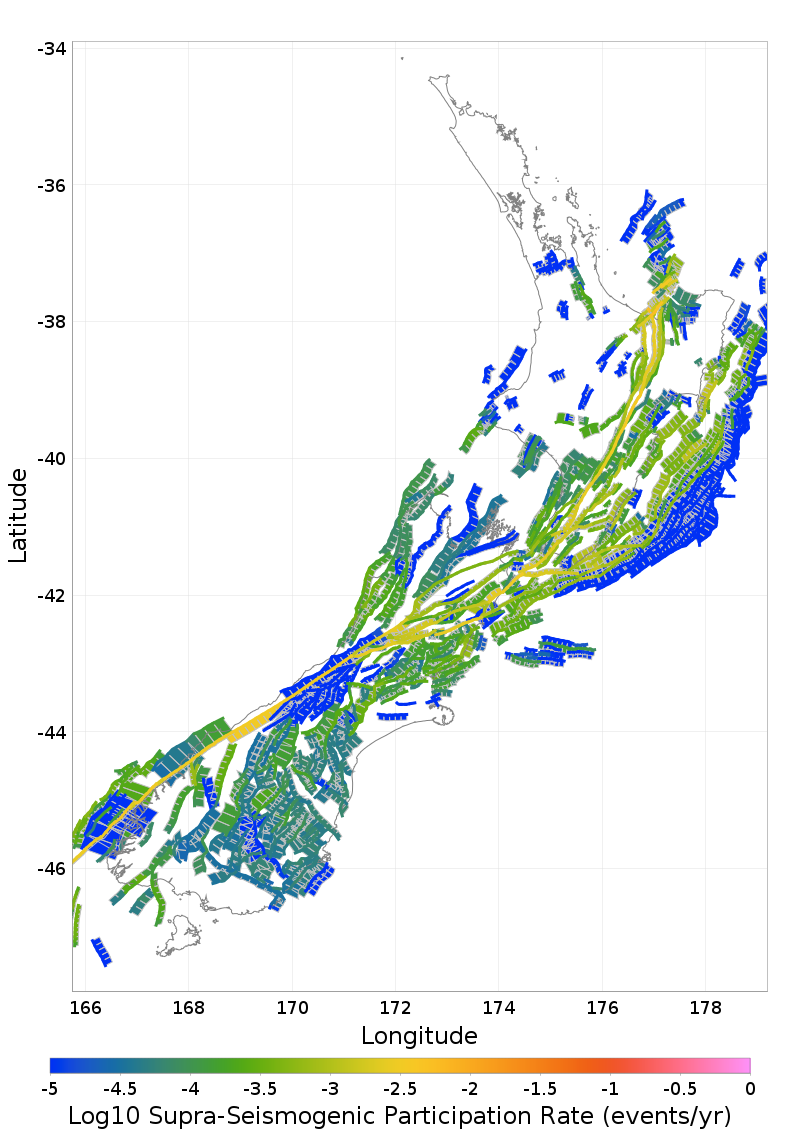
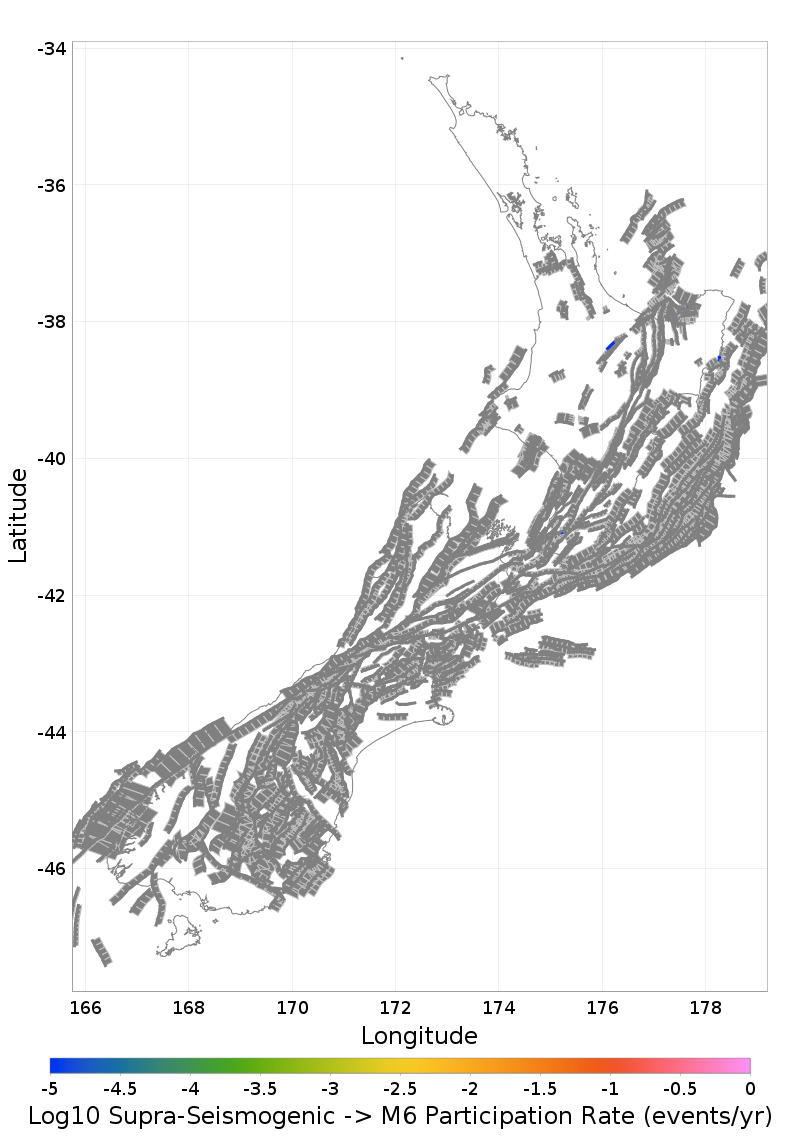
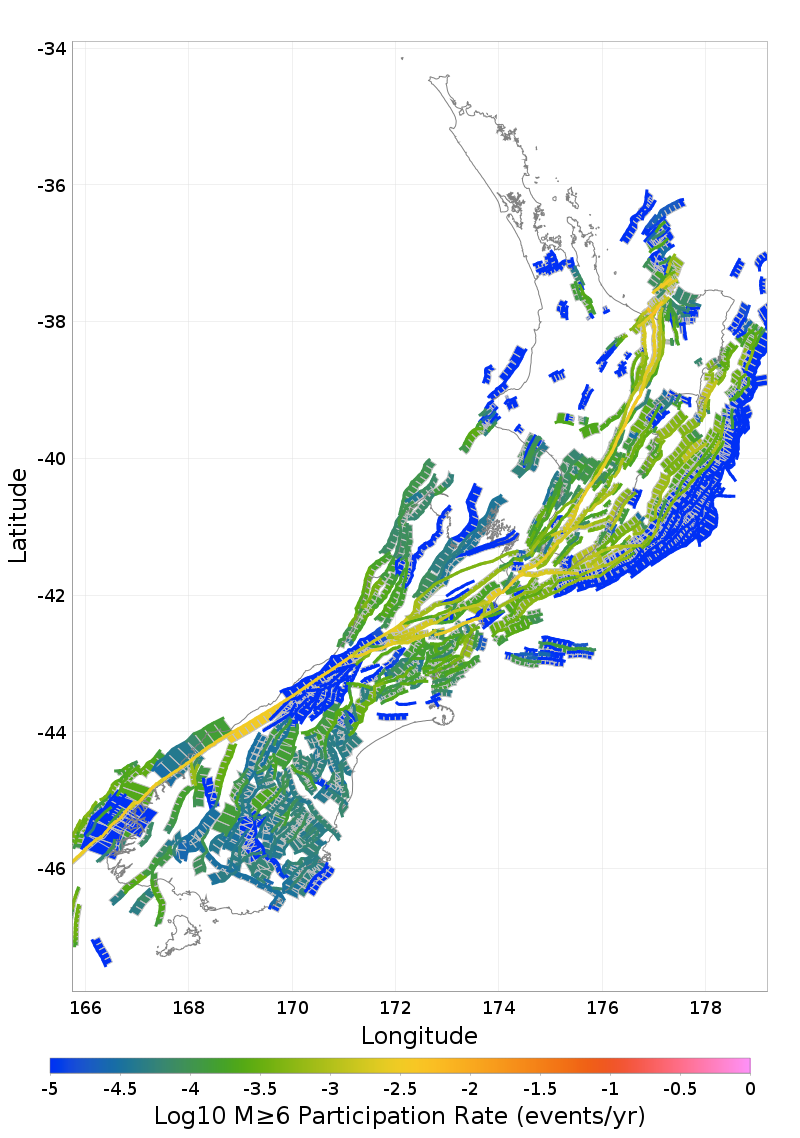
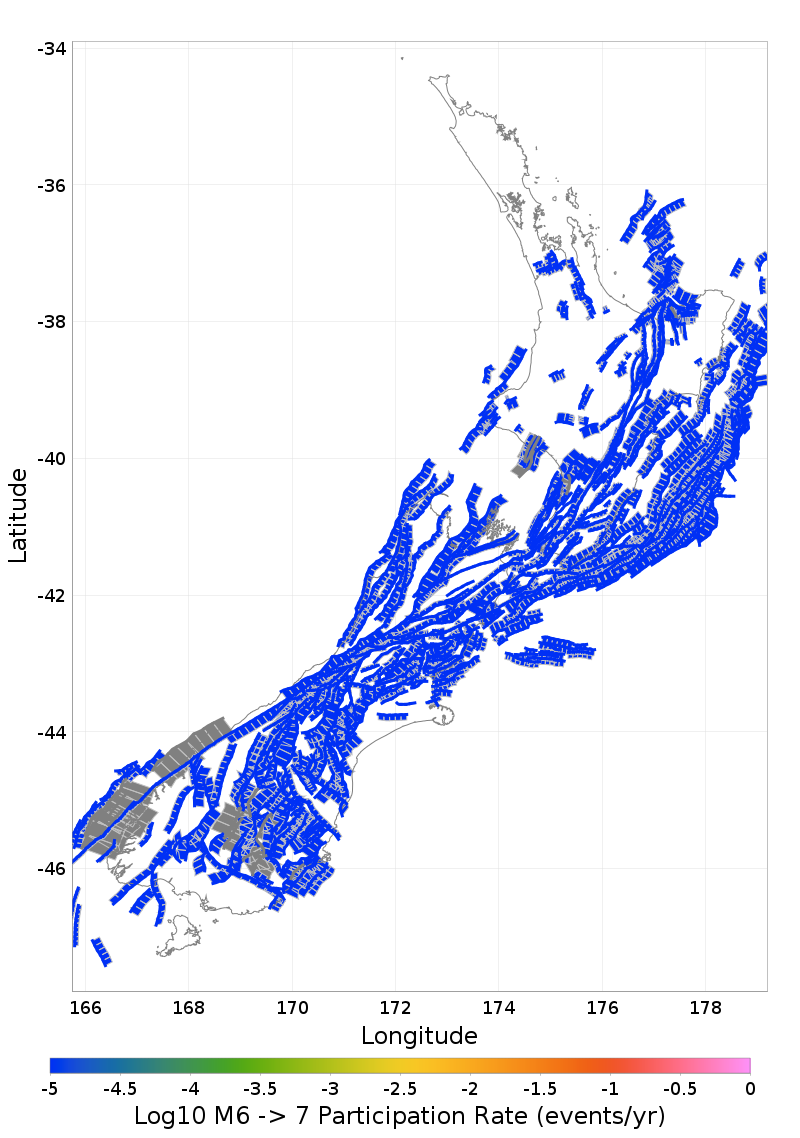
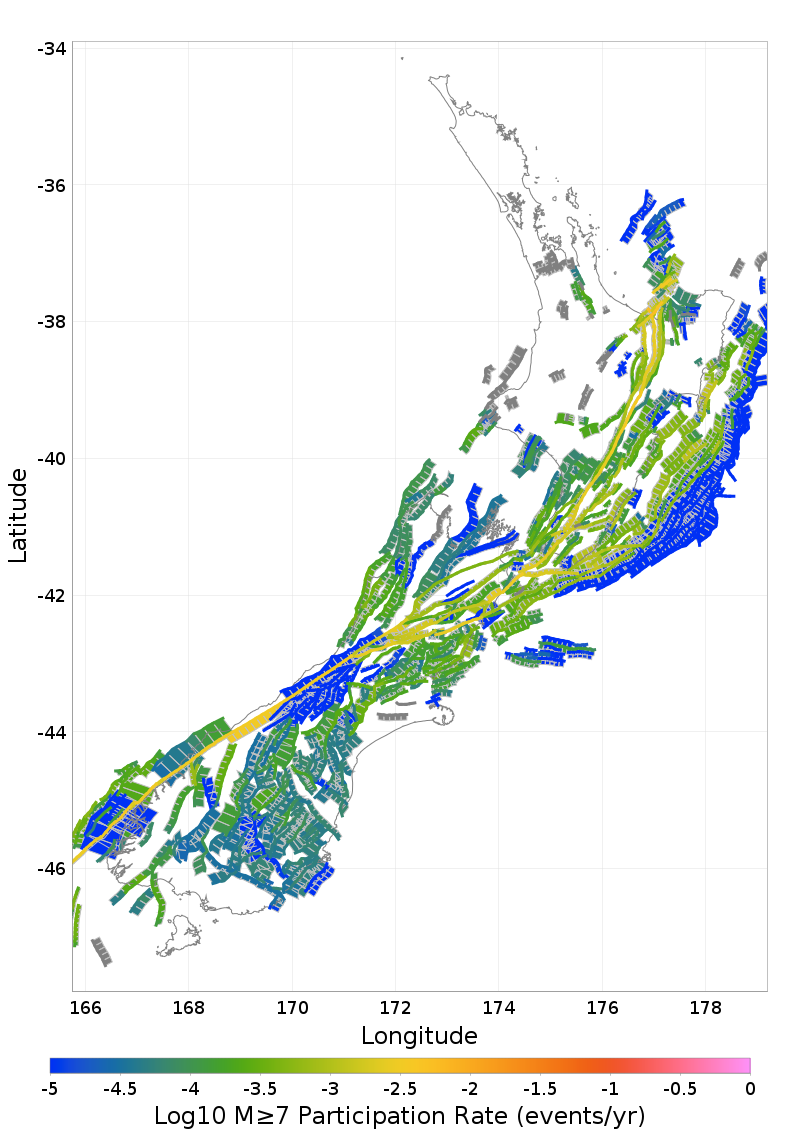
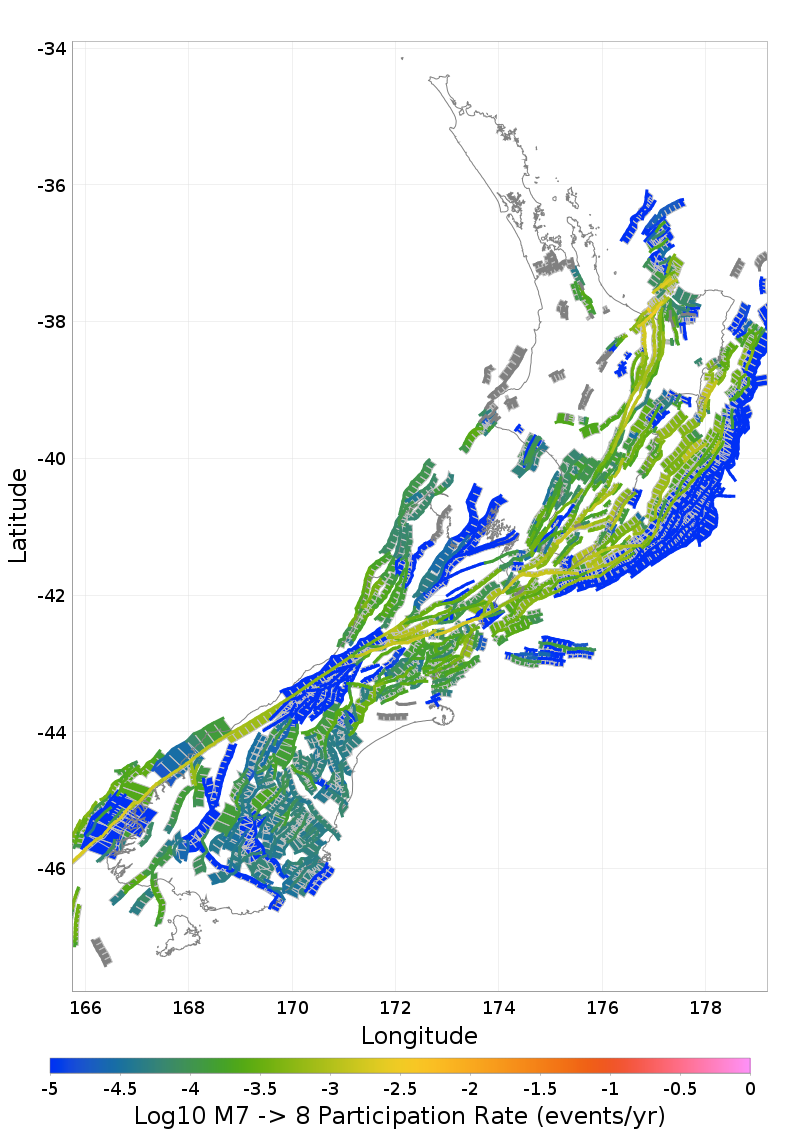
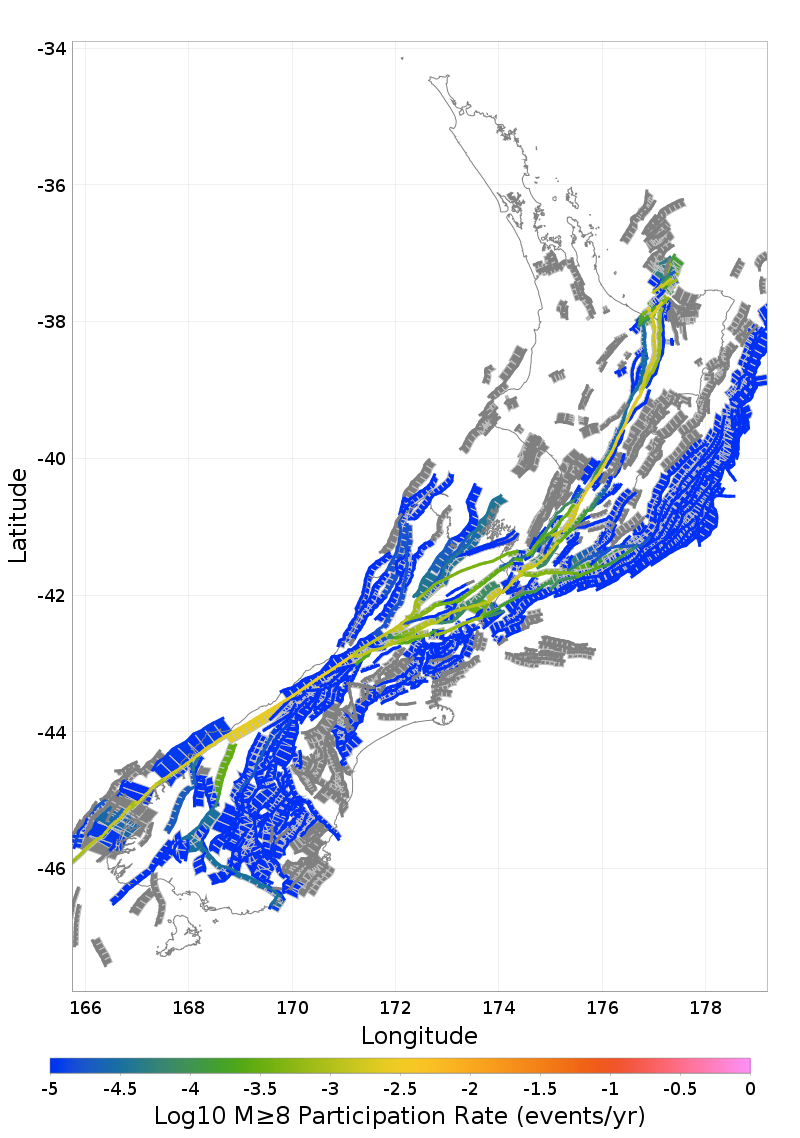
Participation Rates
(top)
Plausibility Configuration
(top)
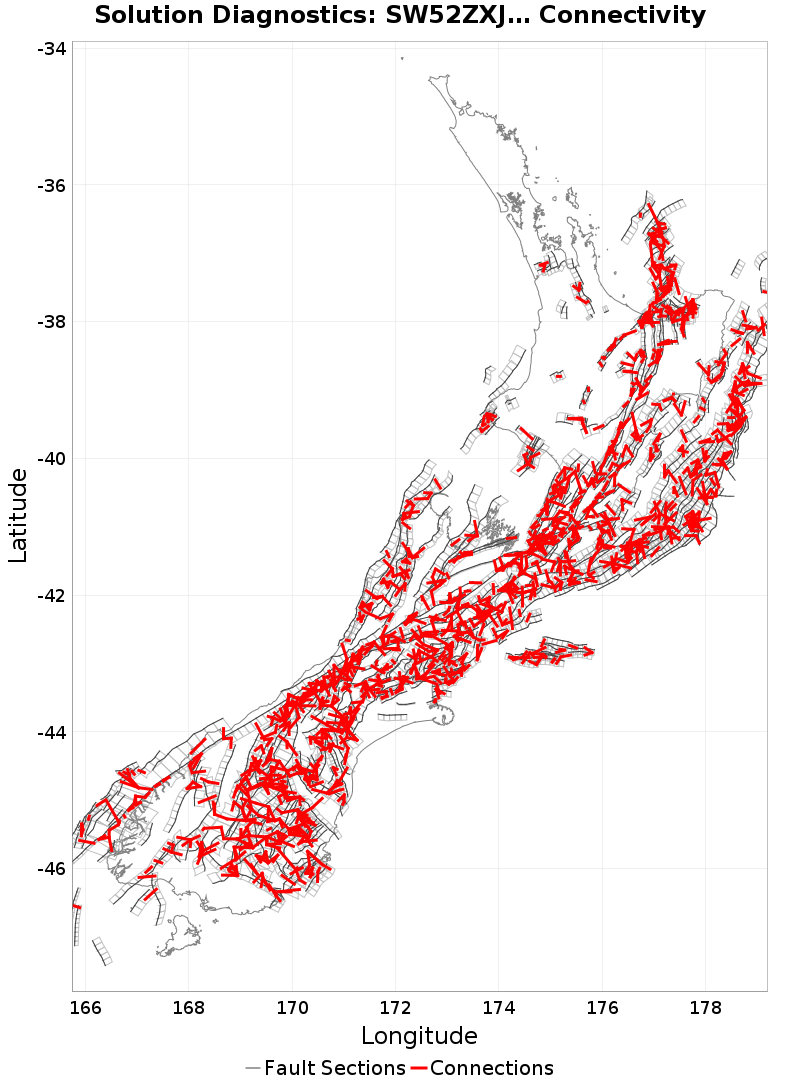
Connection Strategy
(top)
| Solution Diagnostics: SW52ZXJzaW9uU29sdXRpb246MTQ1MzUuMFZQb2VY |
|---|
| Name | Adaptive (r₀=6.0 km) Plausible (3 filters): maxDist=15 km, MultiEnds |
| Max Jump Dist | 15 km |
| Possible parent-section connections | Total: 3146, Avg: 4.47, Range: [0,29] |
| Actual connections (after applying filters) | Total: 1692, Avg: 5.07, Range: [1,35] |
Splays
(top)
| Solution Diagnostics: SW52ZXJzaW9uU29sdXRpb246MTQ1MzUuMFZQb2VY |
|---|
| Max Allowed Splays | 0 |
Plausibility Filters
(top)
| Solution Diagnostics: SW52ZXJzaW9uU29sdXRpb246MTQ1MzUuMFZQb2VY |
|---|
| Cumulative Rake Change ≤360 |
| Min Sections Per Parent |
| Net Rupture [[Sum [Num ≥0]]/Count]>0.75 |
| No Indirect Connections |
| P(Rel Slip Rate (@incr.)) ≥0.05 |
| P(Shaw07 [R₀=3]) ≥0.001 |
| Path [P(Rel CFF Sect, Fav15km) ≥0.01, P(CFF Sect Ratio, N=2, Fav15km) ≥0.5] |
Rupture Scalar Histograms
(top)
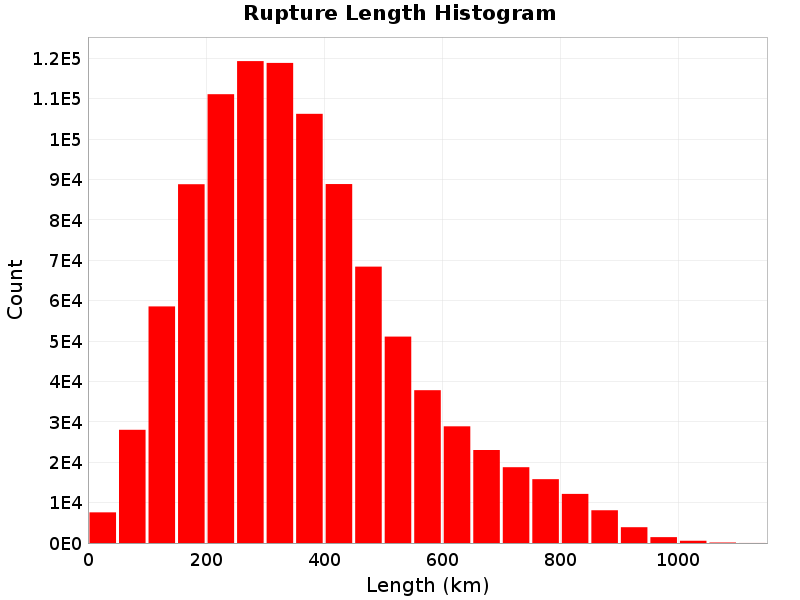
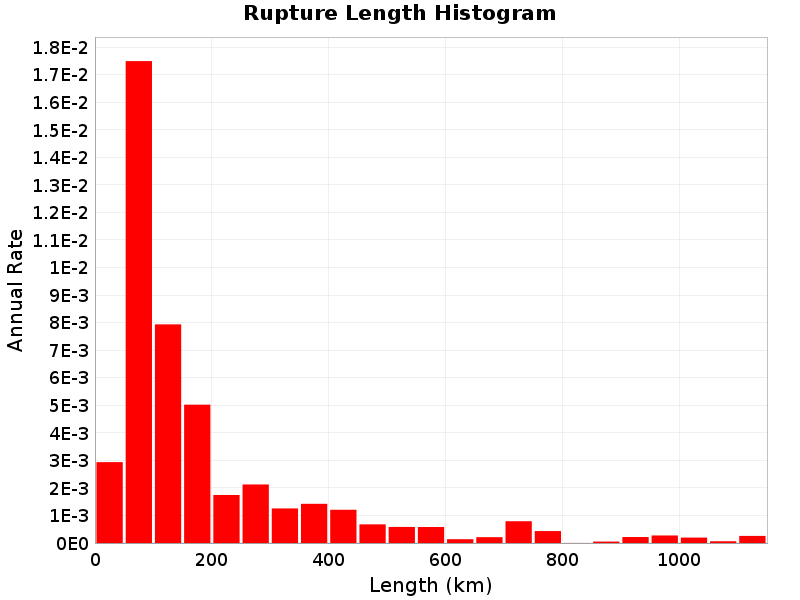
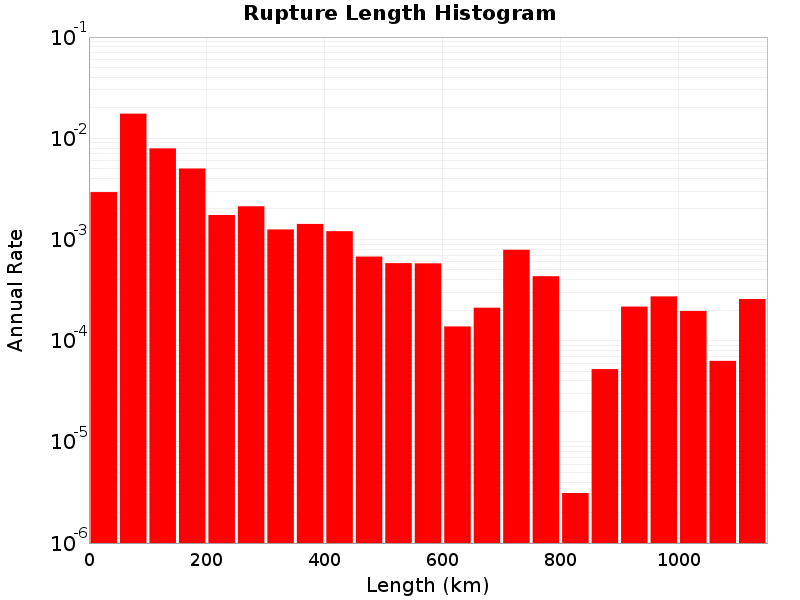
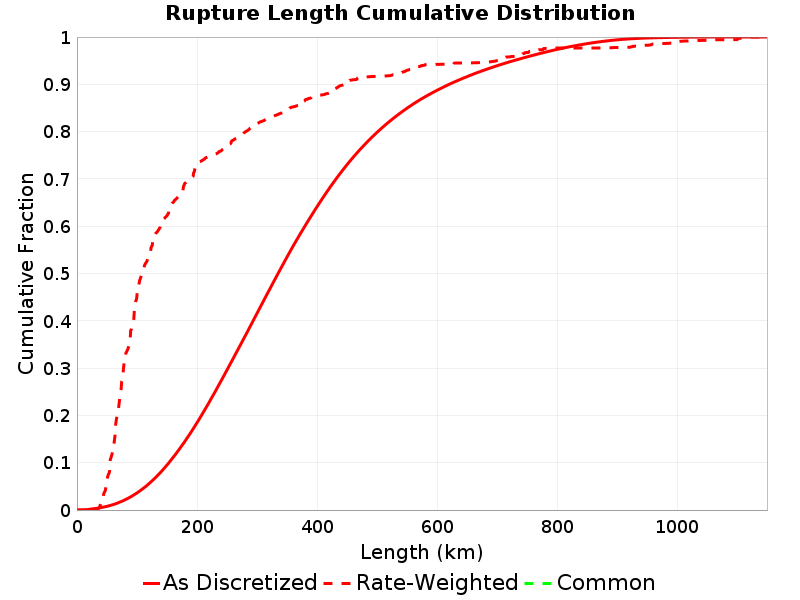
Rupture Length
(top)
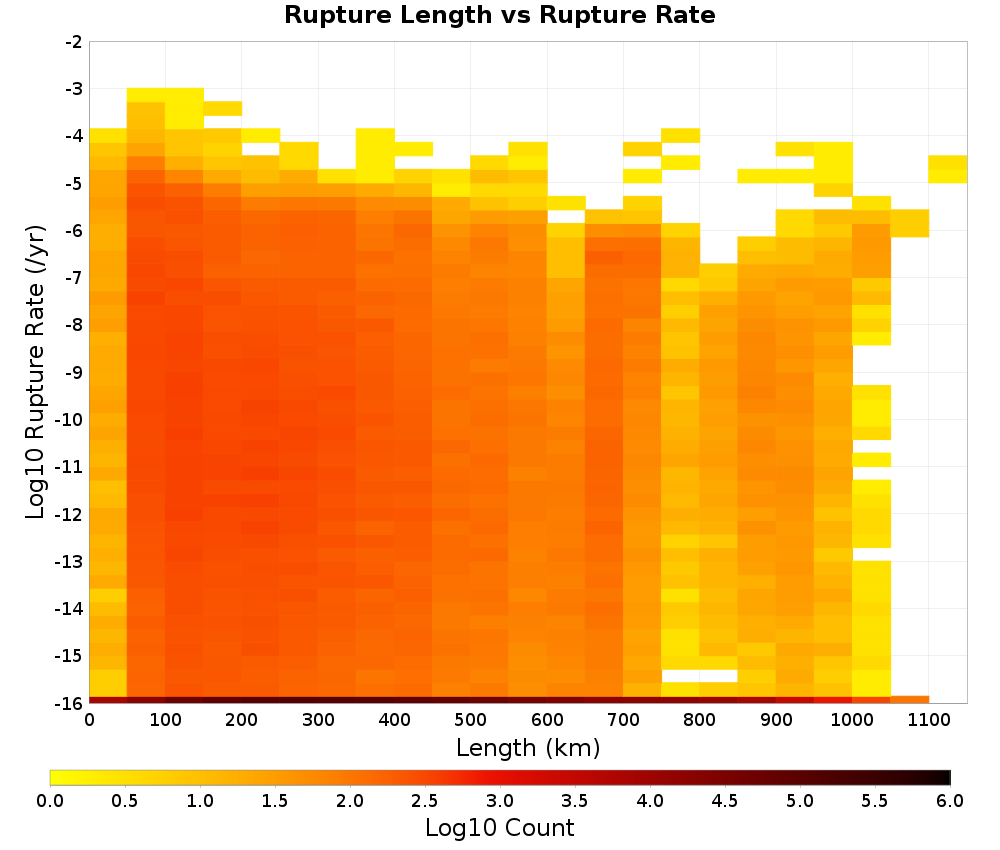
Total length (km) of the rupture, not including jumps or gaps.
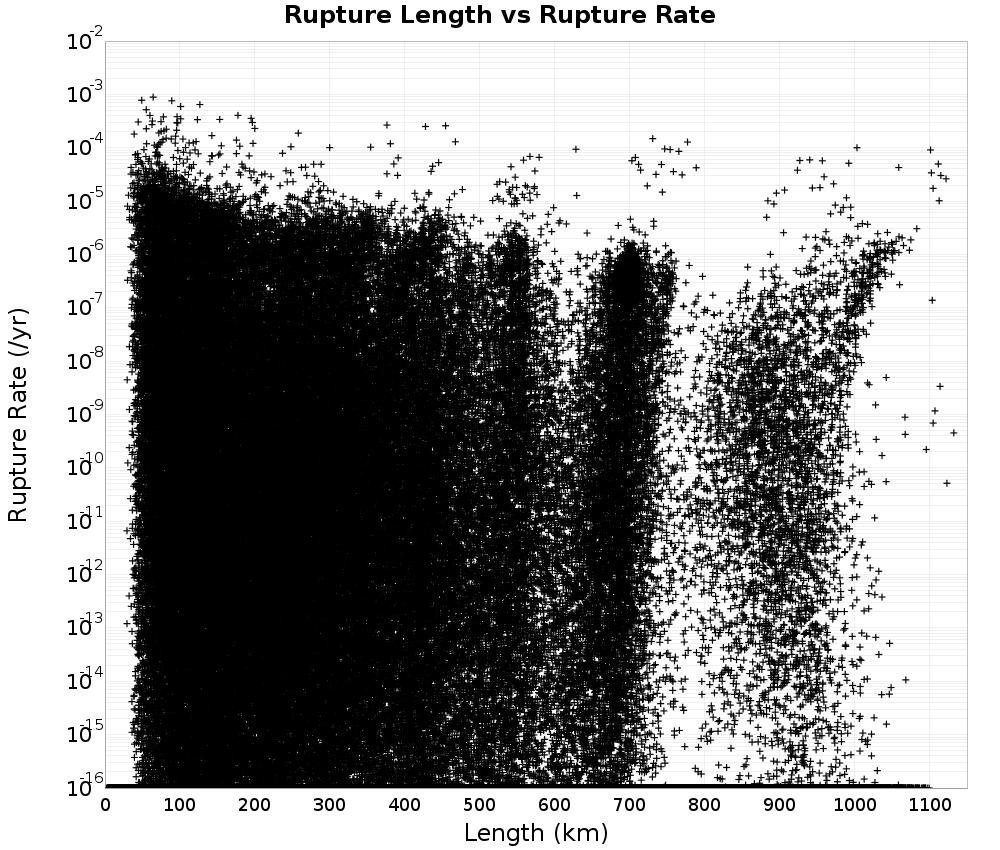
Rupture Length vs Rupture Rate
(top)
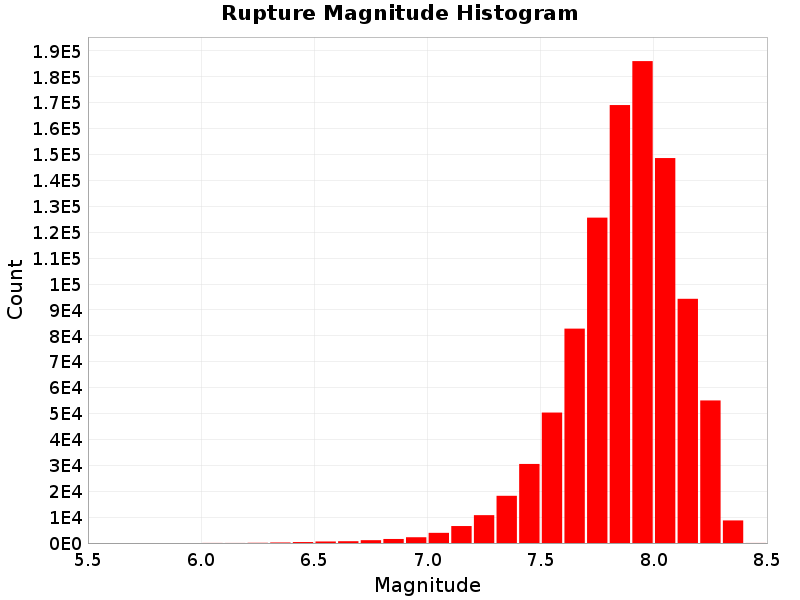
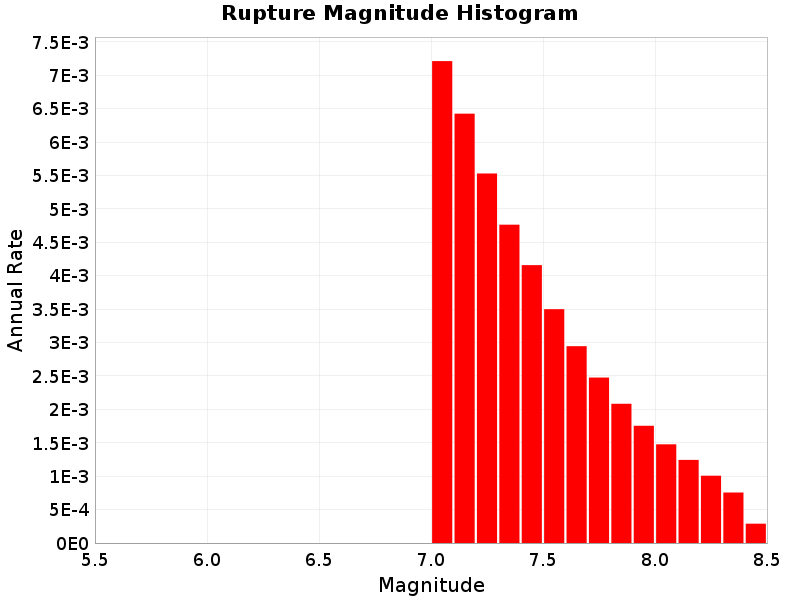
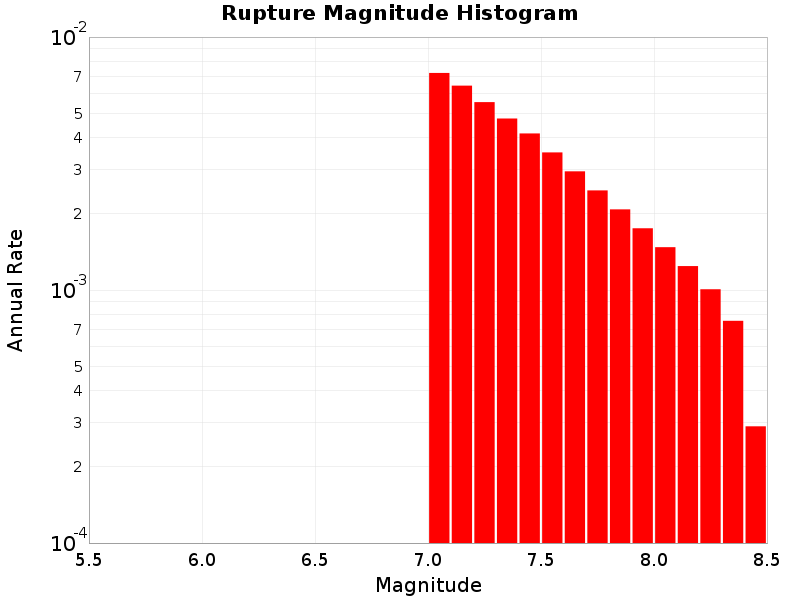
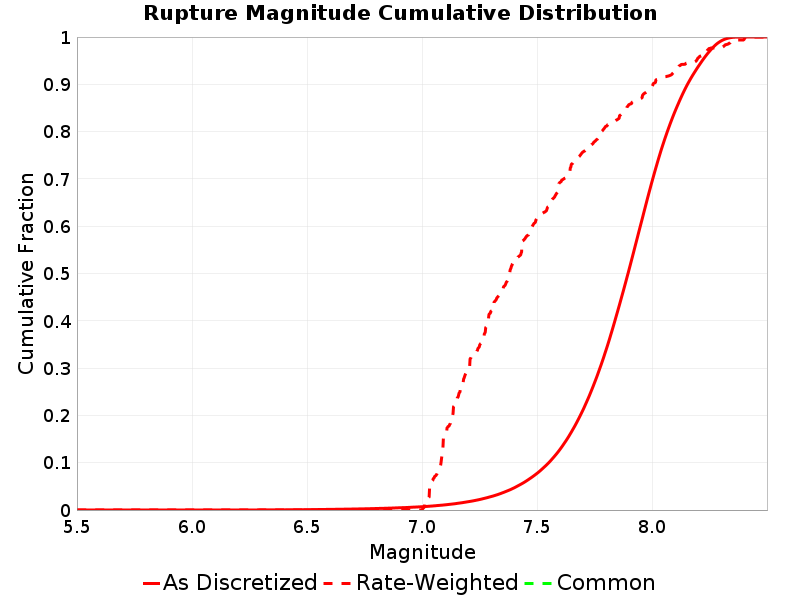
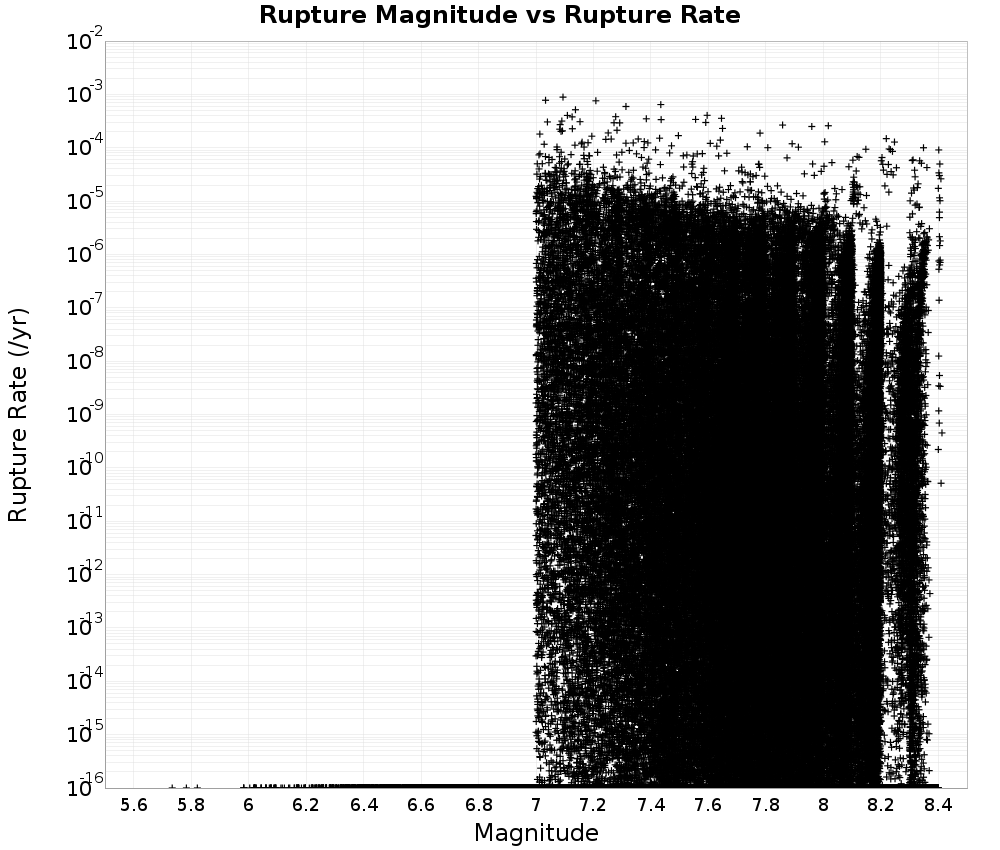
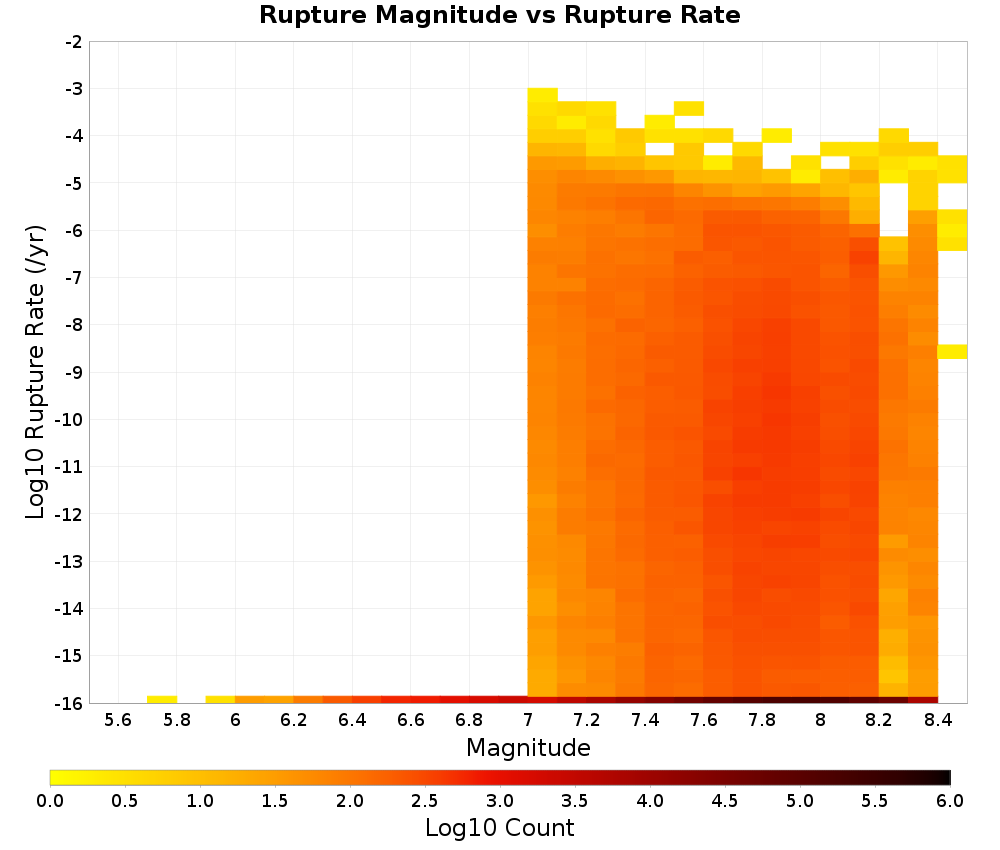
Rupture Magnitude
(top)
Magnitude of the rupture.
Rupture Magnitude vs Rupture Rate
(top)
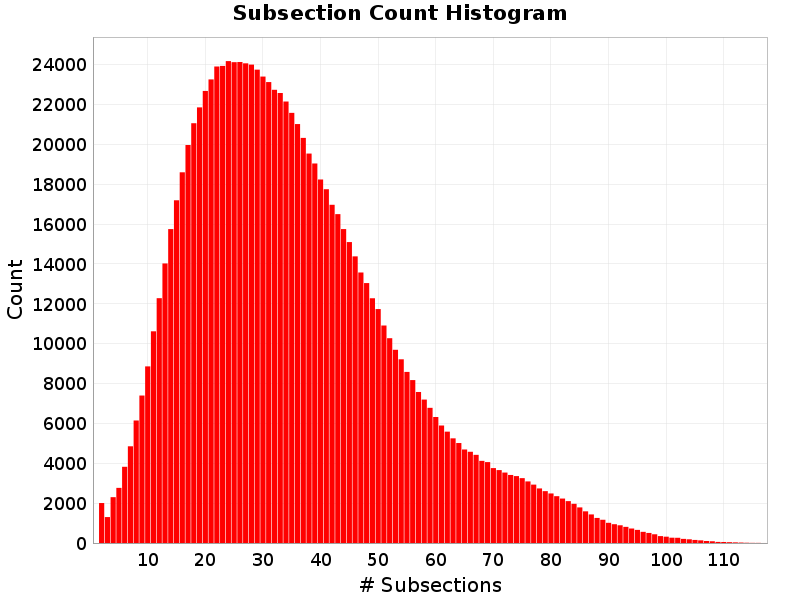
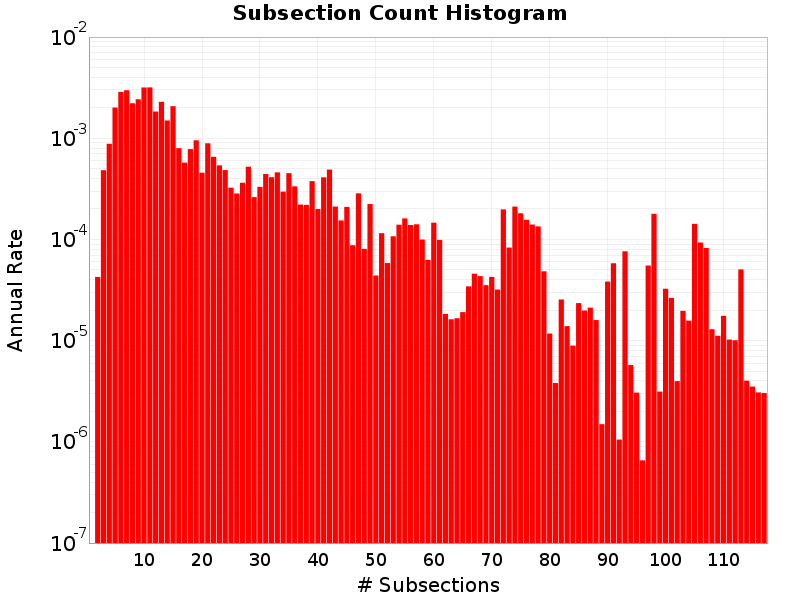
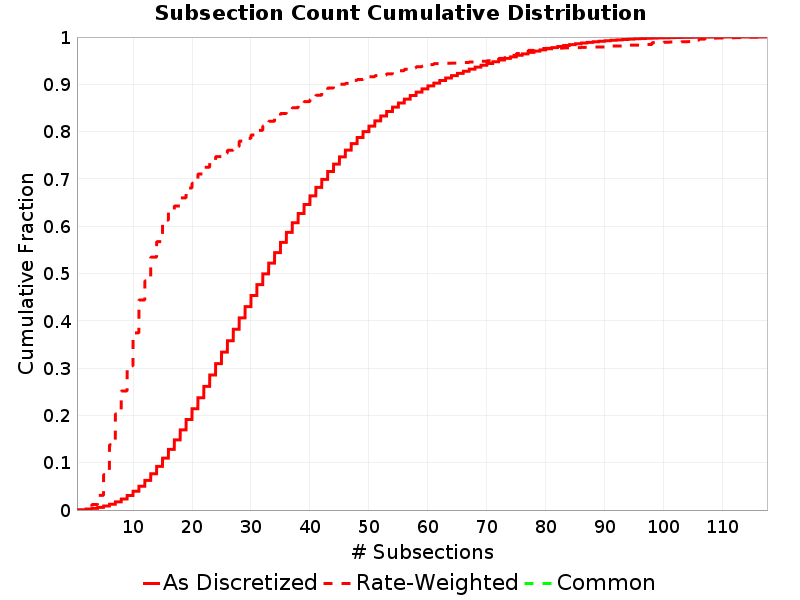
Subsection Count
(top)
Total number of subsections involved in a rupture.
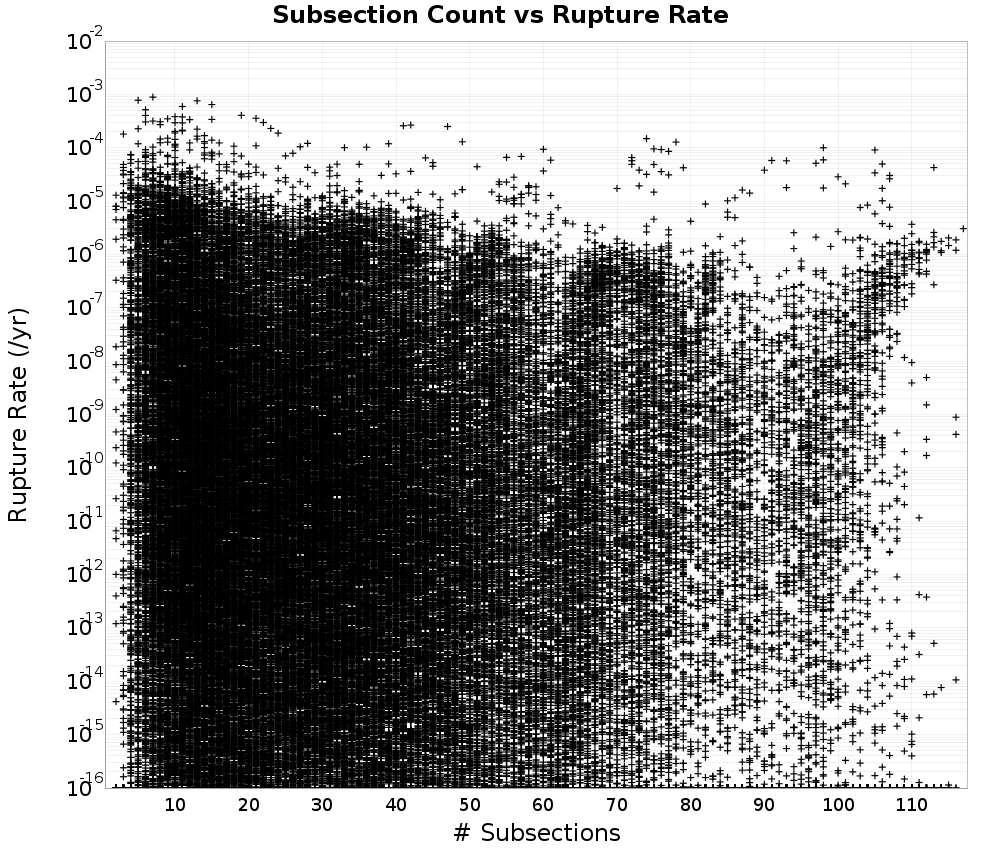
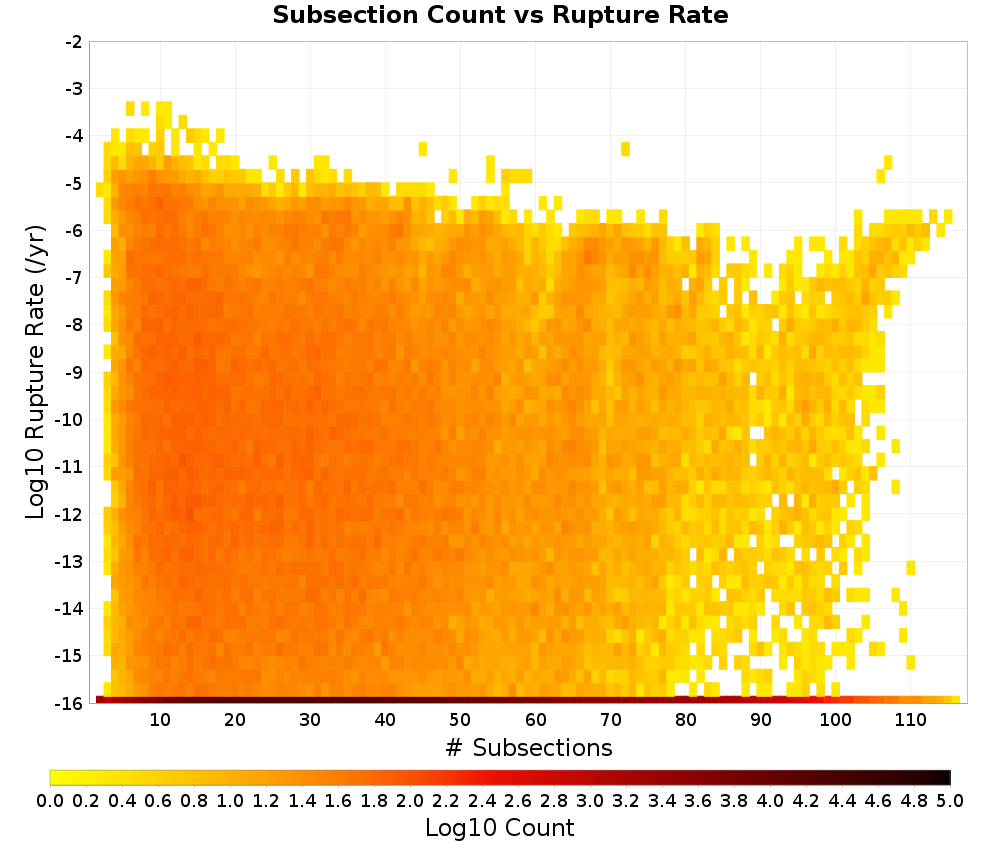
Subsection Count vs Rupture Rate
(top)
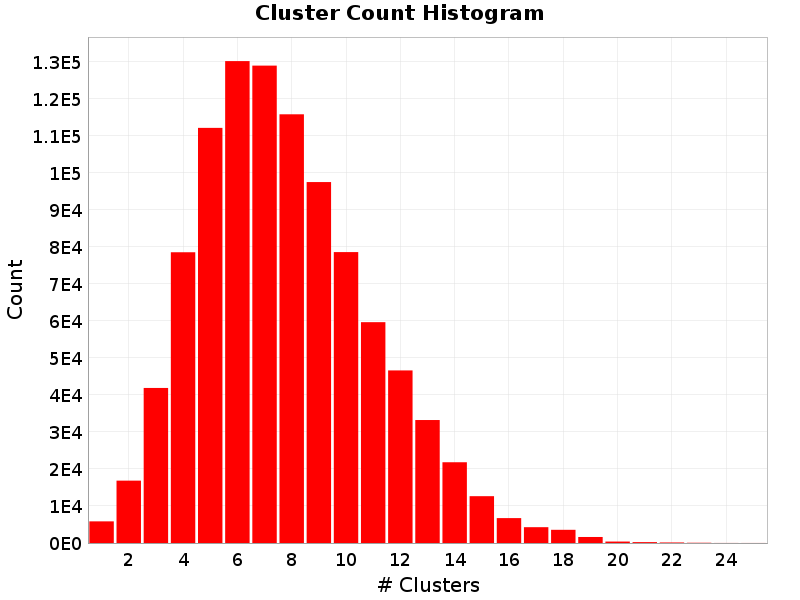
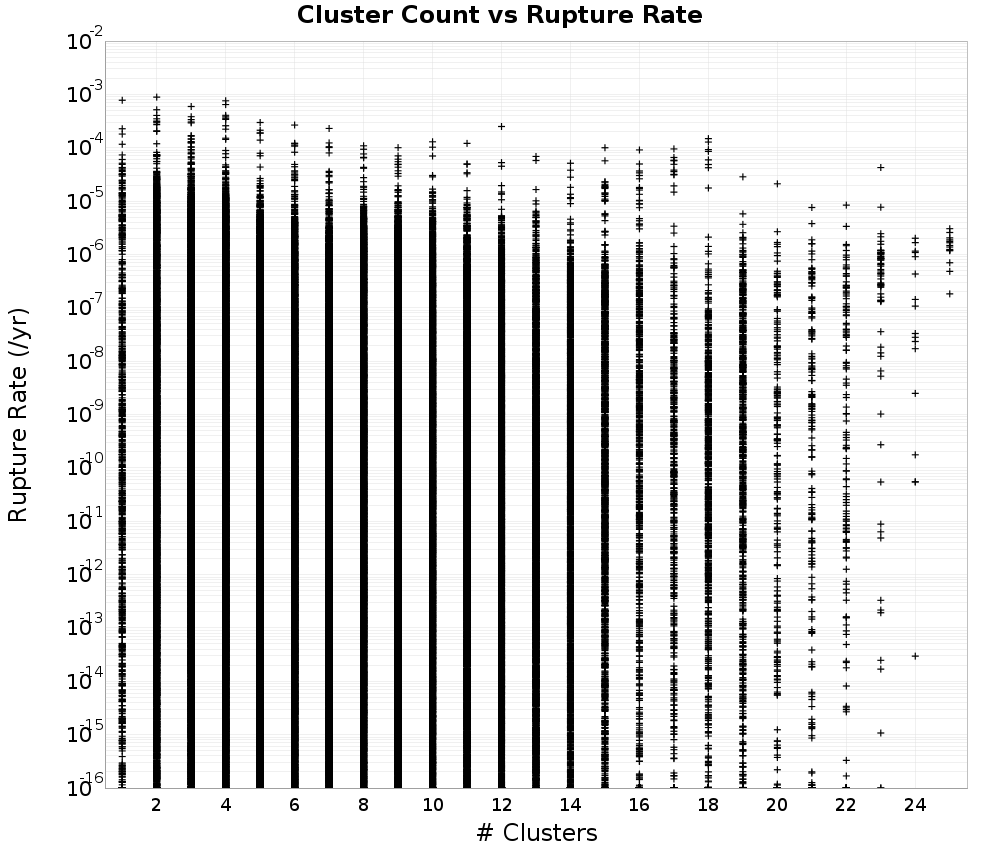
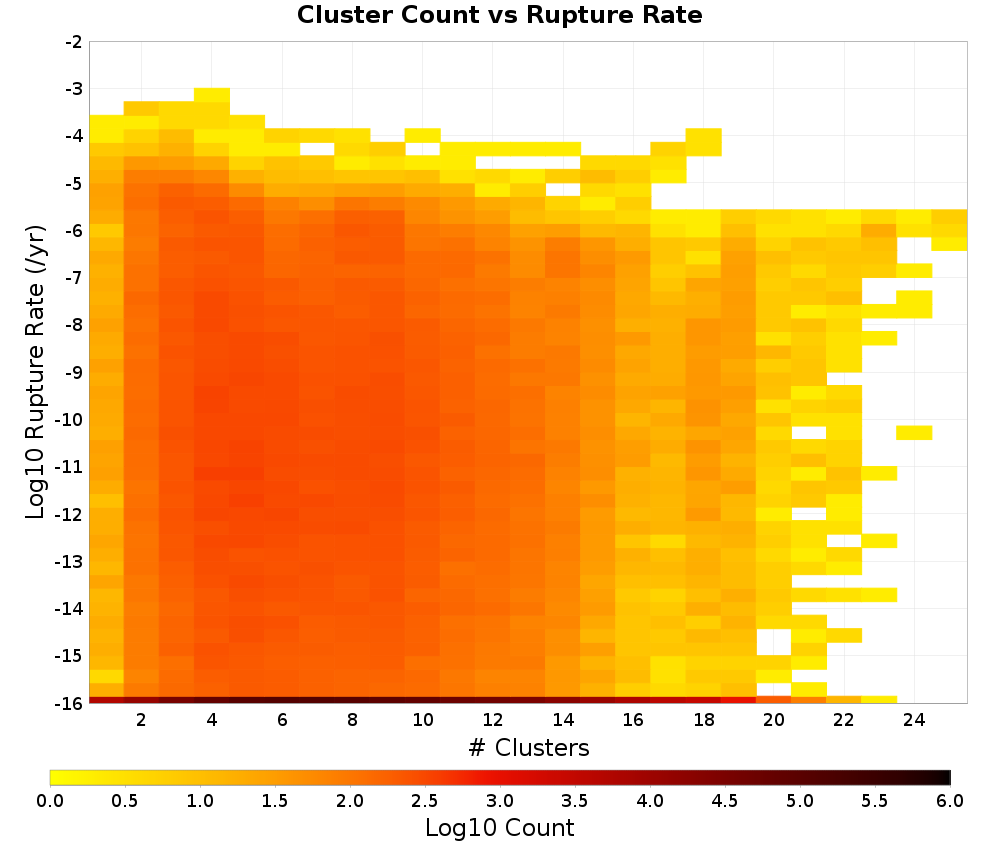
Cluster Count
(top)
Total number of clusters (of contiguous subsections on the same parent fault section) a rupture.
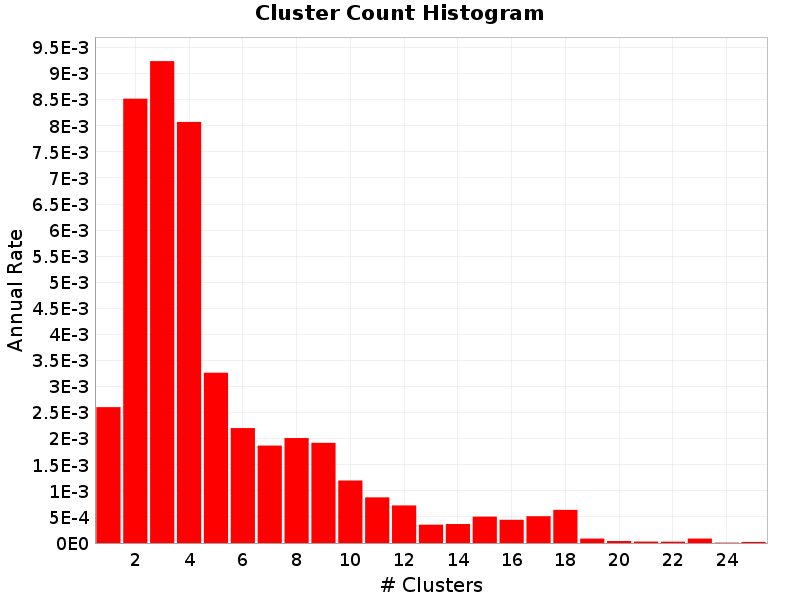
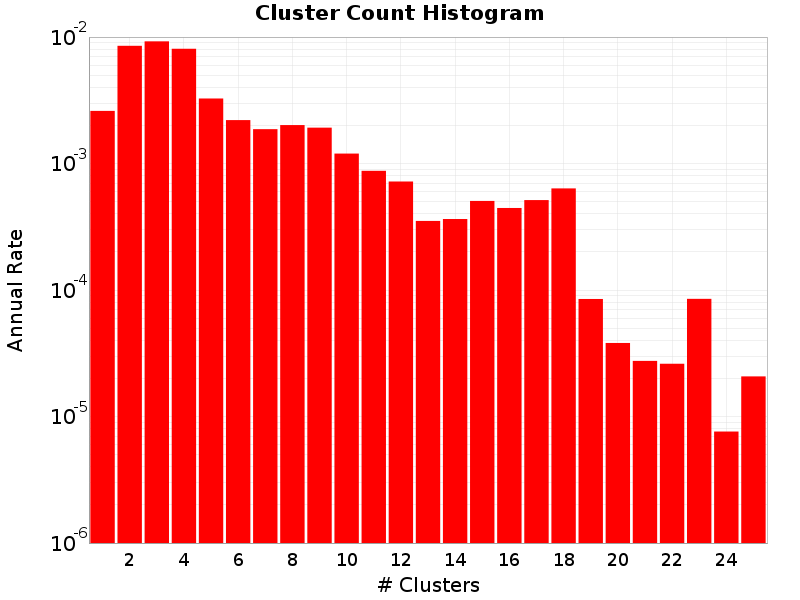
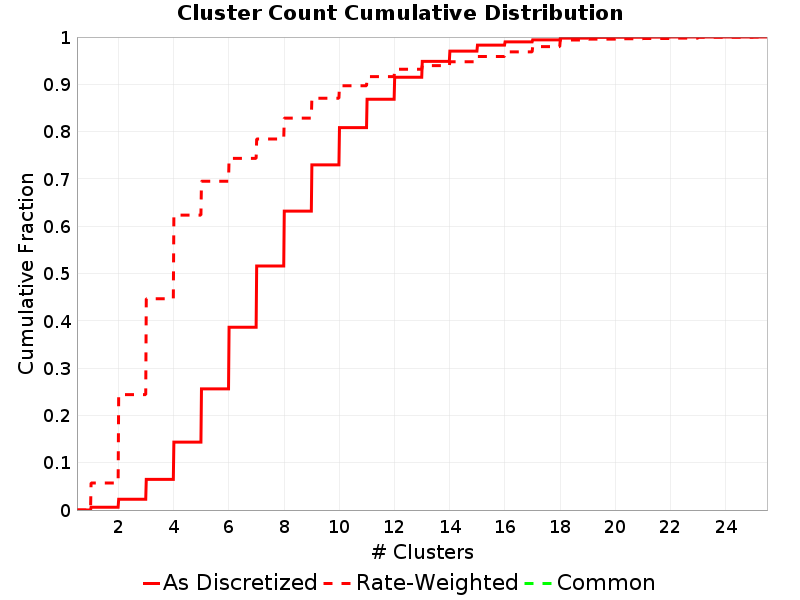
Cluster Count vs Rupture Rate
(top)
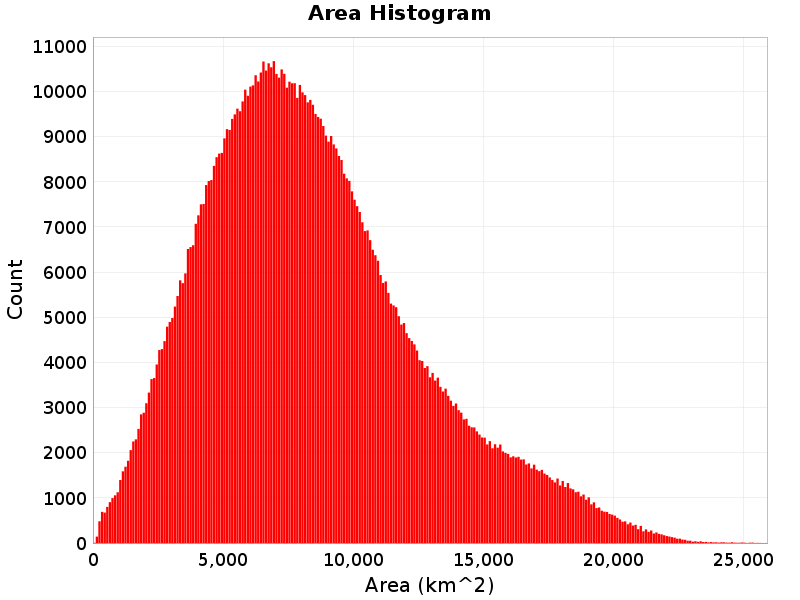
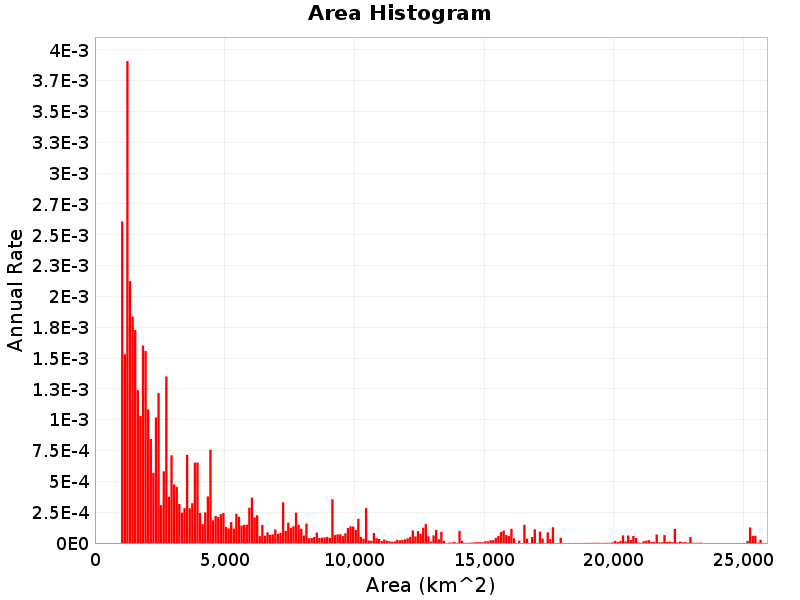
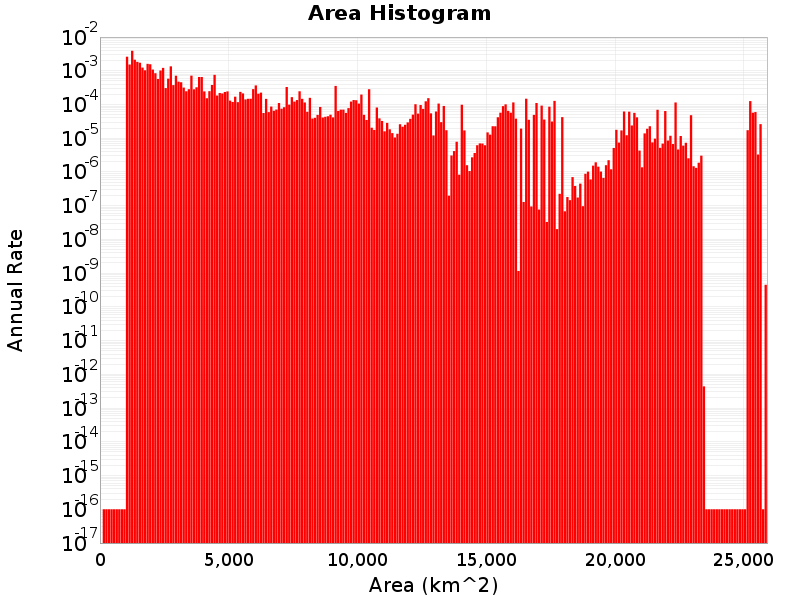
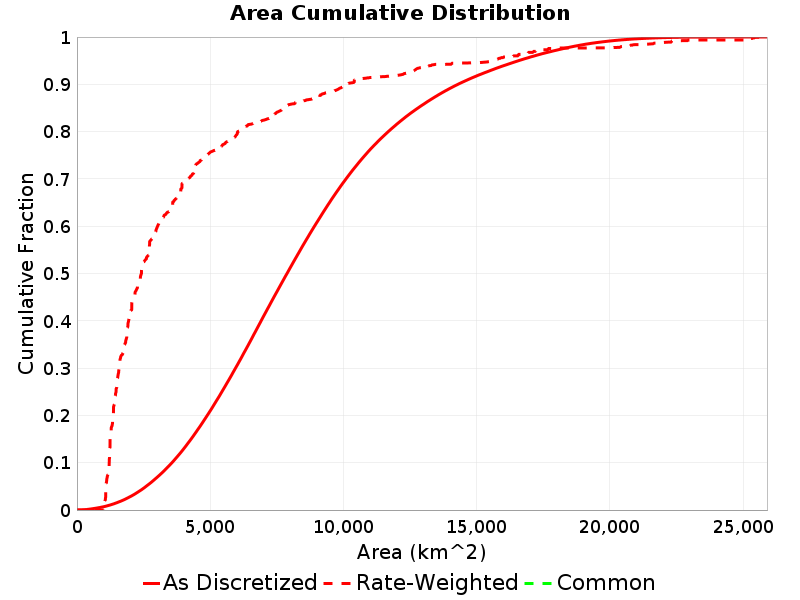
Area
(top)
Total area of the rupture (km^2).
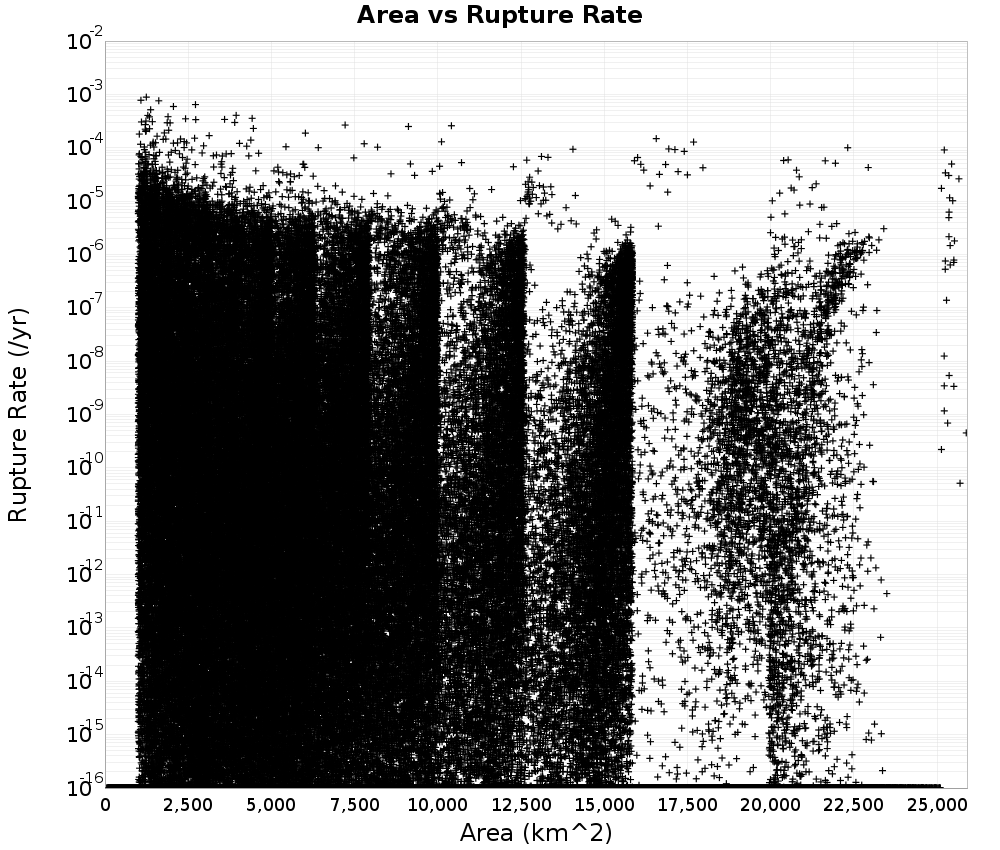
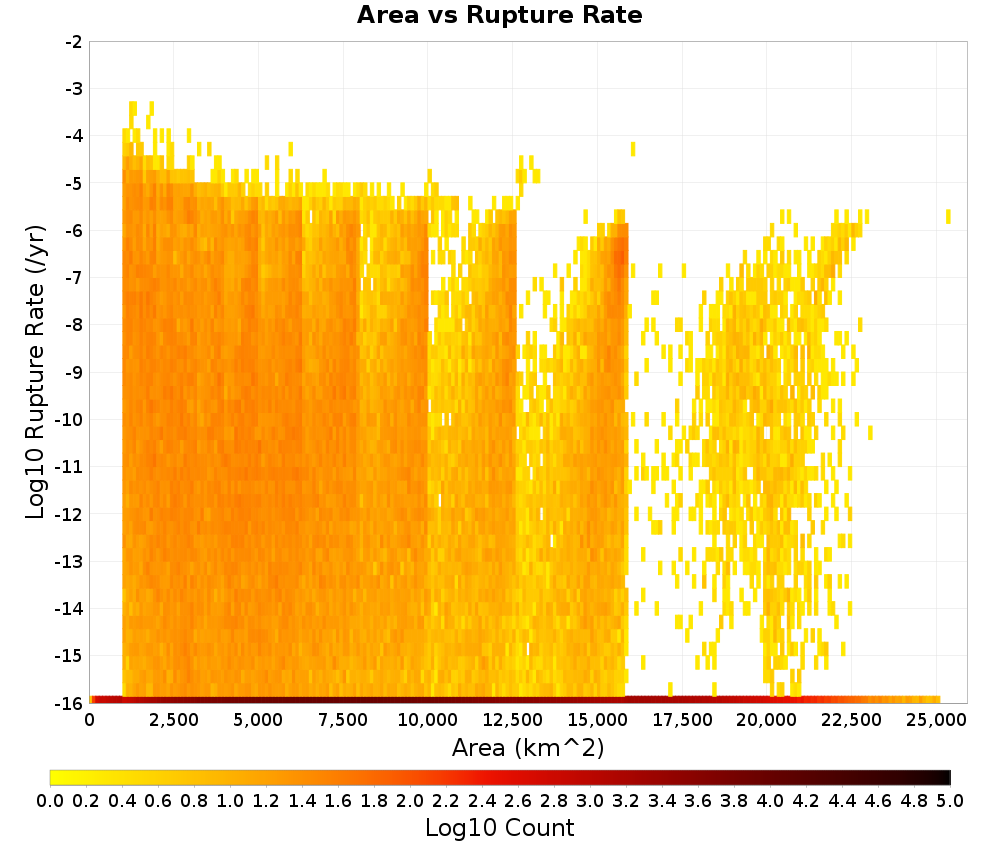
Area vs Rupture Rate
(top)
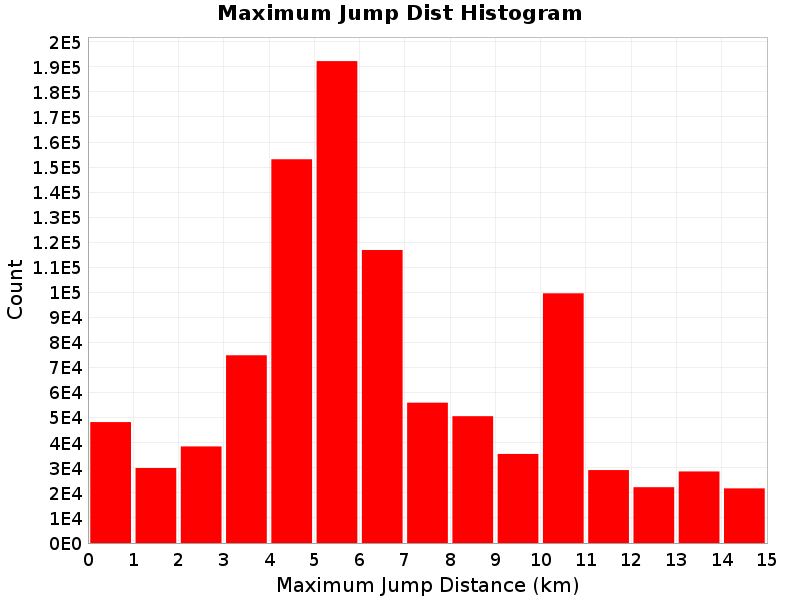
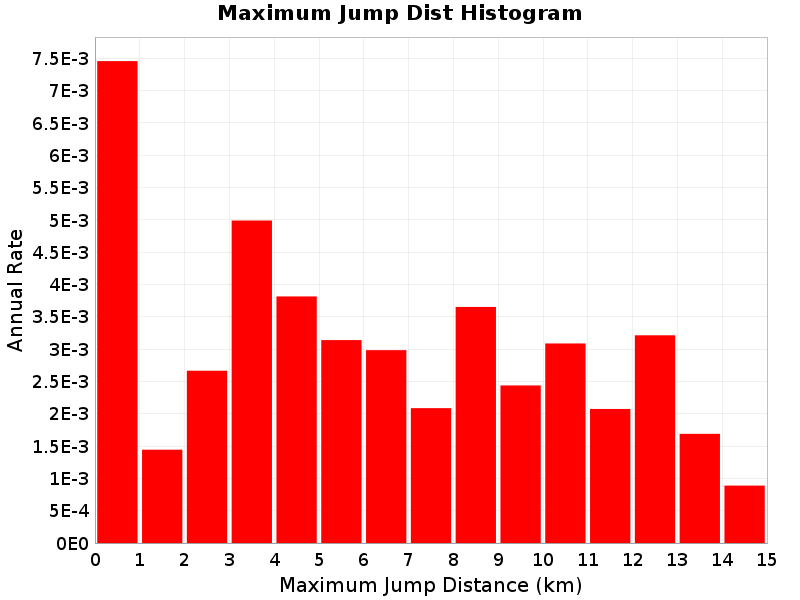
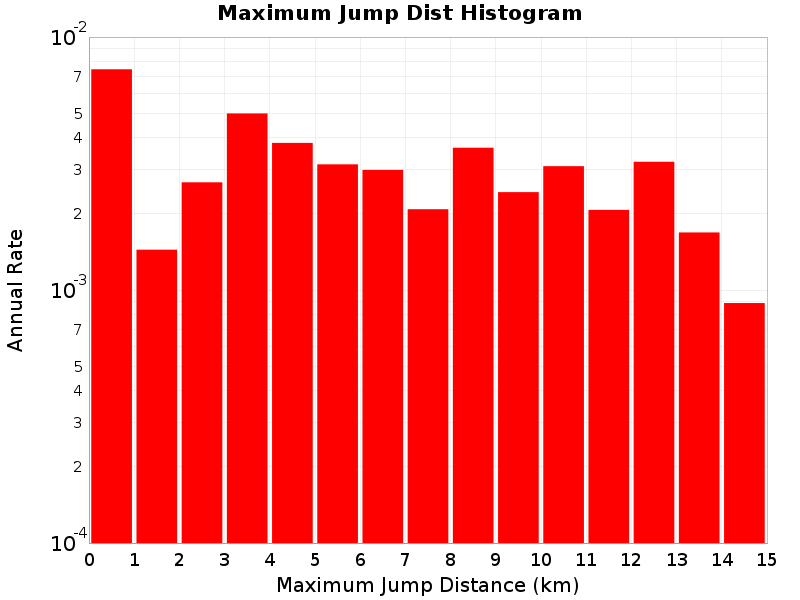
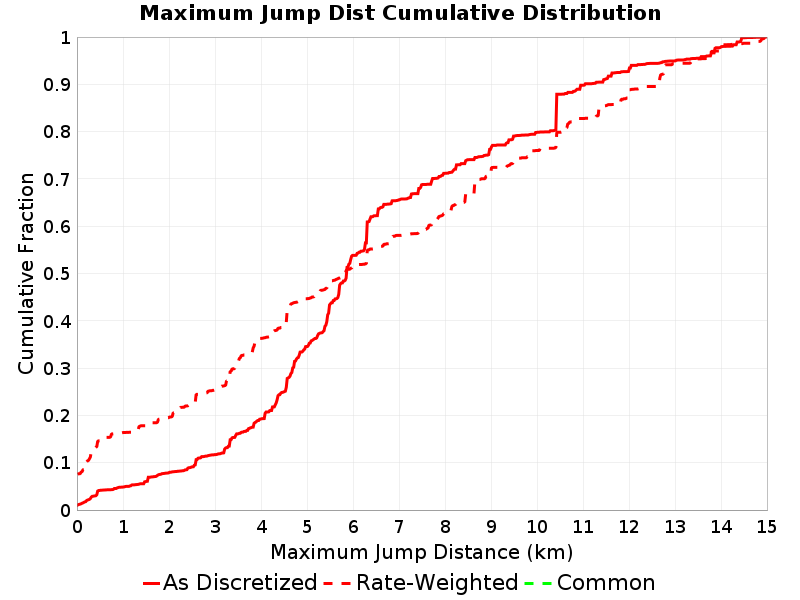
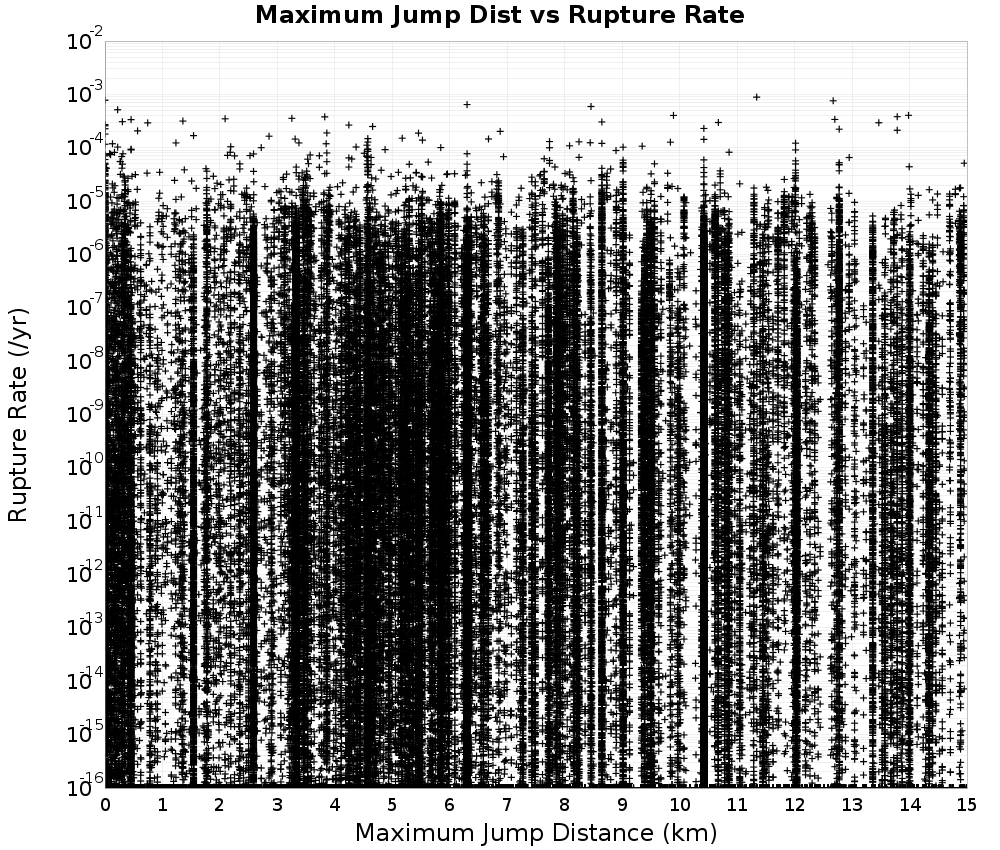
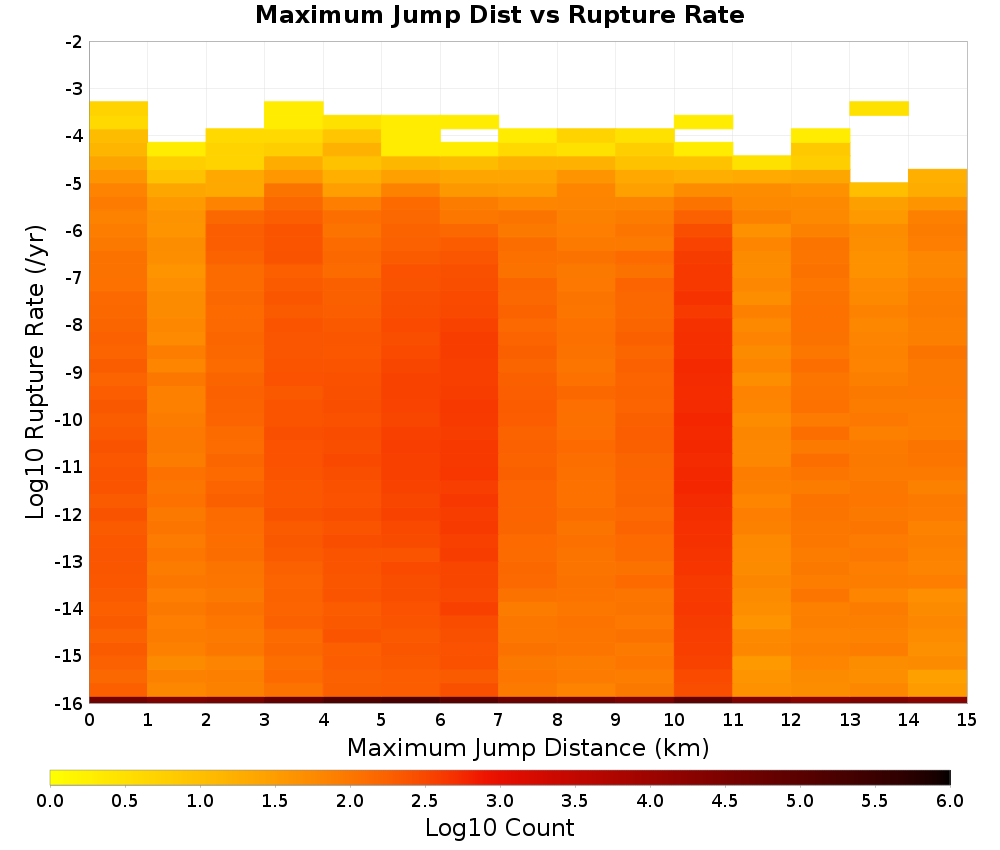
Maximum Jump Dist
(top)
The maximum jump distance in the rupture.
Maximum Jump Dist vs Rupture Rate
(top)
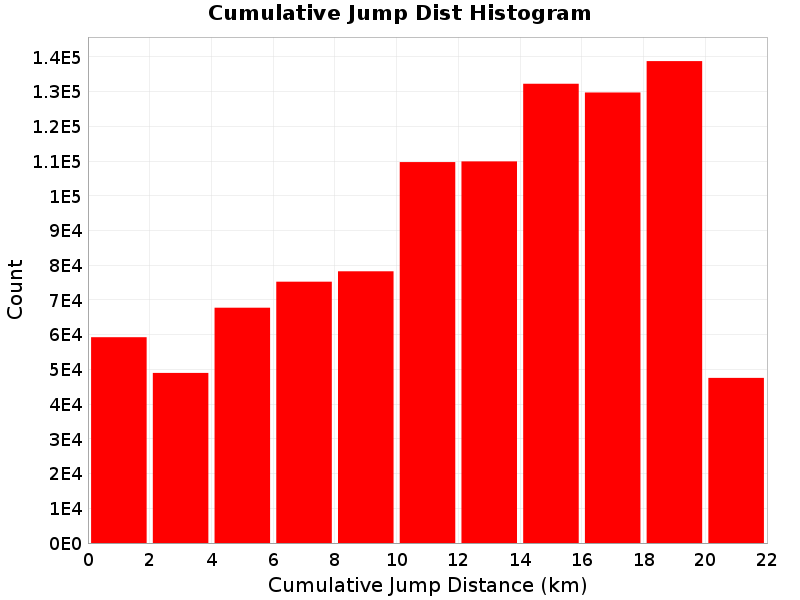
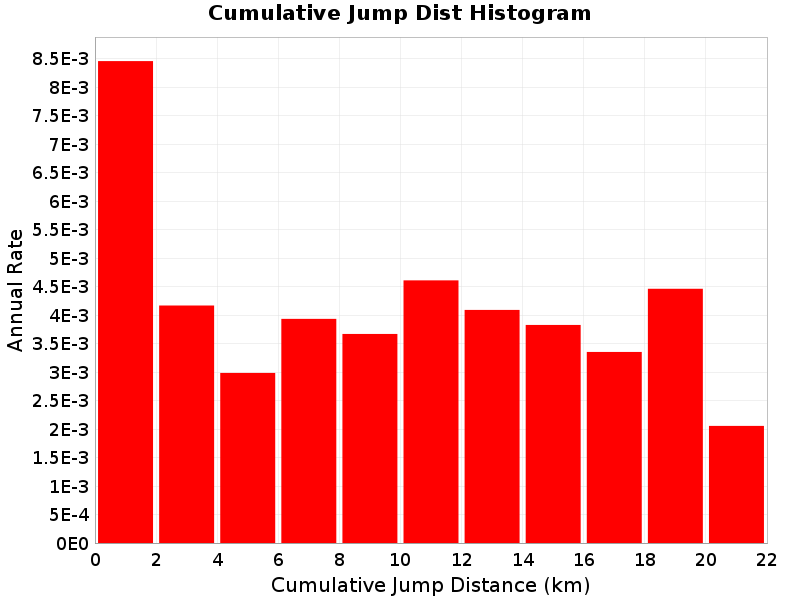
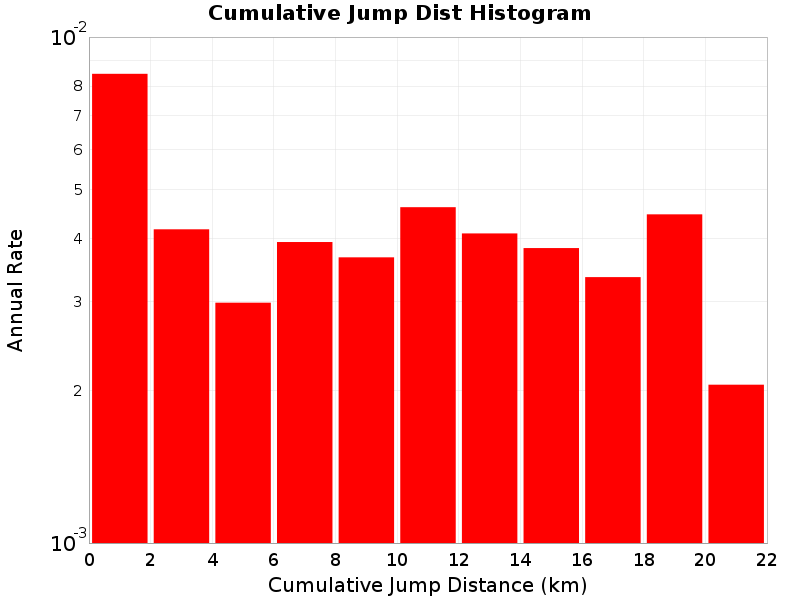
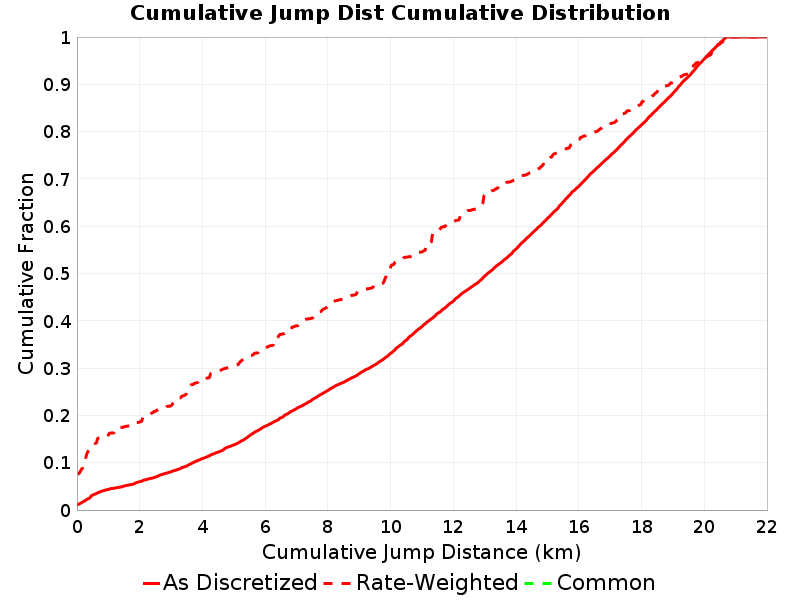
Cumulative Jump Dist
(top)
The total cumulative jump distance summed over all jumps in the rupture.
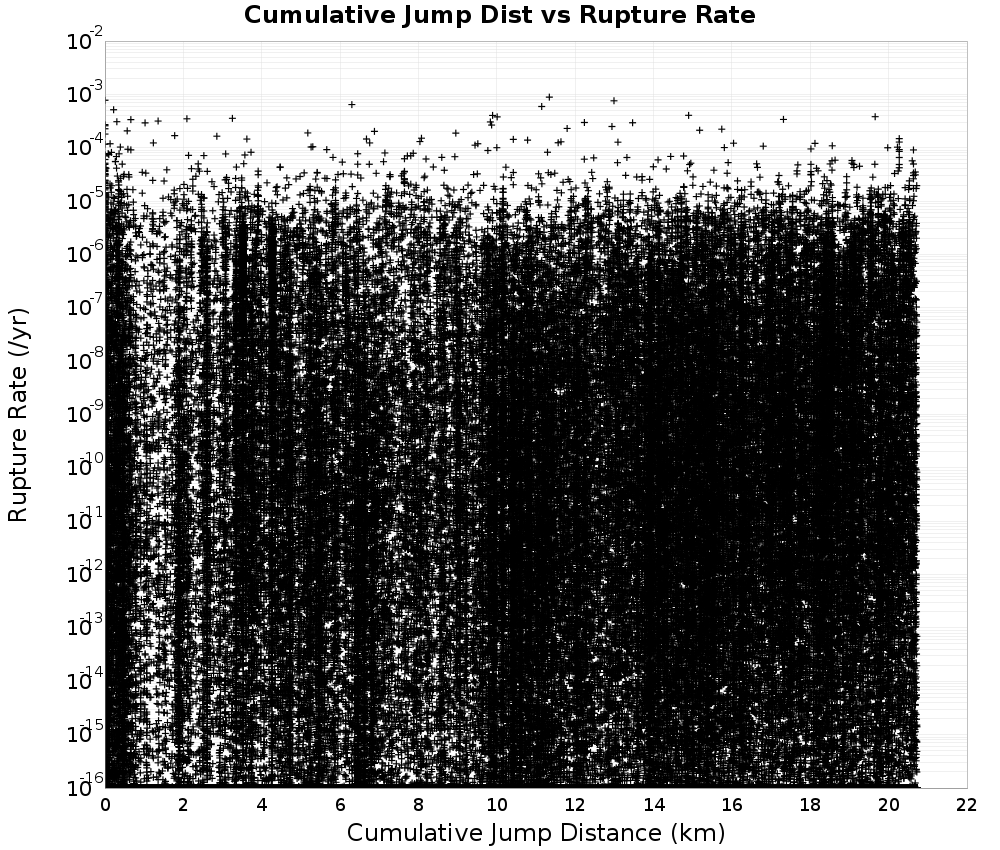
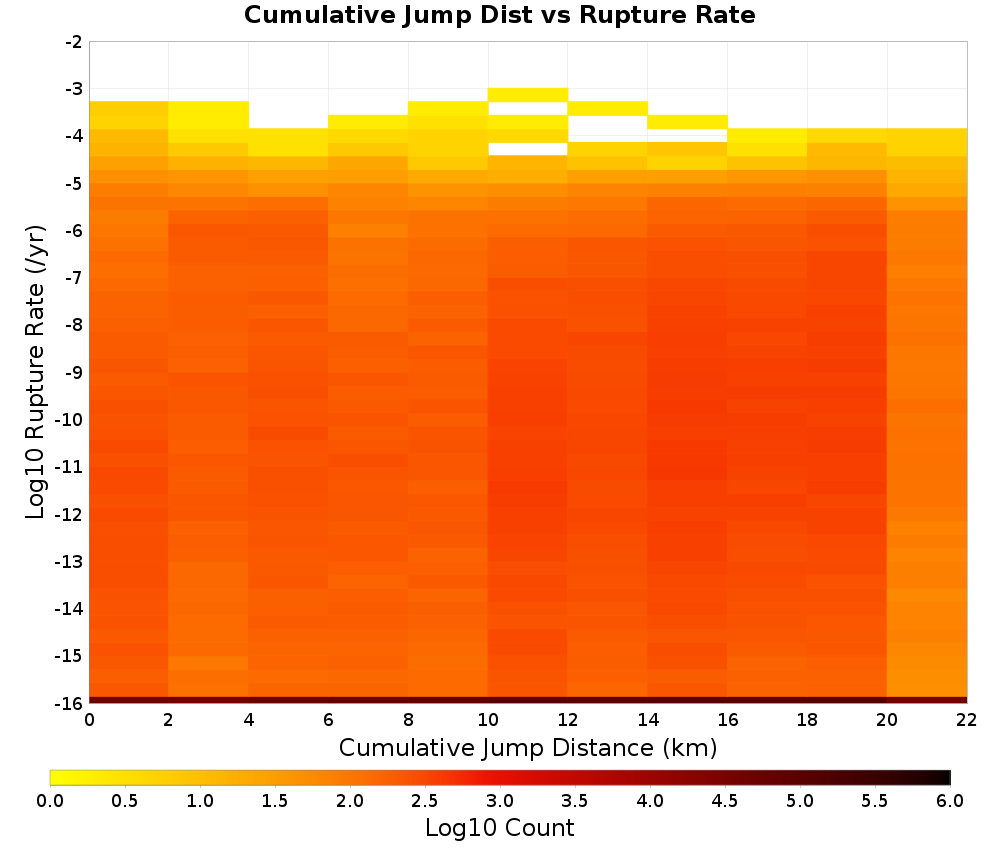
Cumulative Jump Dist vs Rupture Rate
(top)
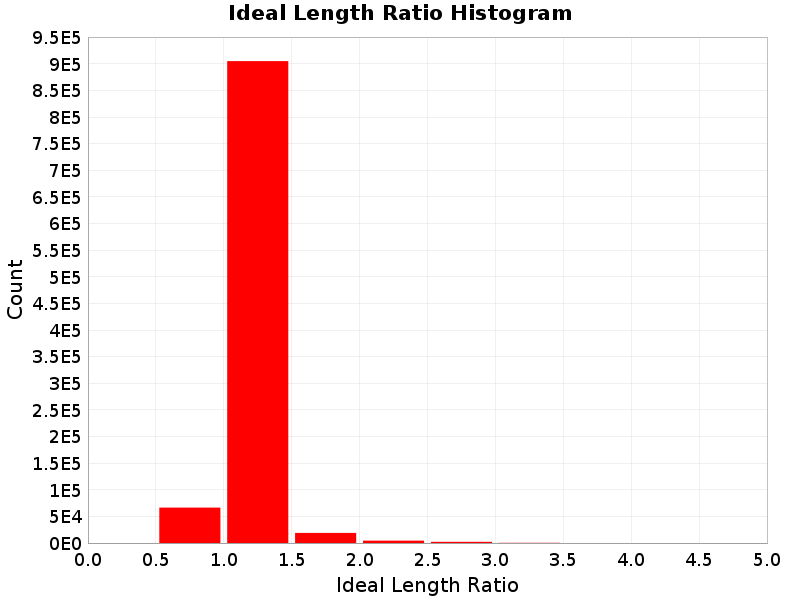
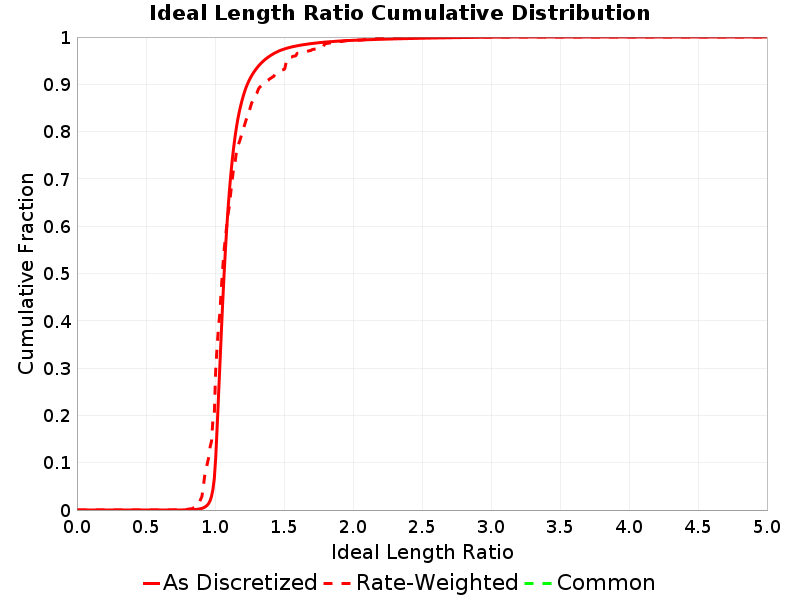
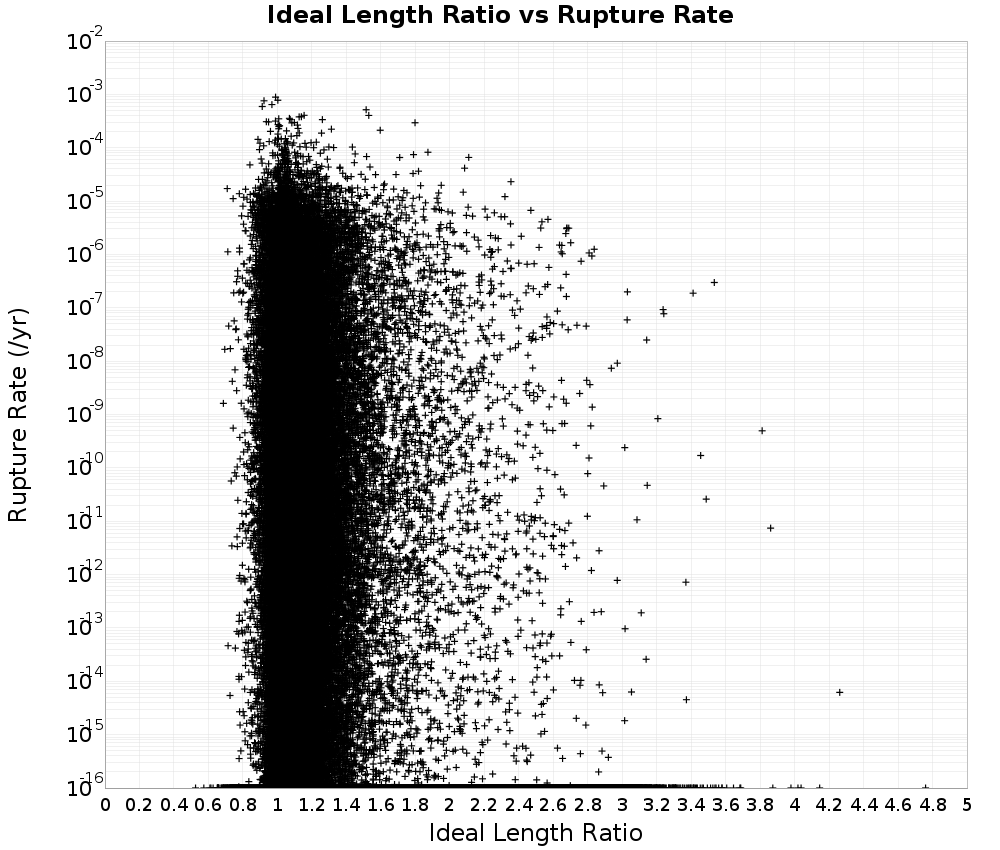
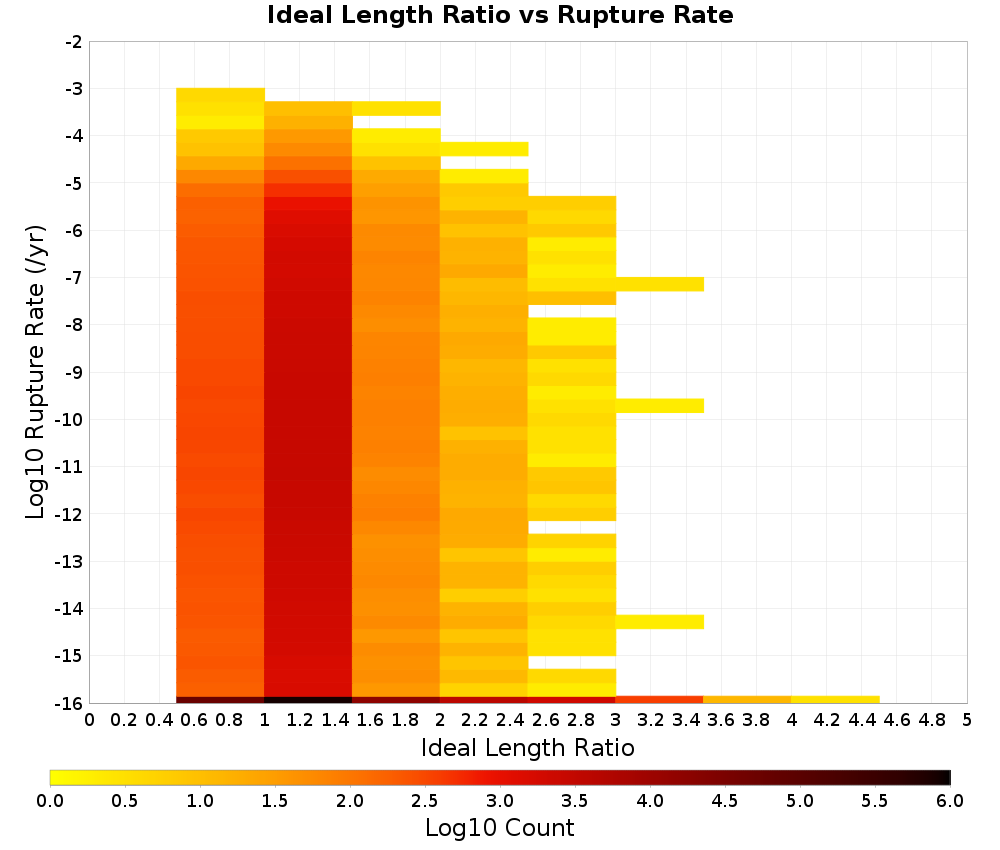
Ideal Length Ratio
(top)
The ratio between the total length of this rupture and the 'idealized length,' which we define as the straight line distance between the furthest two subsections.
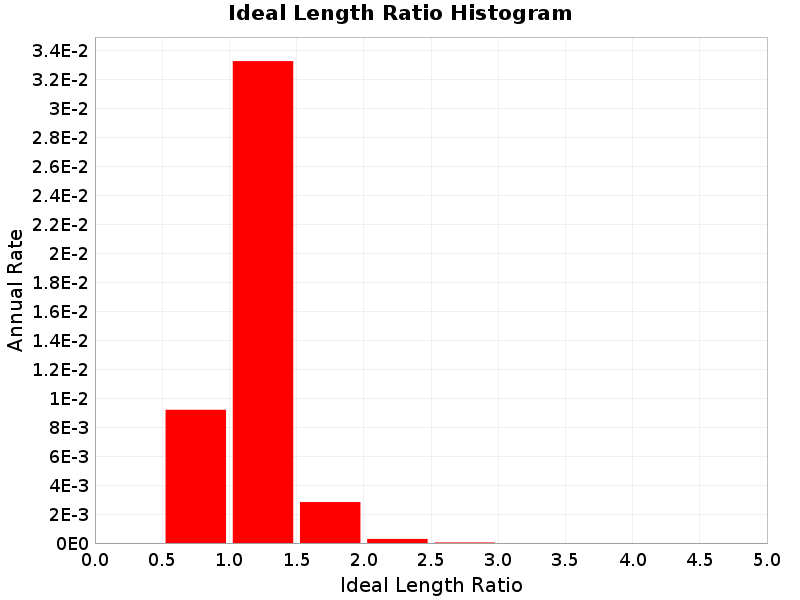
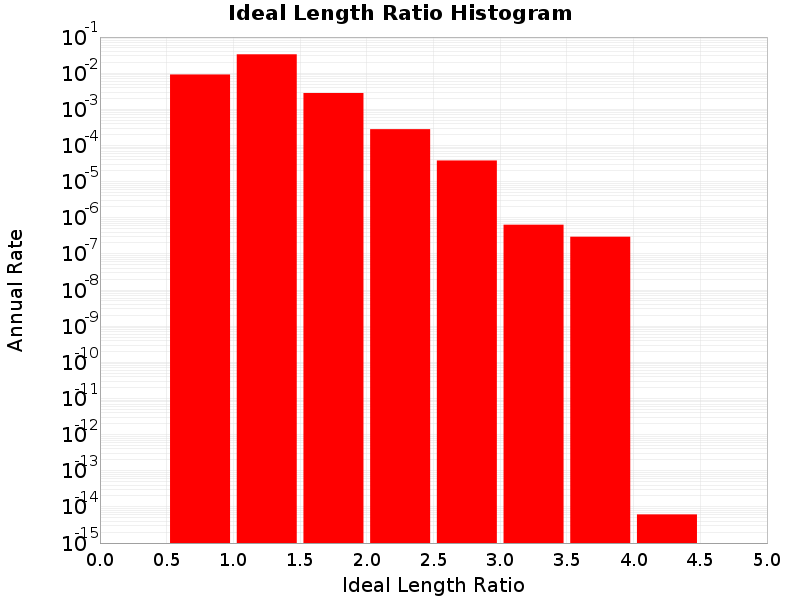
Ideal Length Ratio vs Rupture Rate
(top)
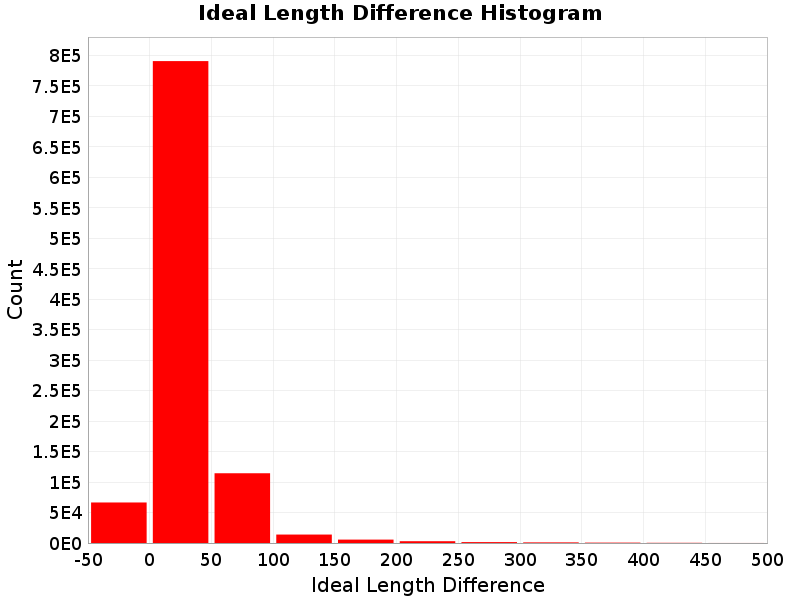
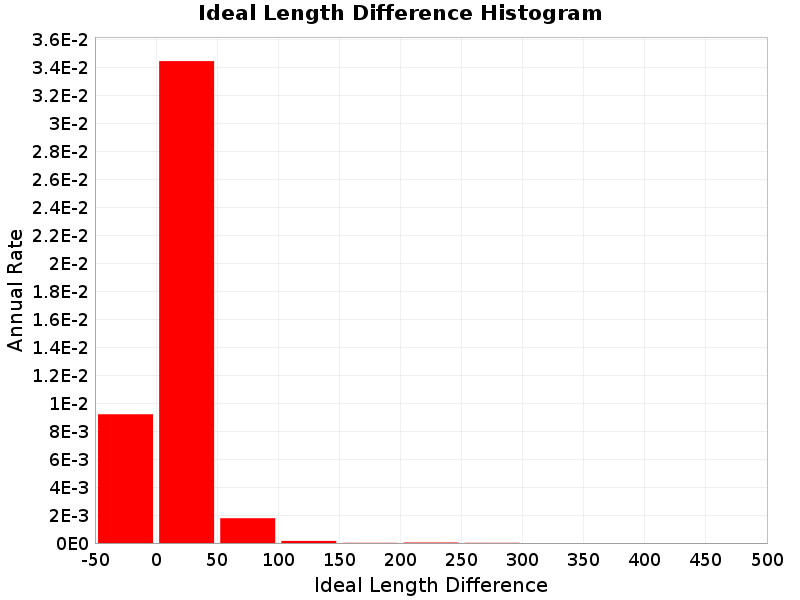
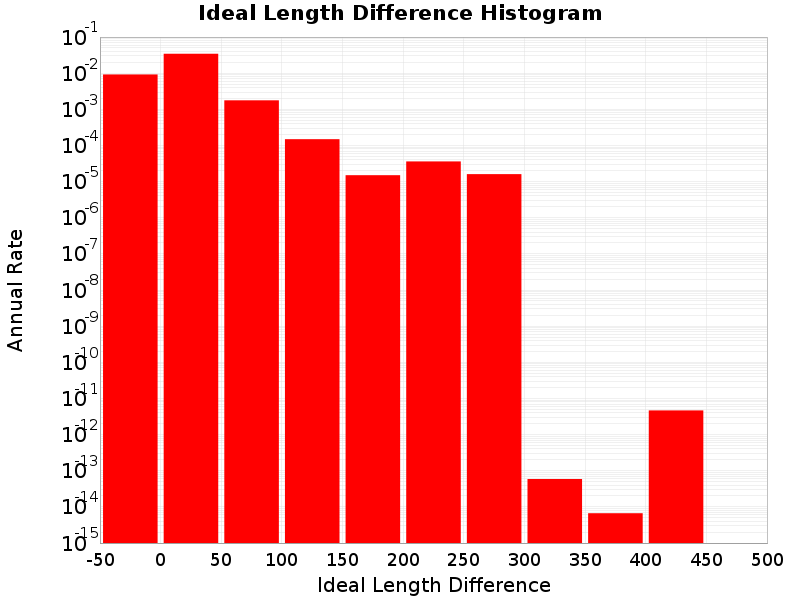
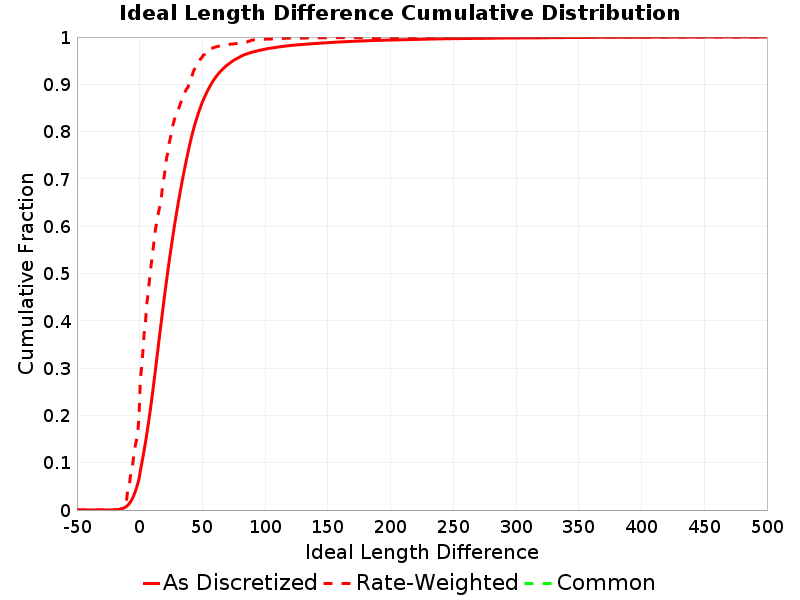
Ideal Length Difference
(top)
The difference between the total length of this rupture and the 'idealized length,' which we define as the straight line distance between the furthest two subsections.
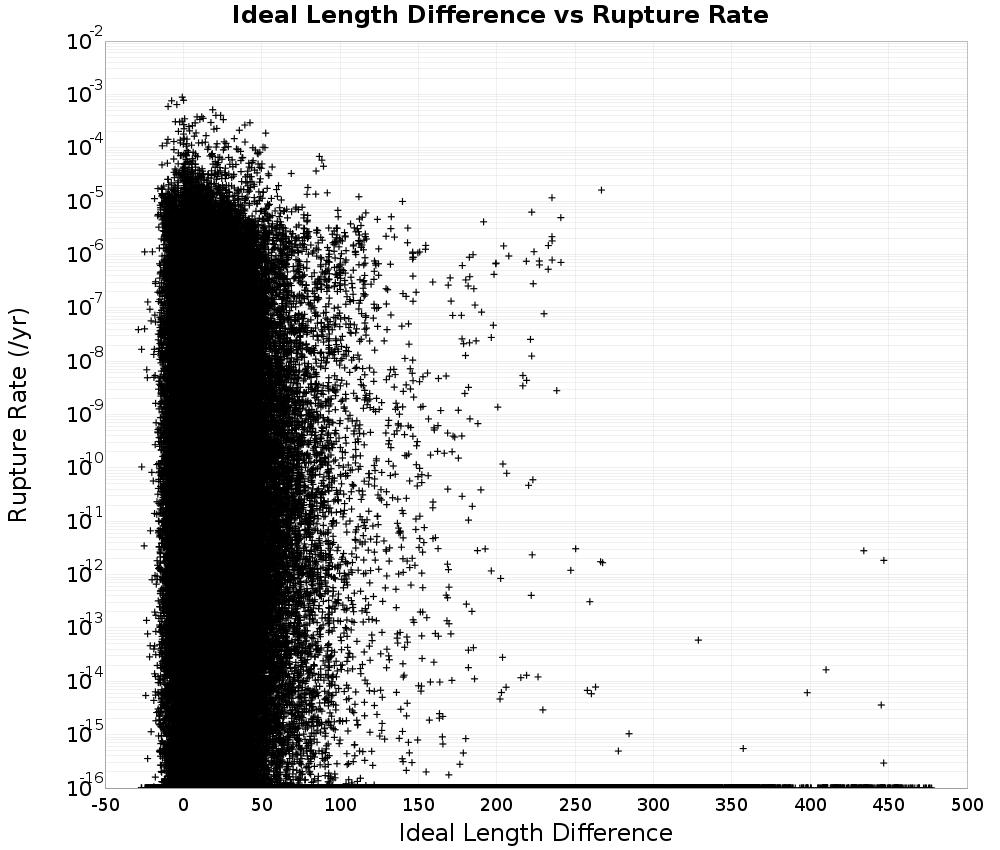
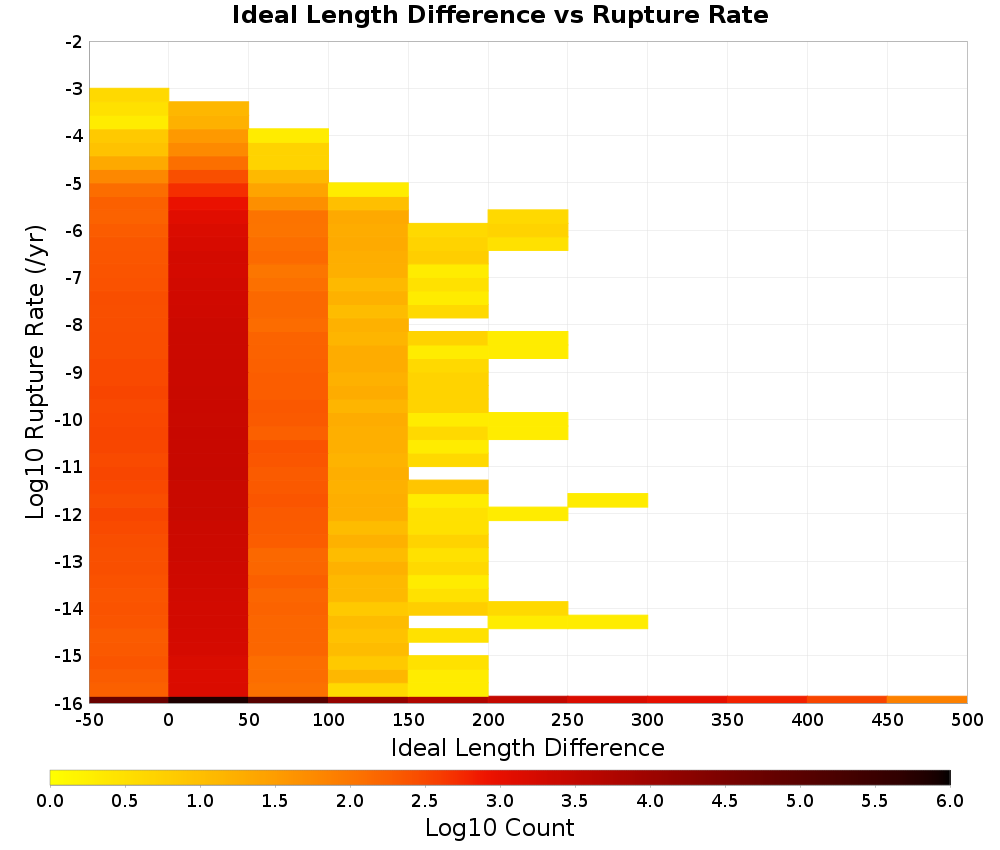
Ideal Length Difference vs Rupture Rate
(top)
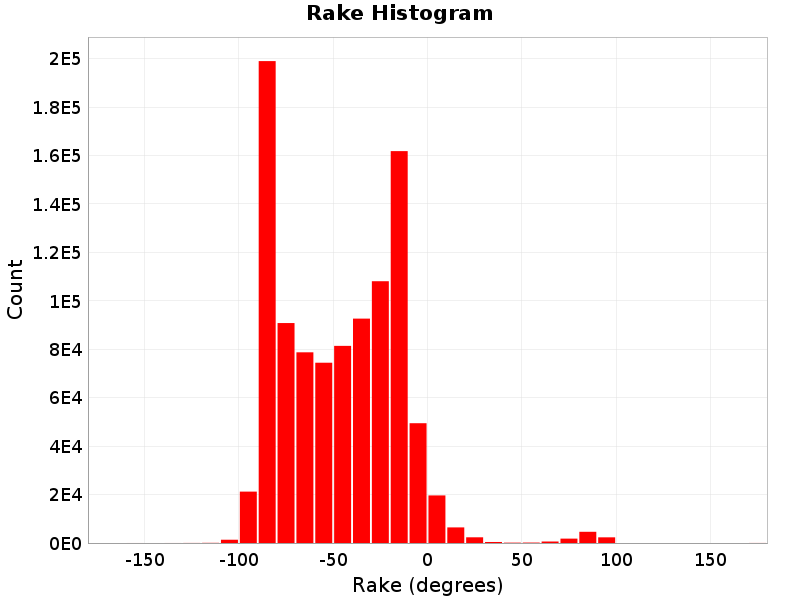
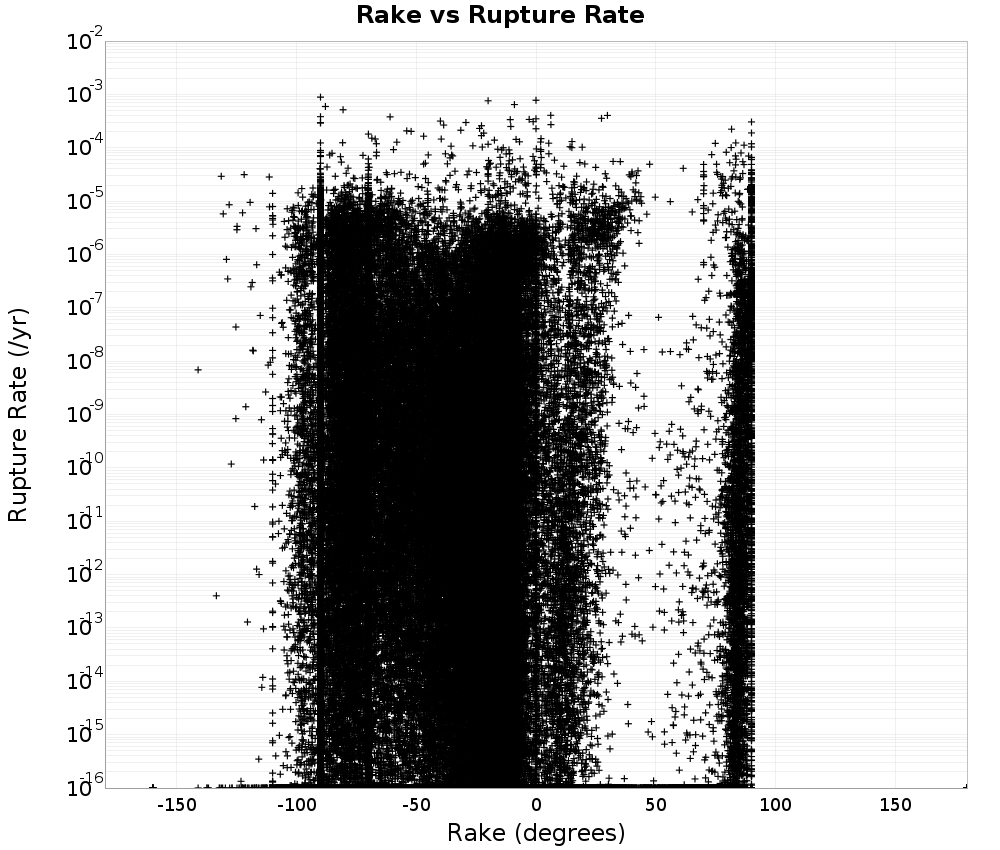
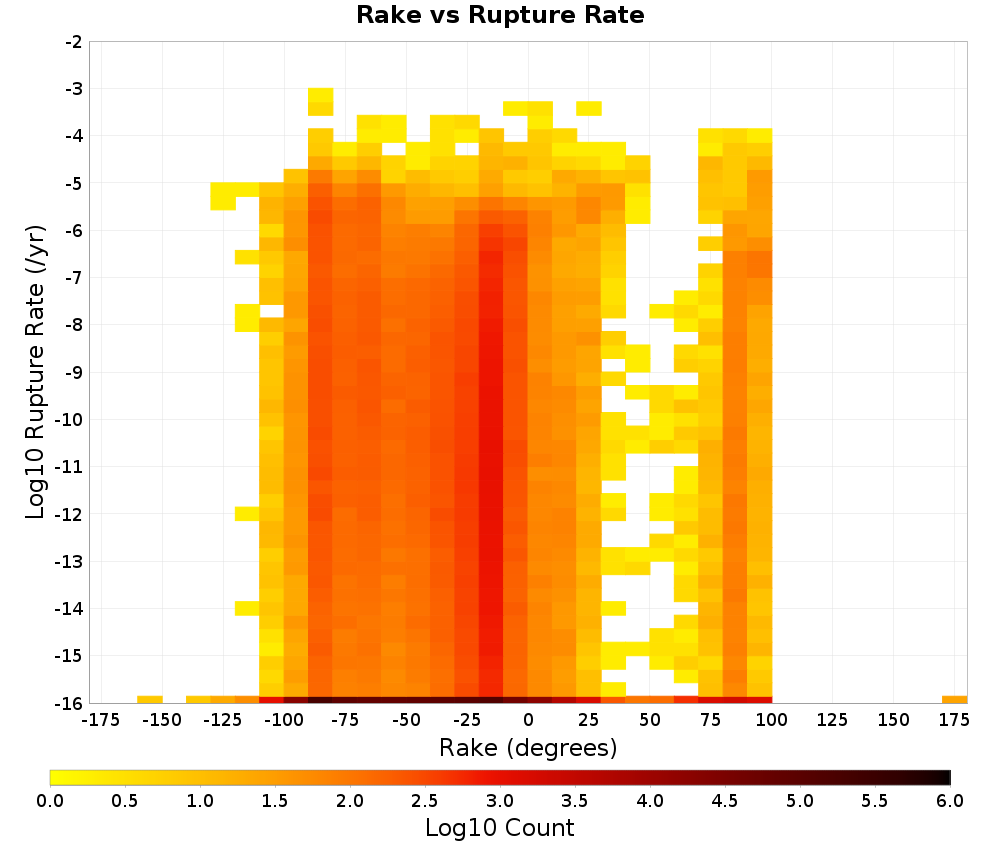
Rake
(top)
The area-averaged rake for this rupture.
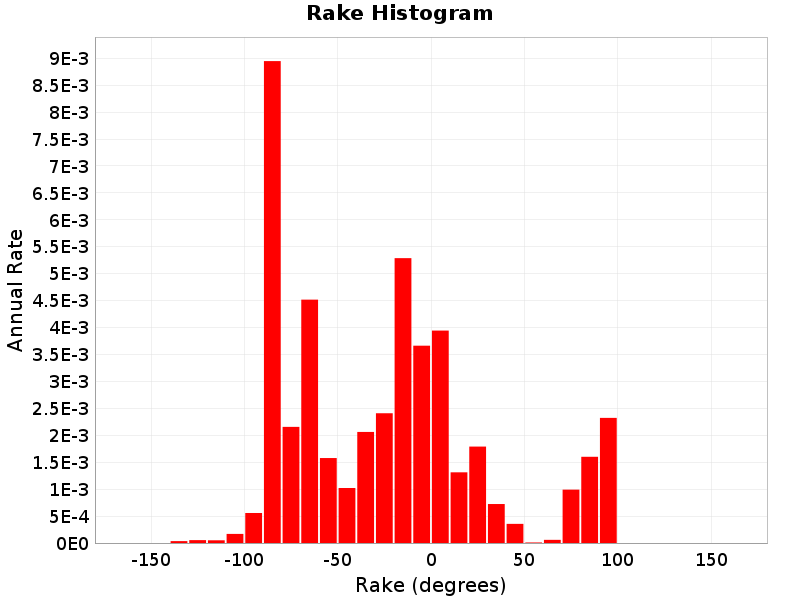
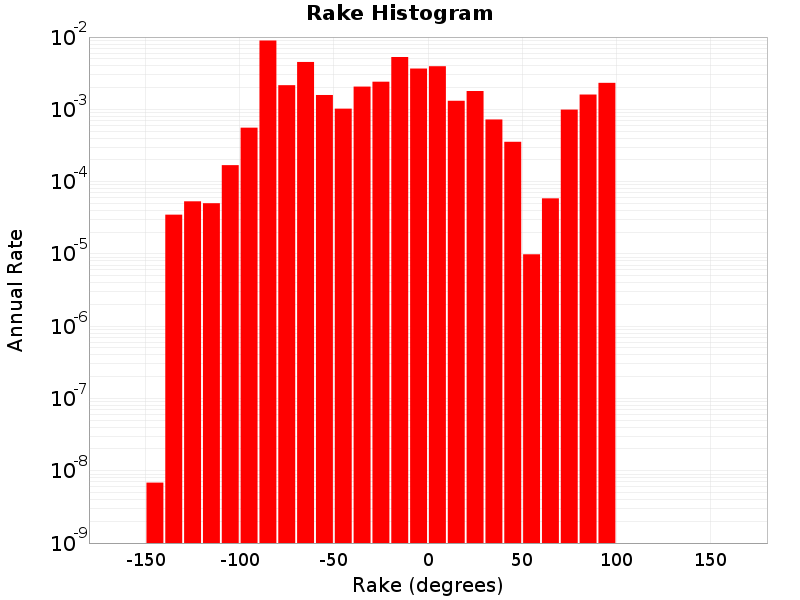
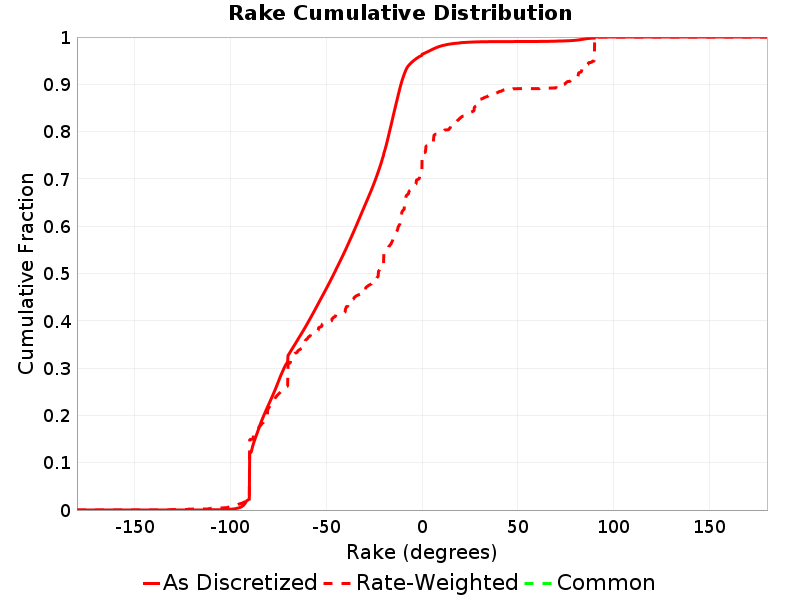
Rake vs Rupture Rate
(top)
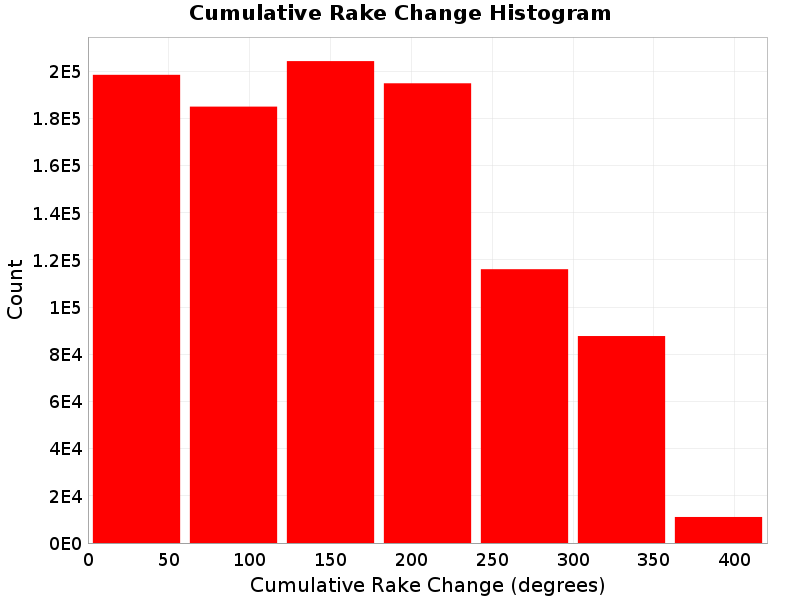
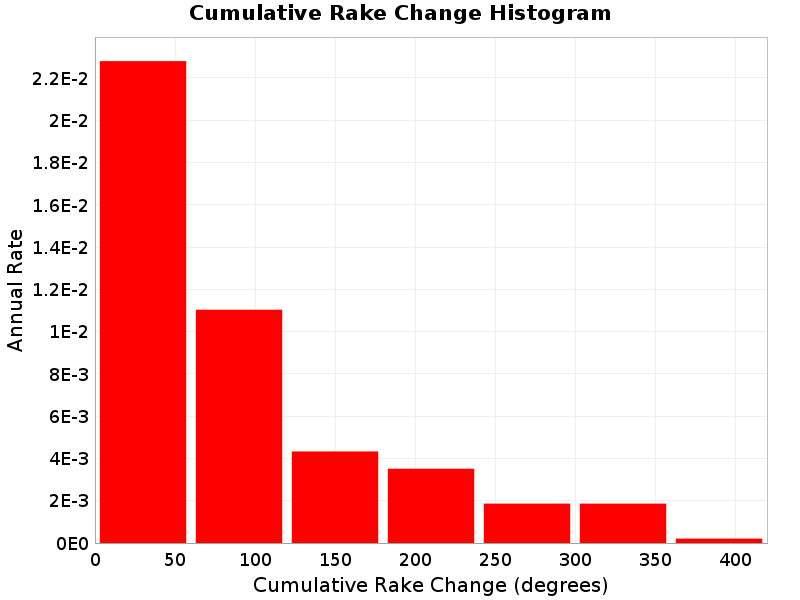
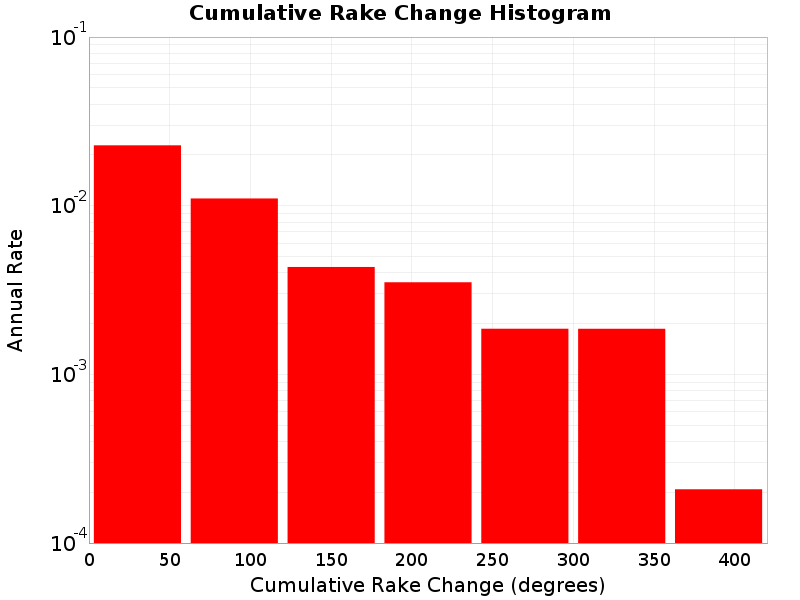
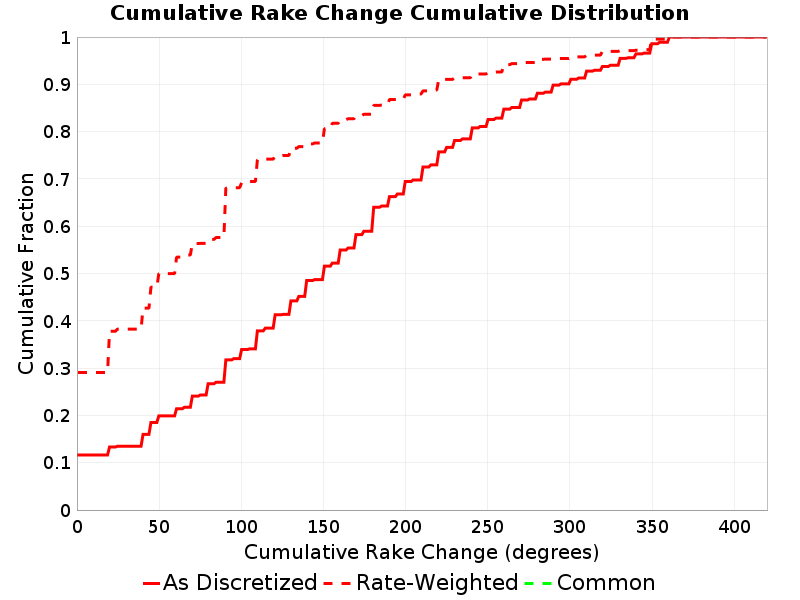
Cumulative Rake Change
(top)
Cumulative rake change for this rupture.
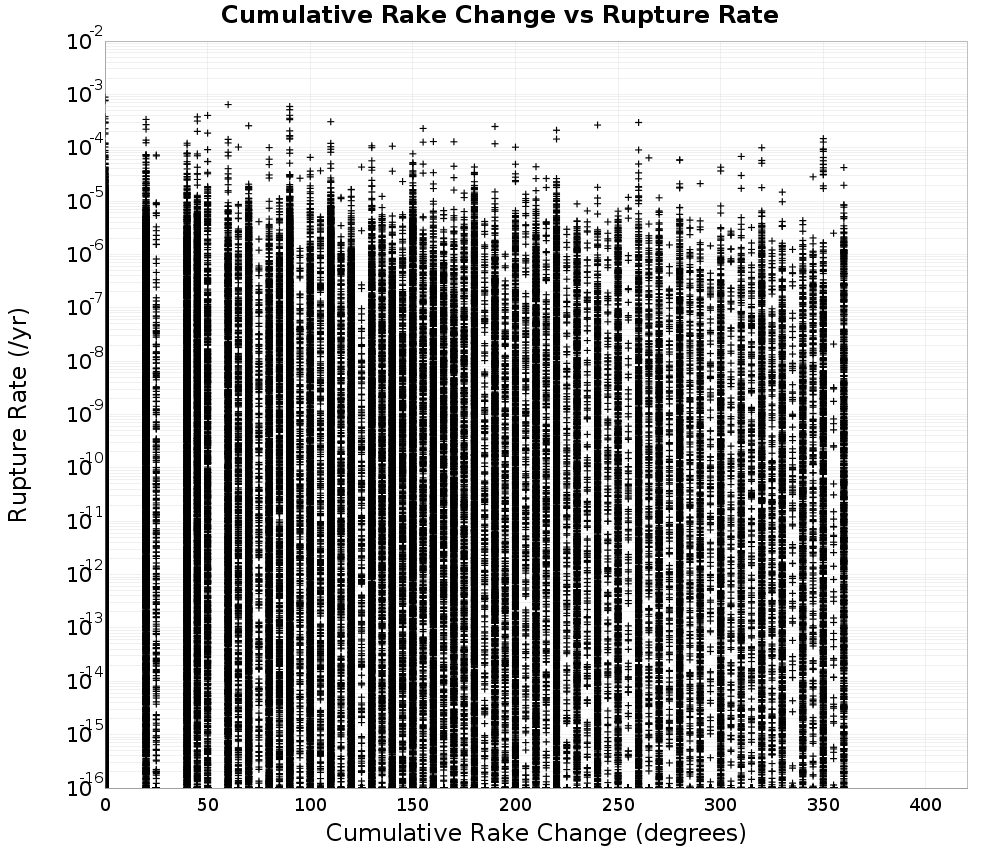
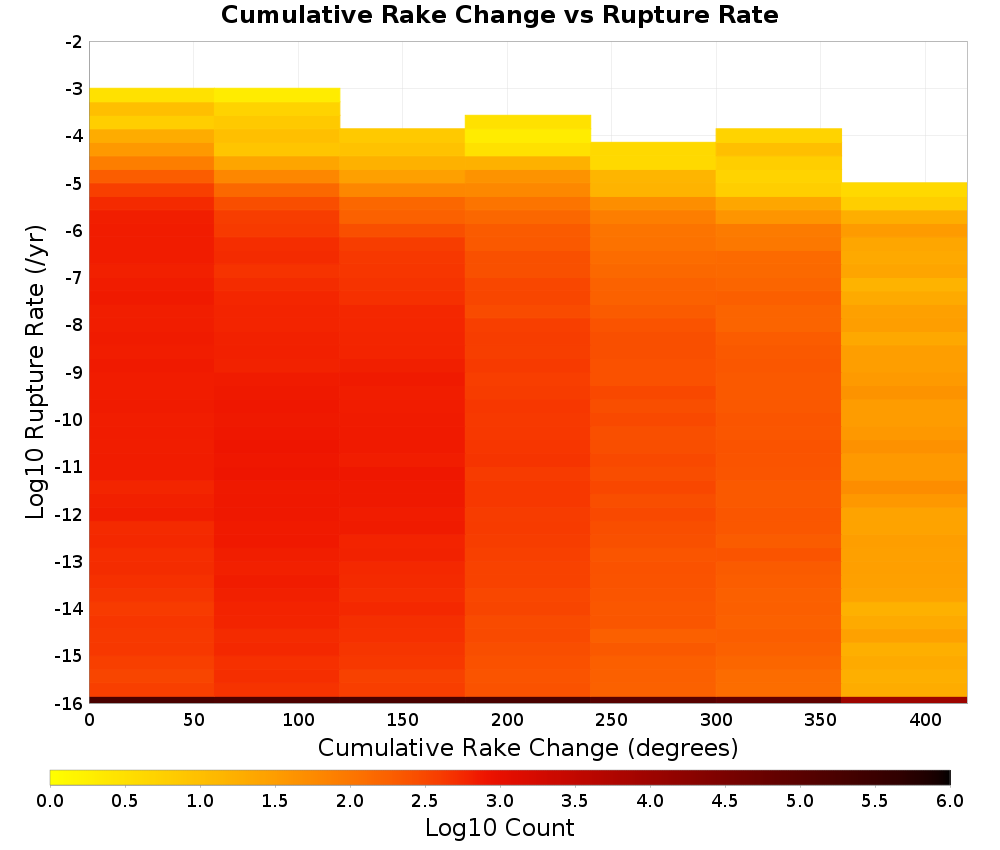
Cumulative Rake Change vs Rupture Rate
(top)
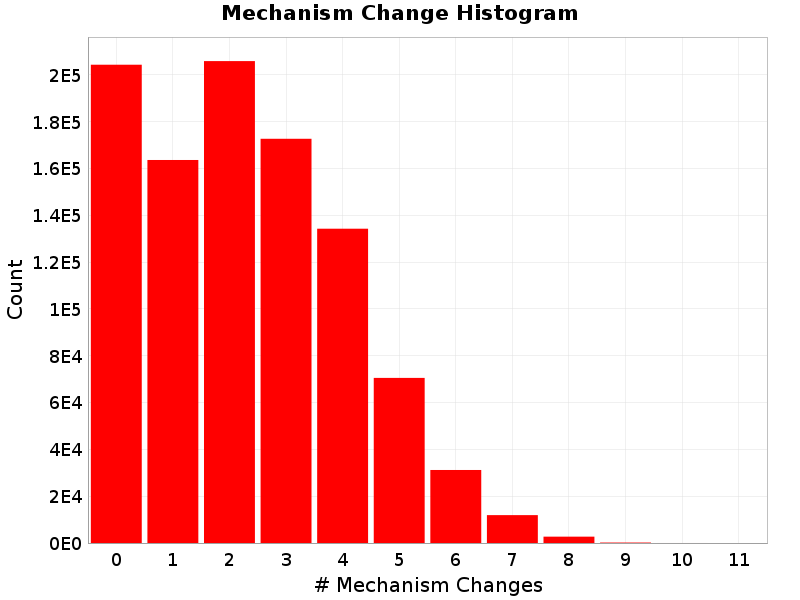
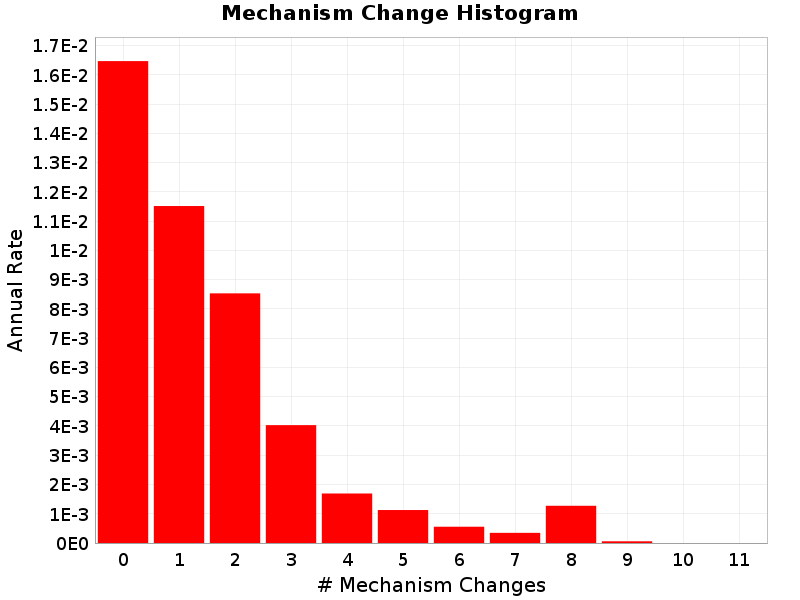
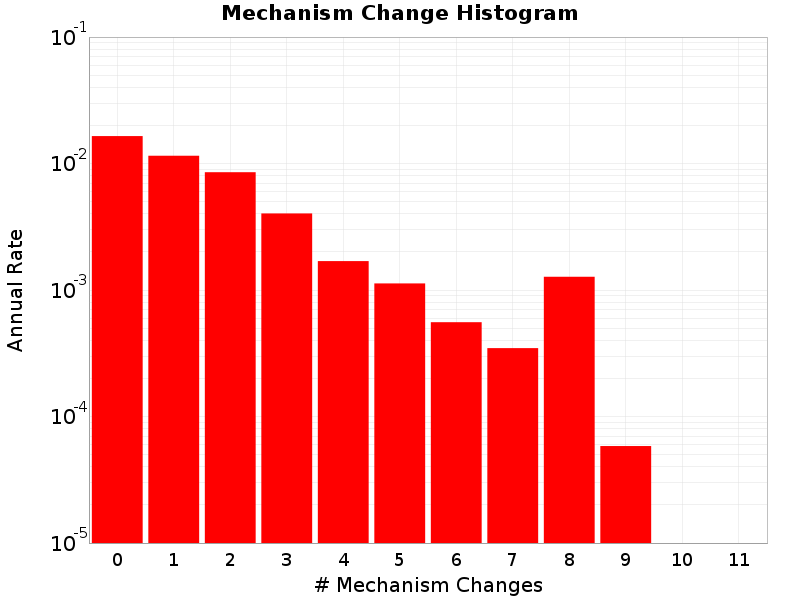
Mechanism Change
(top)
The number of times a rupture changed mechanisms, e.g., from right-lateral SS to left-lateral or SS to reverse.
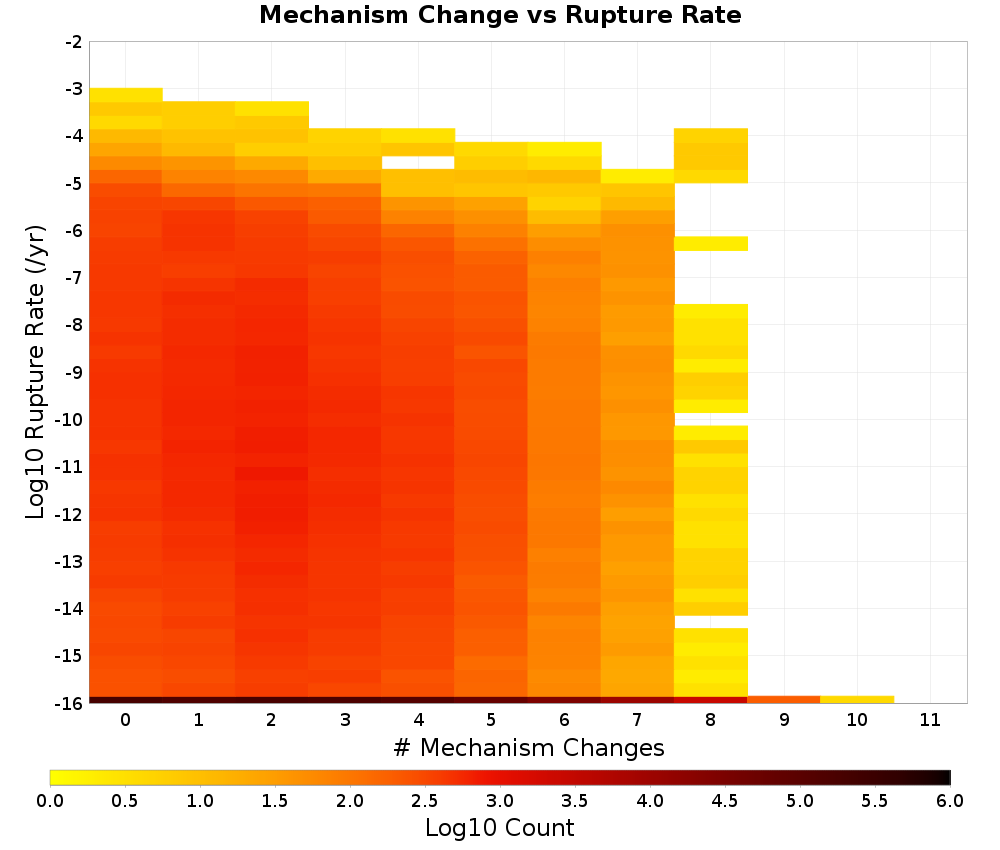
Mechanism Change vs Rupture Rate
(top)
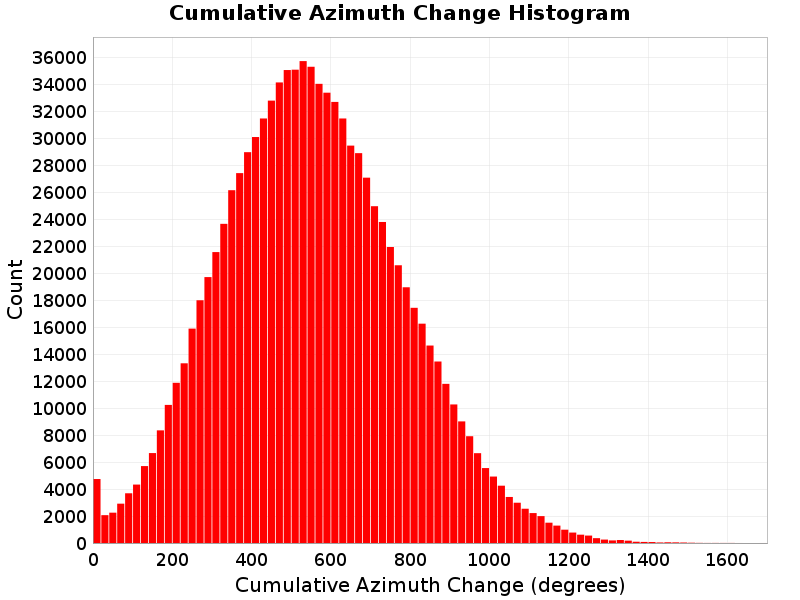
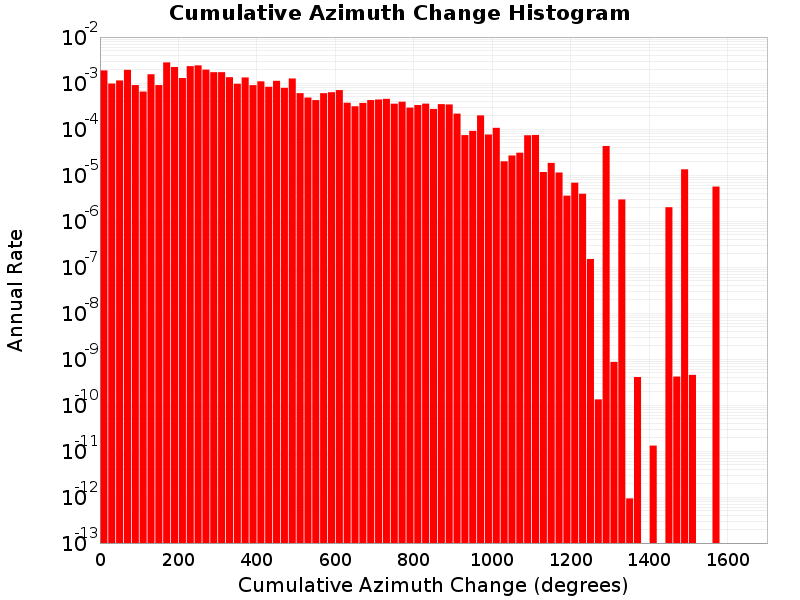
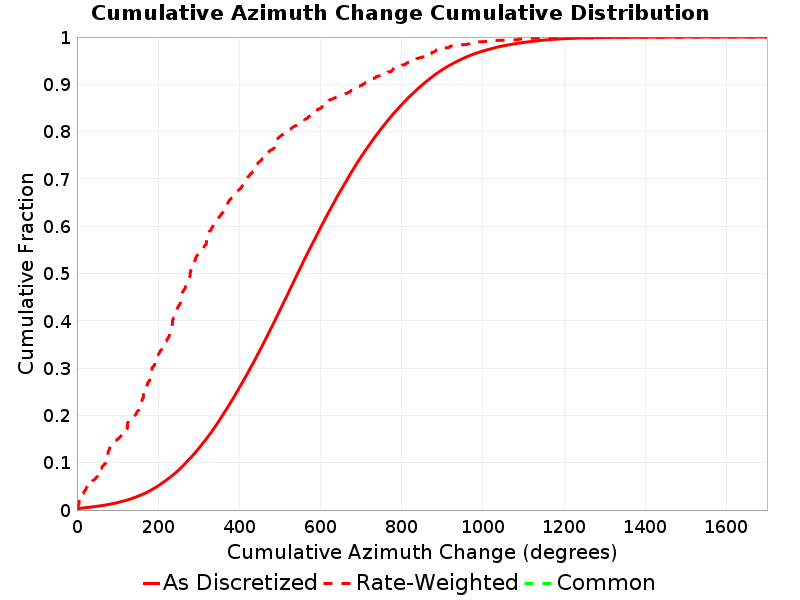
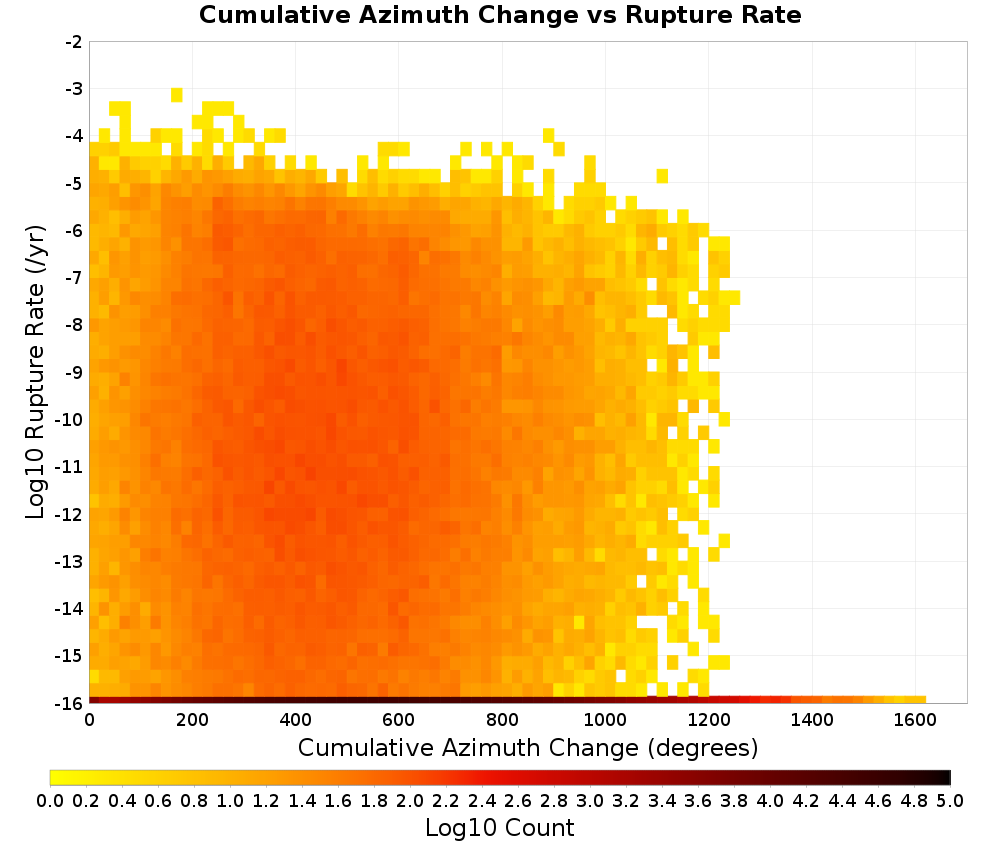
Cumulative Azimuth Change
(top)
Cumulative azimuth change for this rupture.
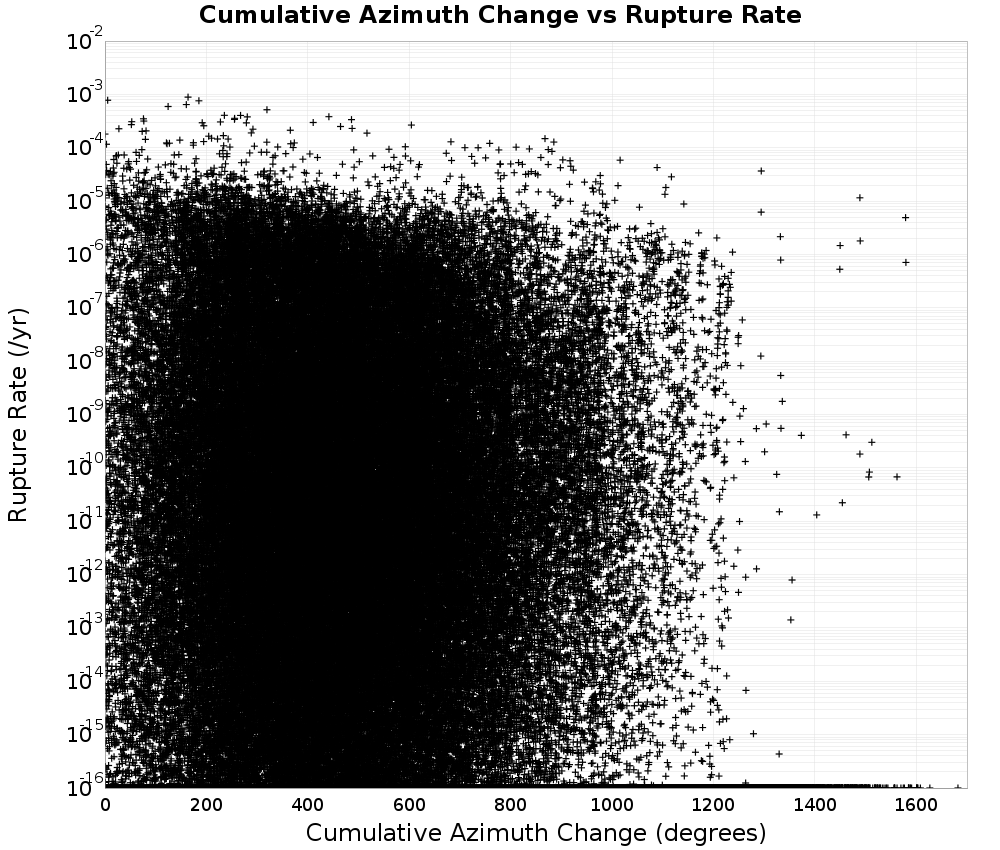
Cumulative Azimuth Change vs Rupture Rate
(top)
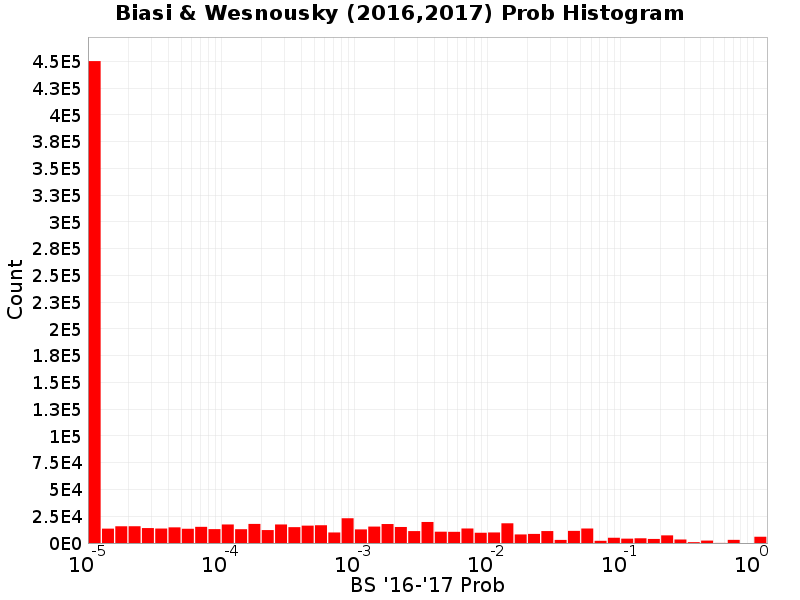
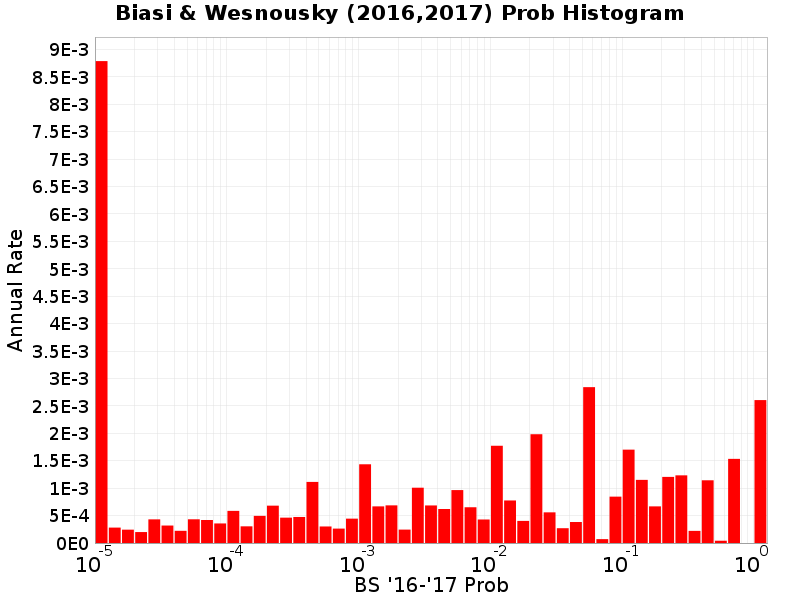
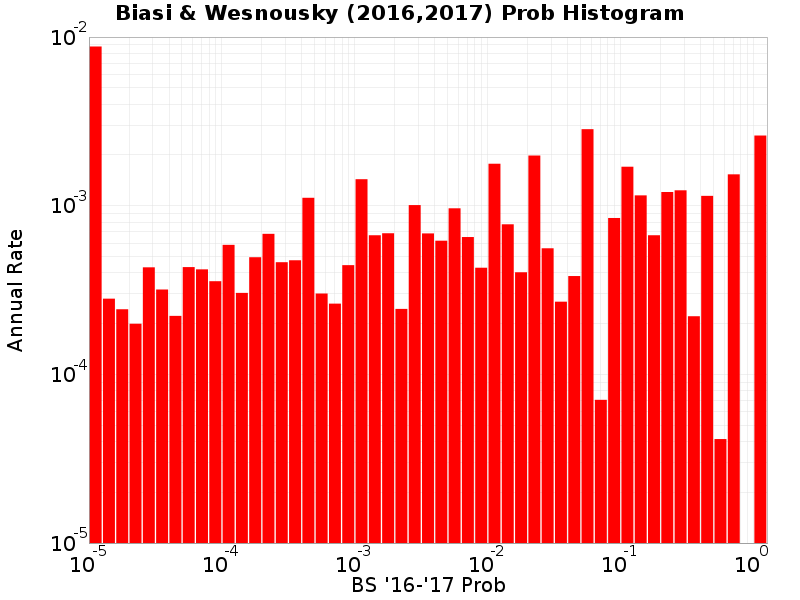
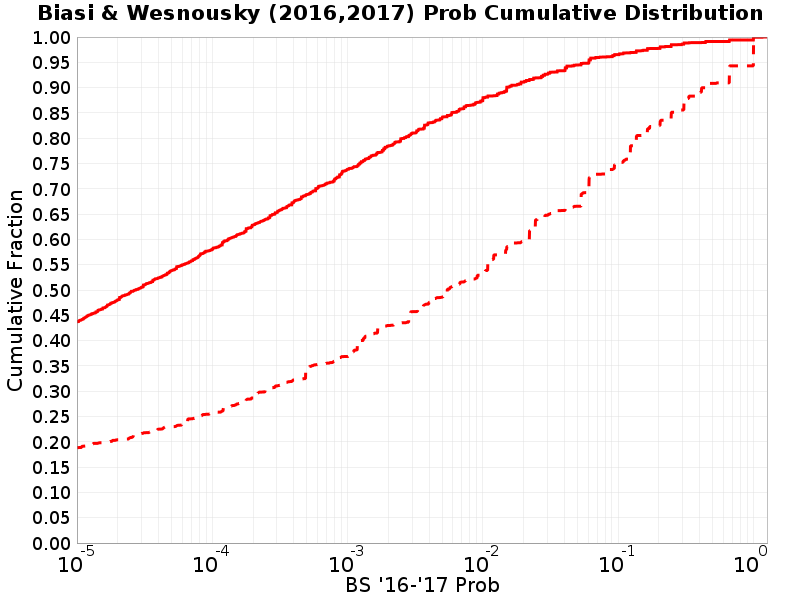
Biasi & Wesnousky (2016,2017) Prob
(top)
Biasi & Wesnousky (2016,2017) conditional probability of passing through each jump.
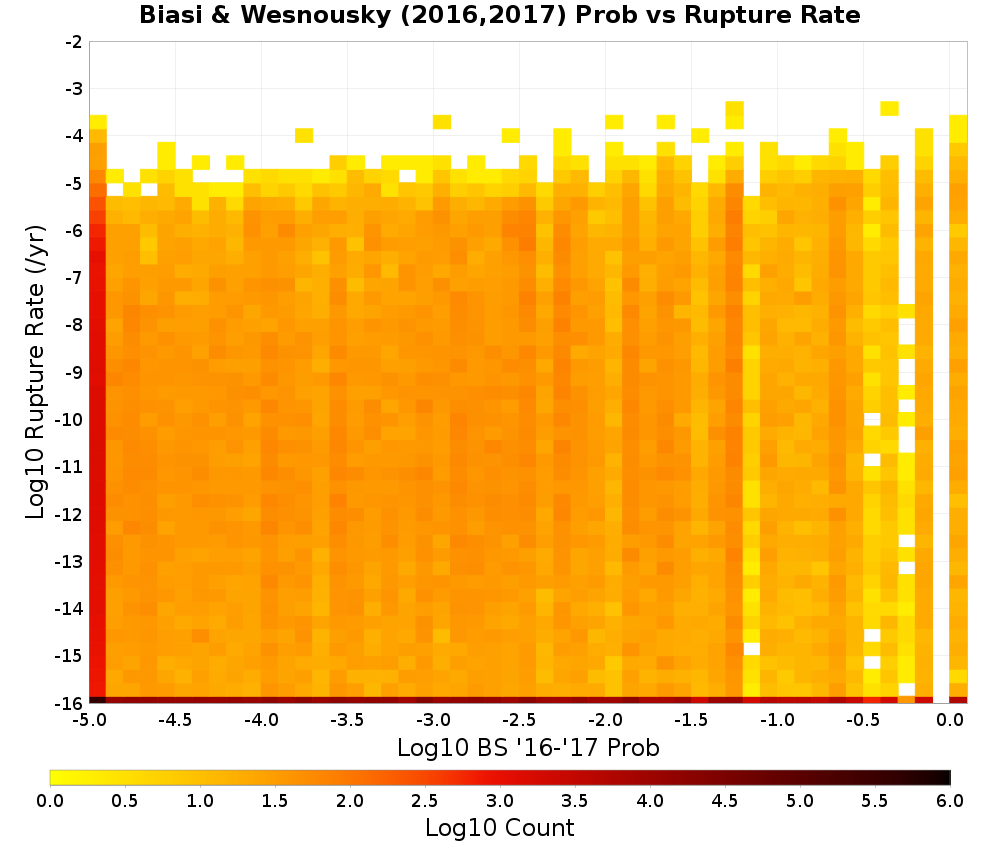
Biasi & Wesnousky (2016,2017) Prob vs Rupture Rate
(top)
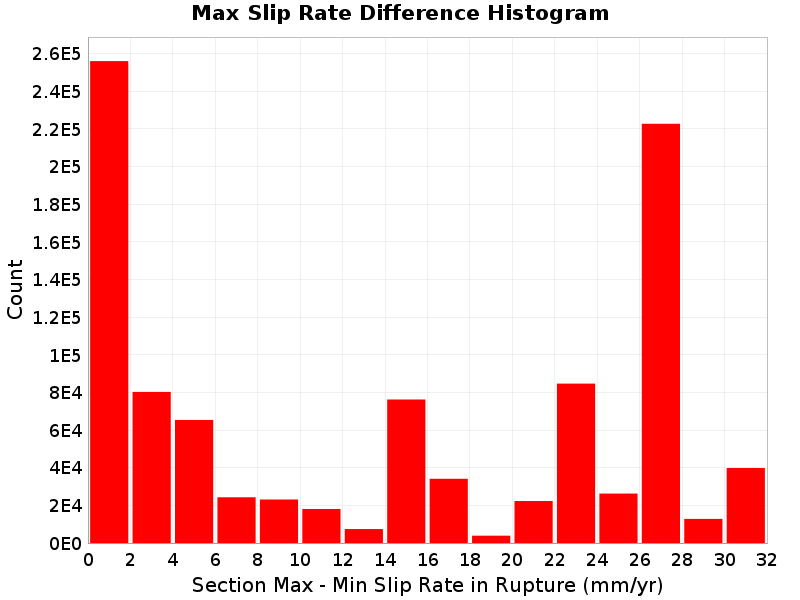
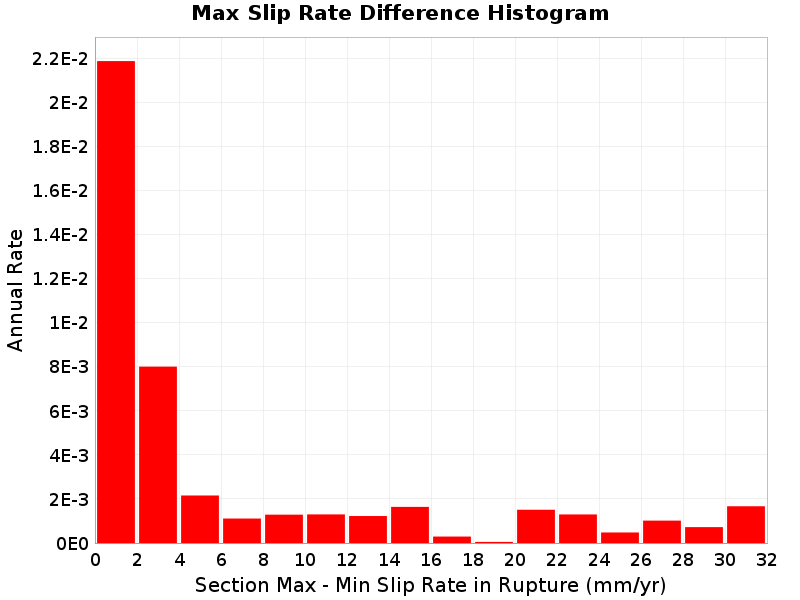
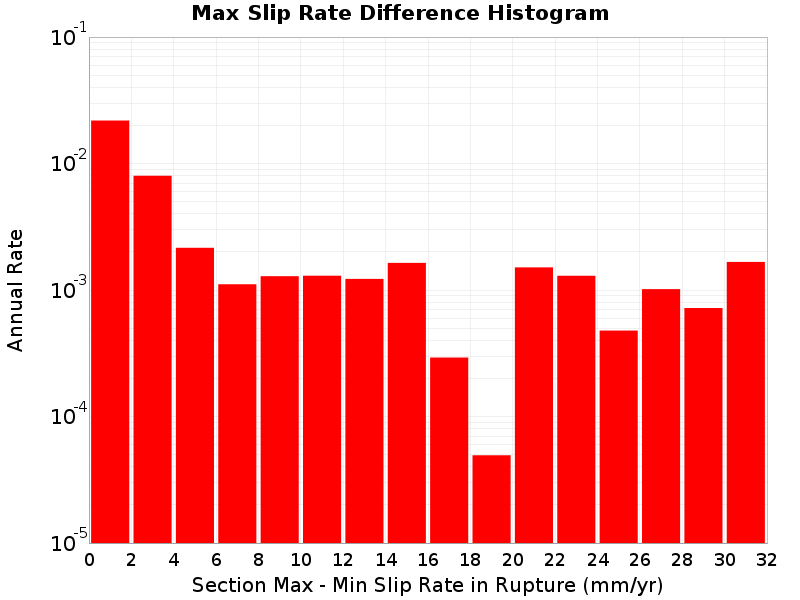
Max Slip Rate Difference
(top)
The difference between the slip rate with the highest and lowest slip rate in the rupture.
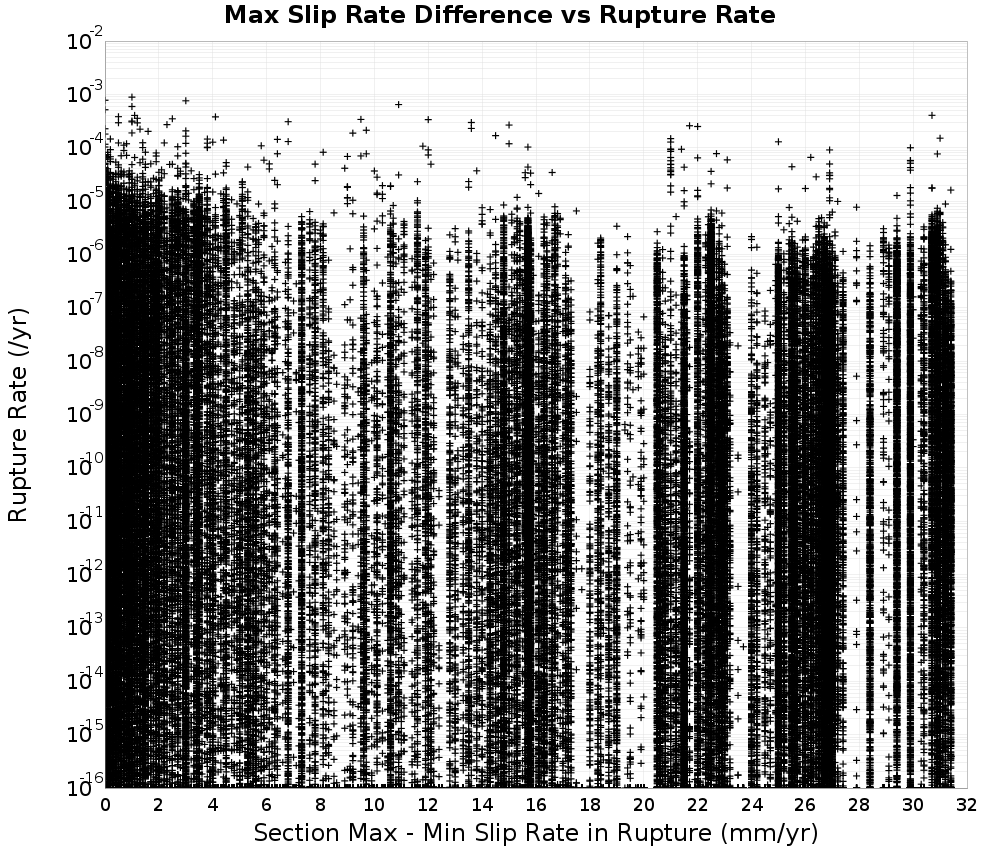
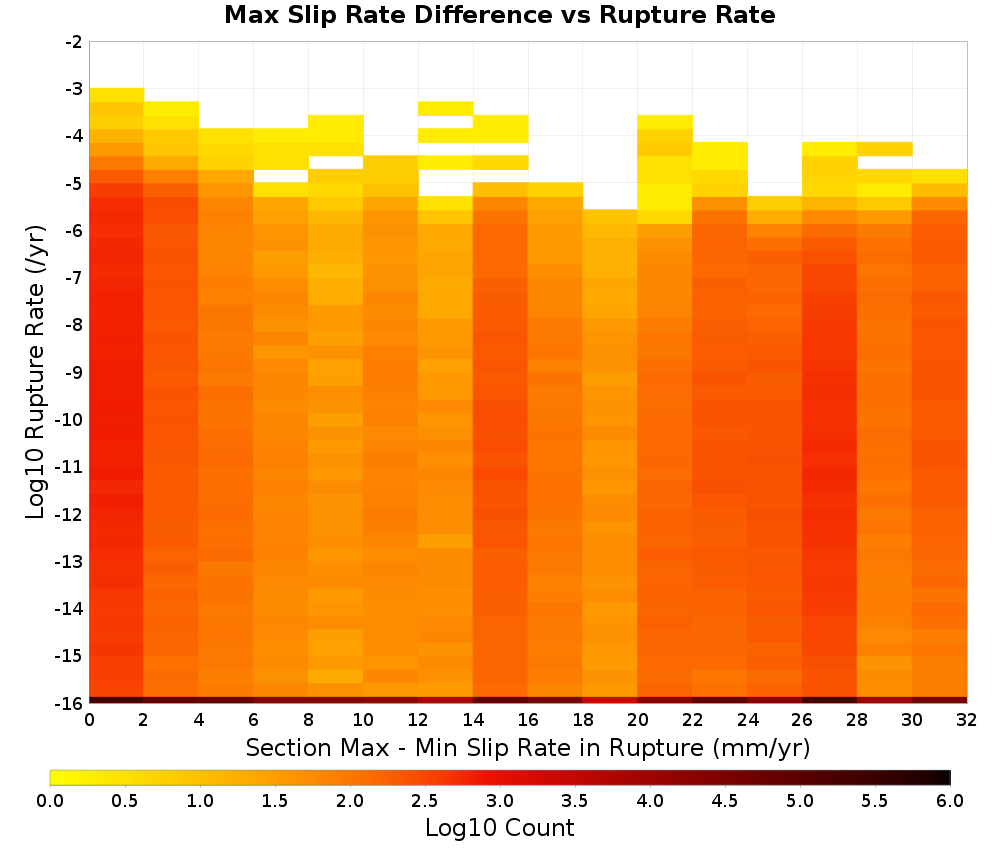
Max Slip Rate Difference vs Rupture Rate
(top)
Fault Section Connections
(top)
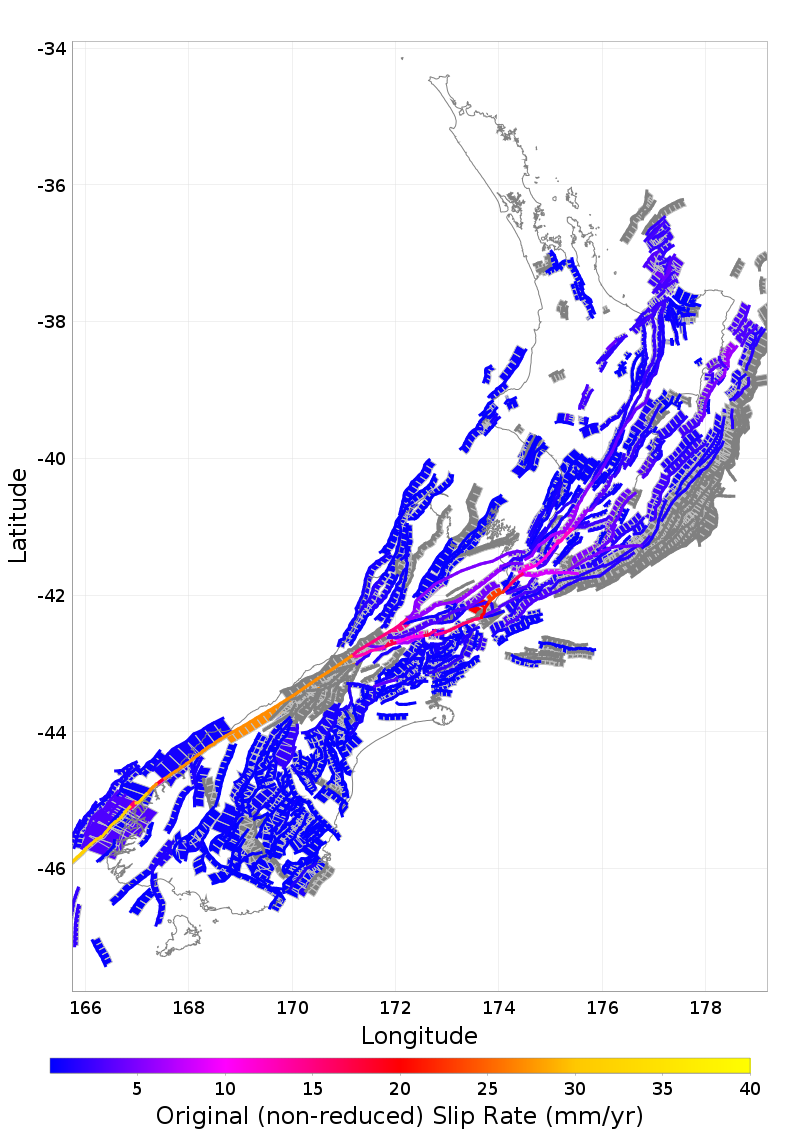
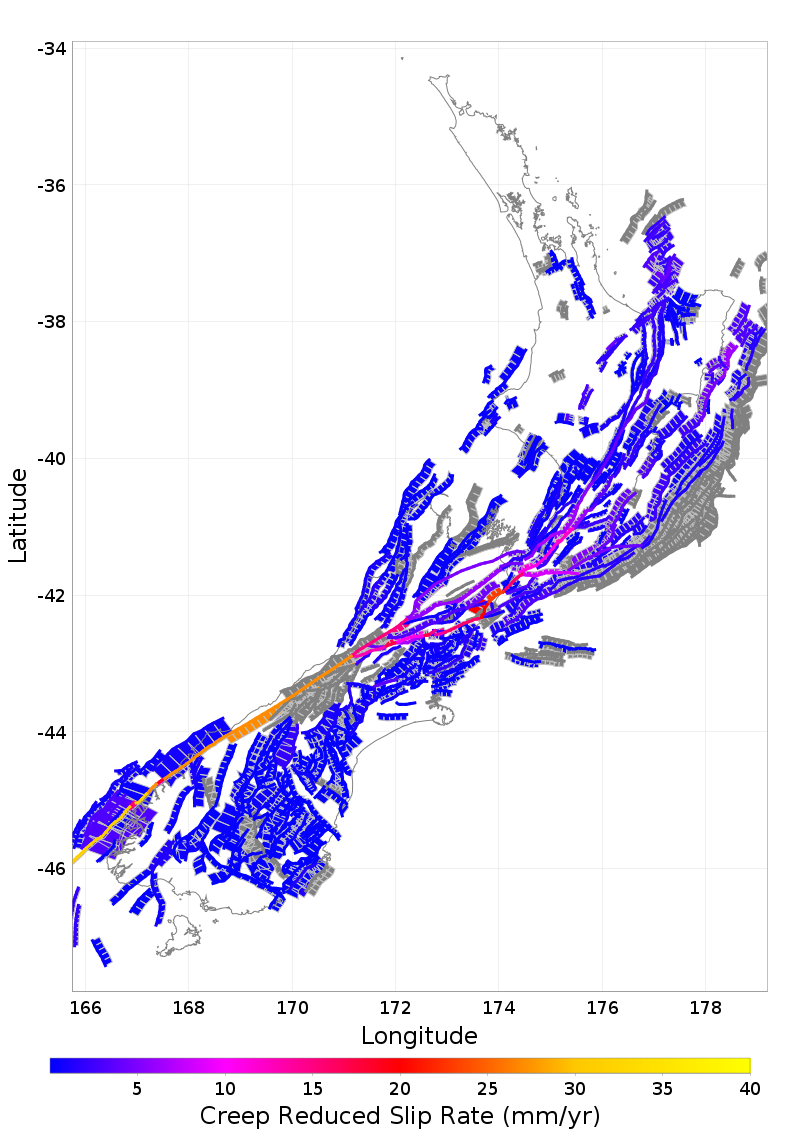
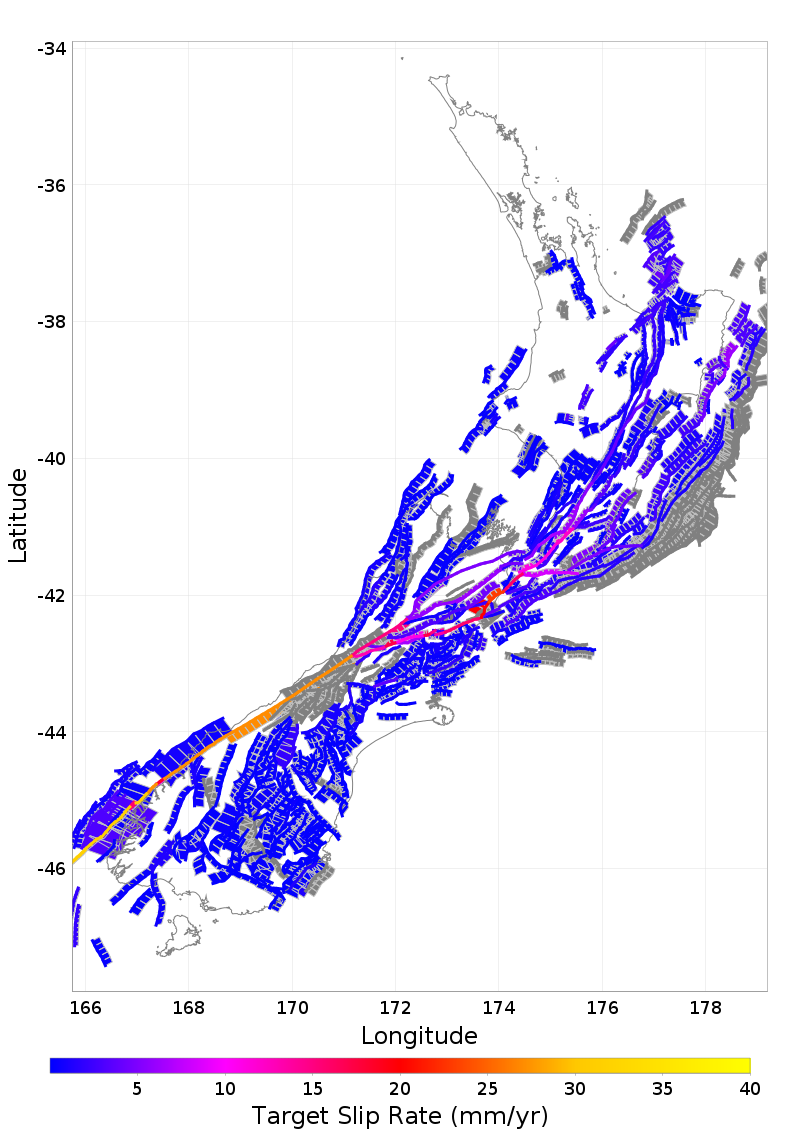
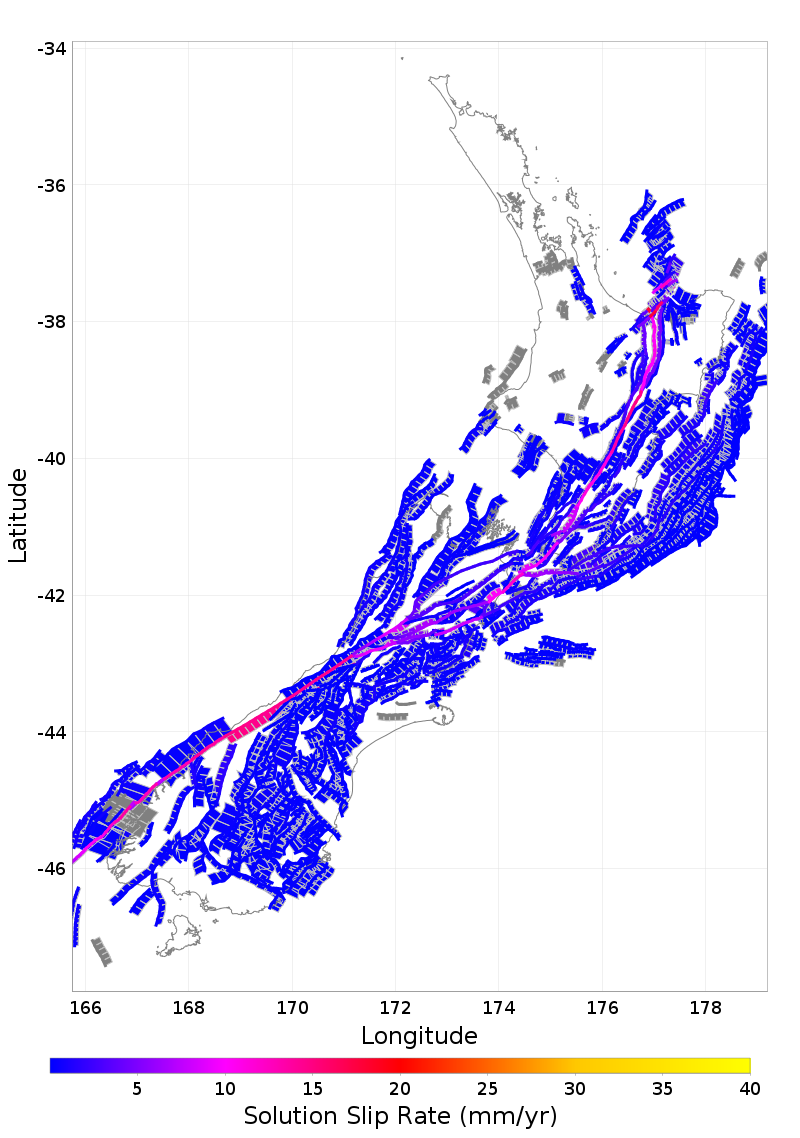
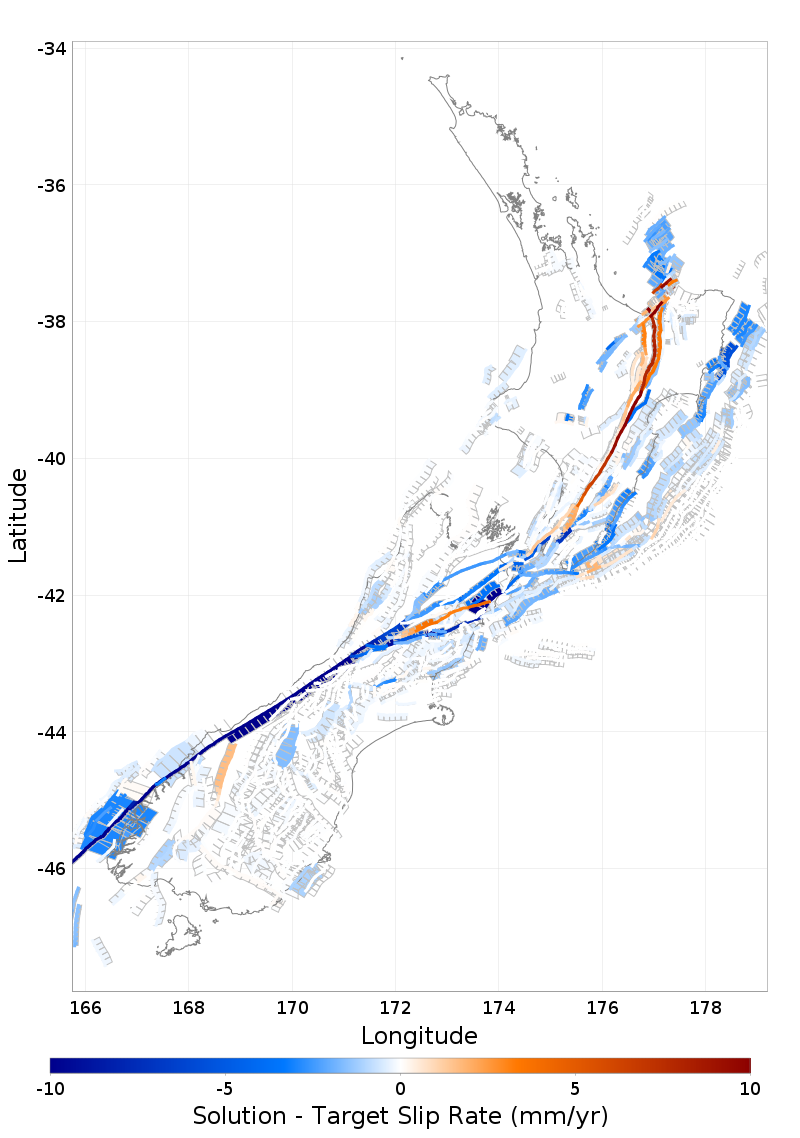
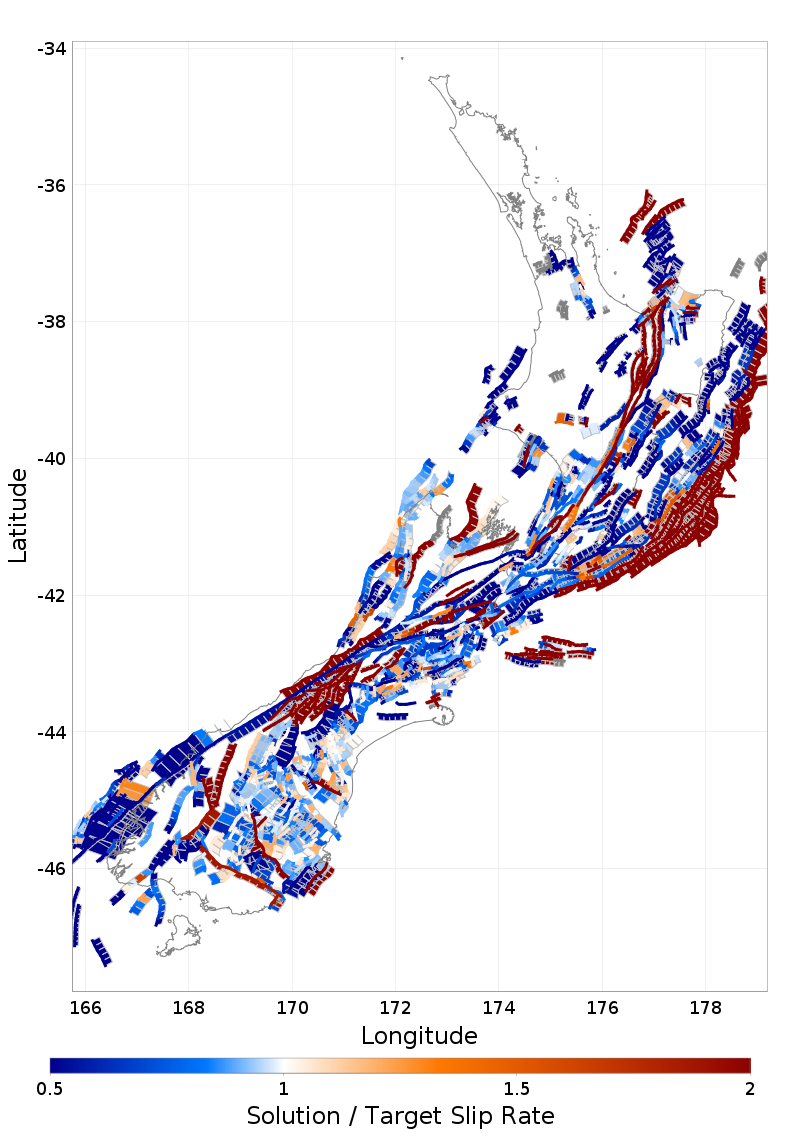
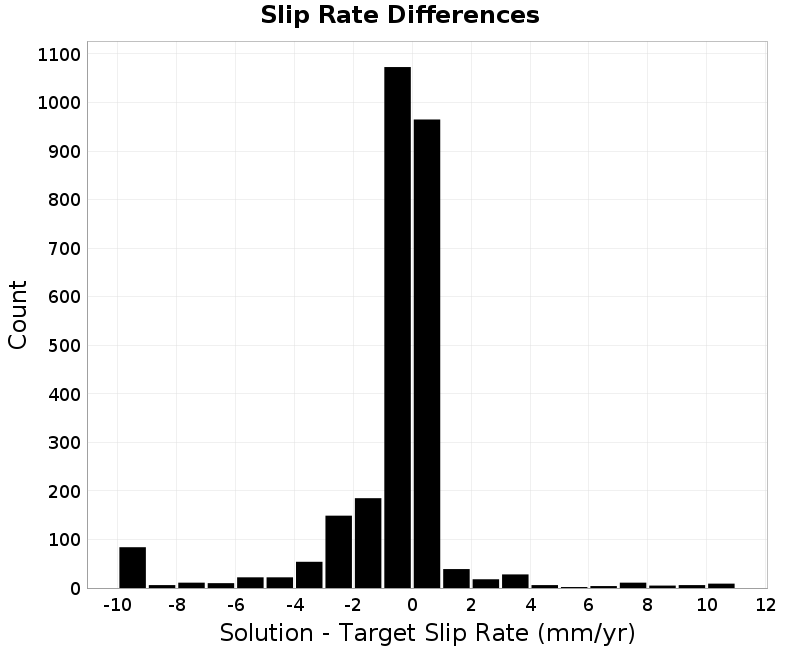
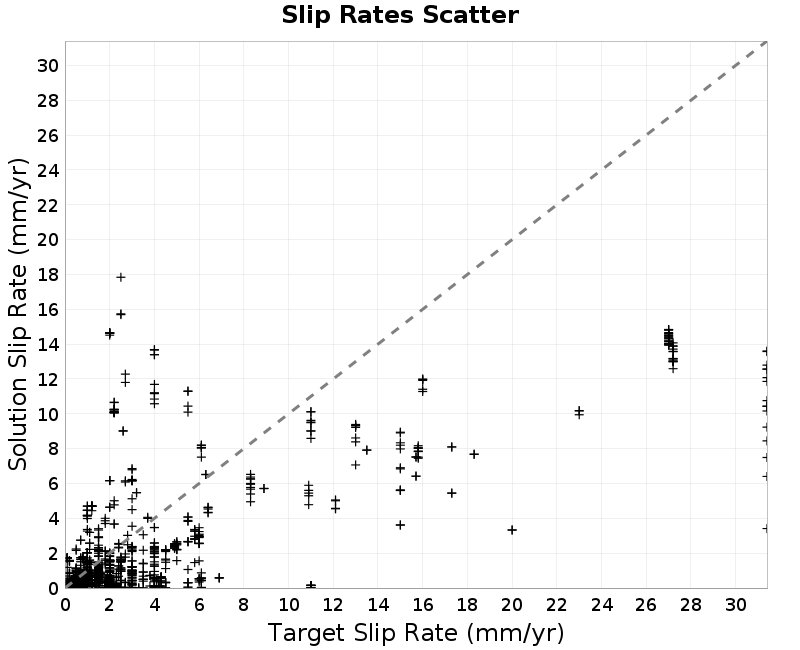
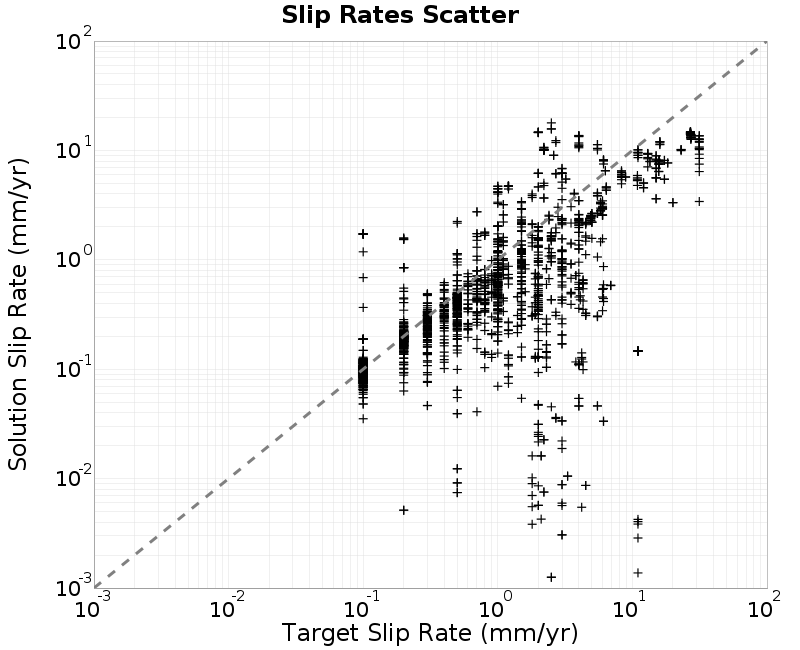
Slip Rates
(top)
Linear Slip Rate Plots
(top)
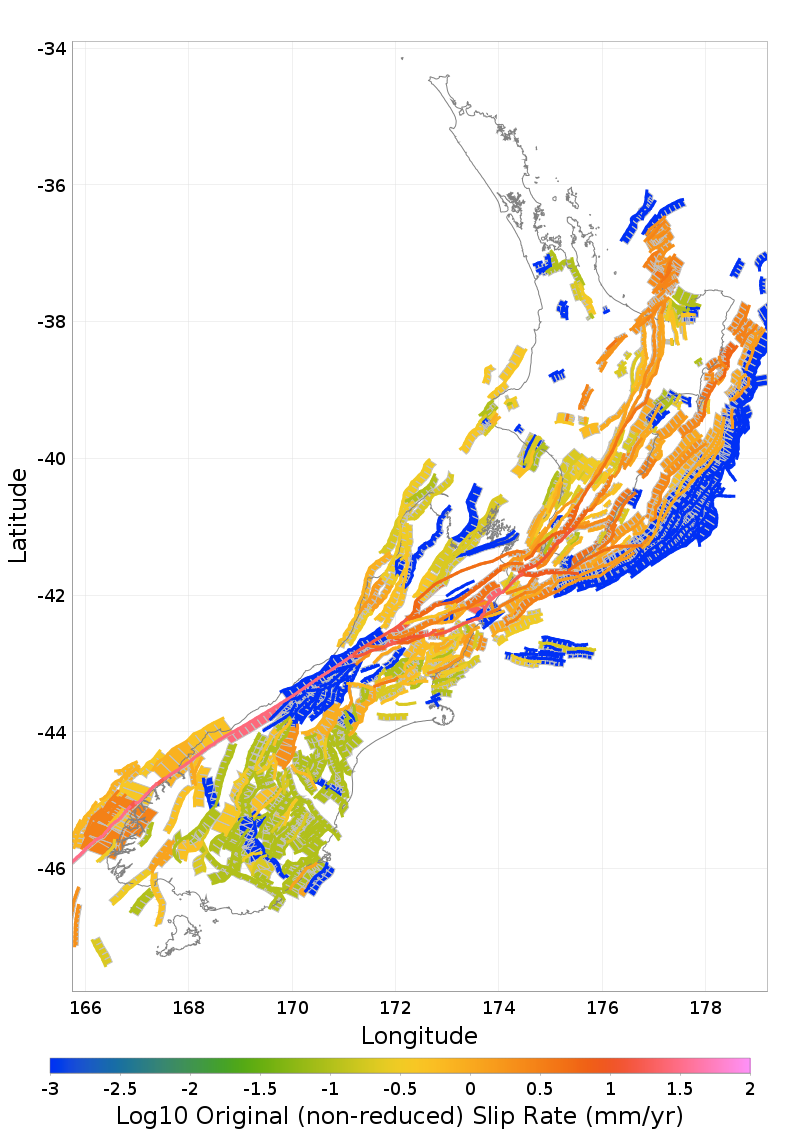
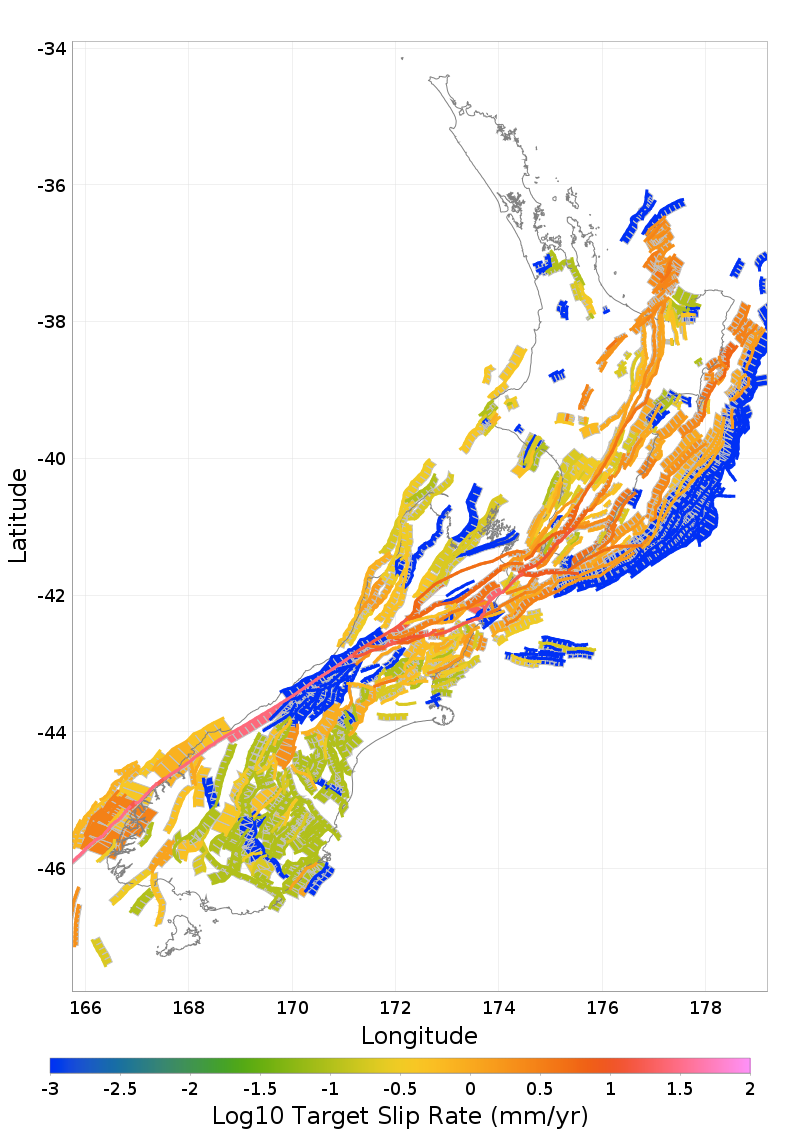
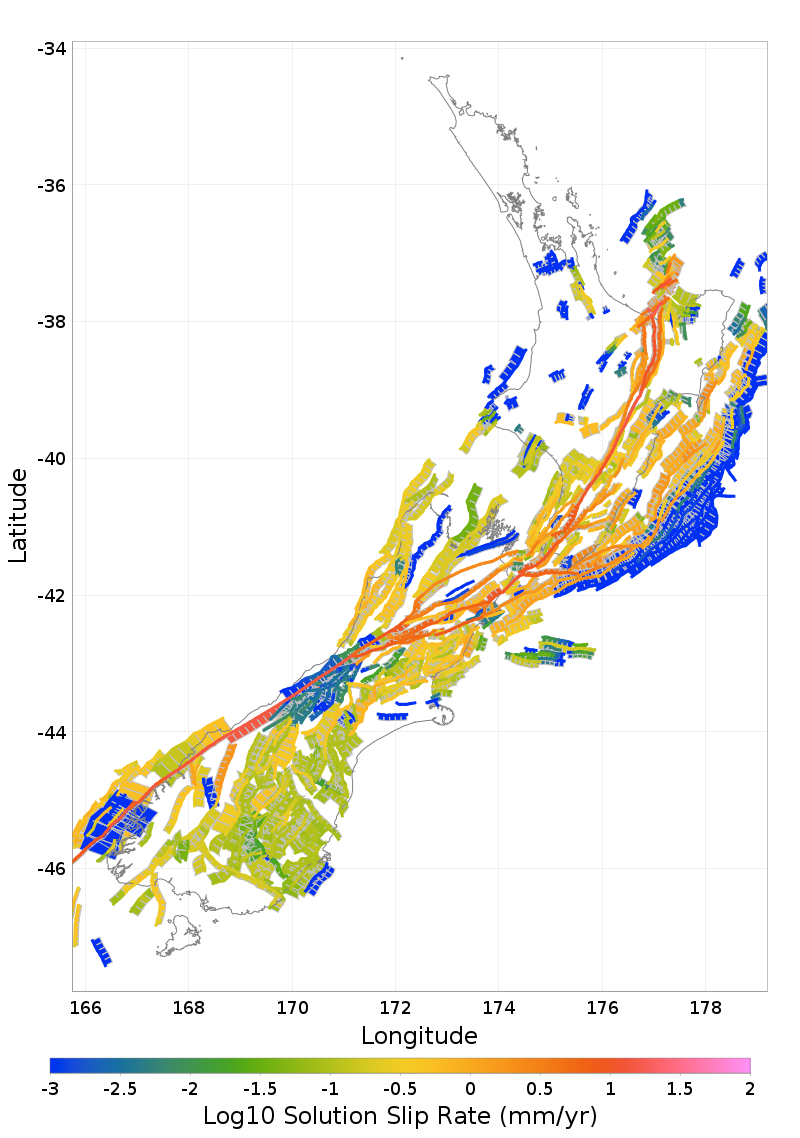
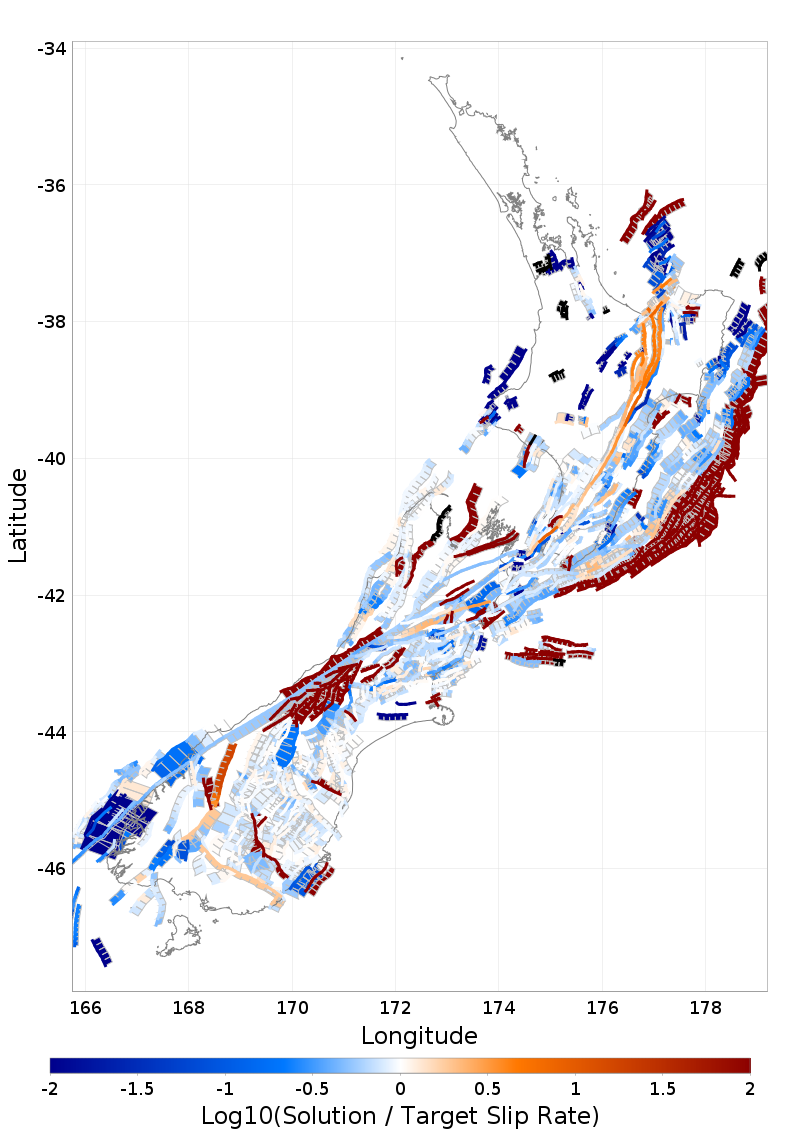
Log10 Slip Rate Plots
(top)
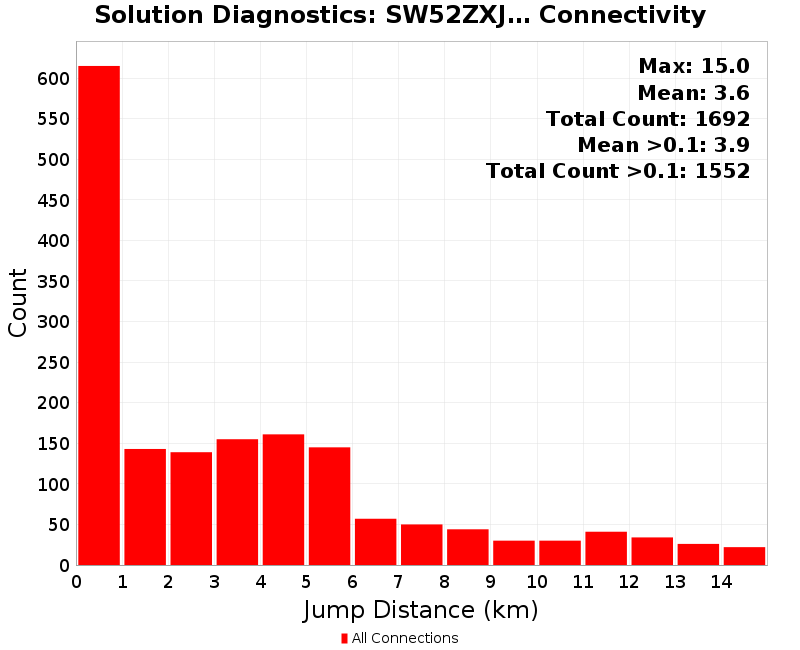
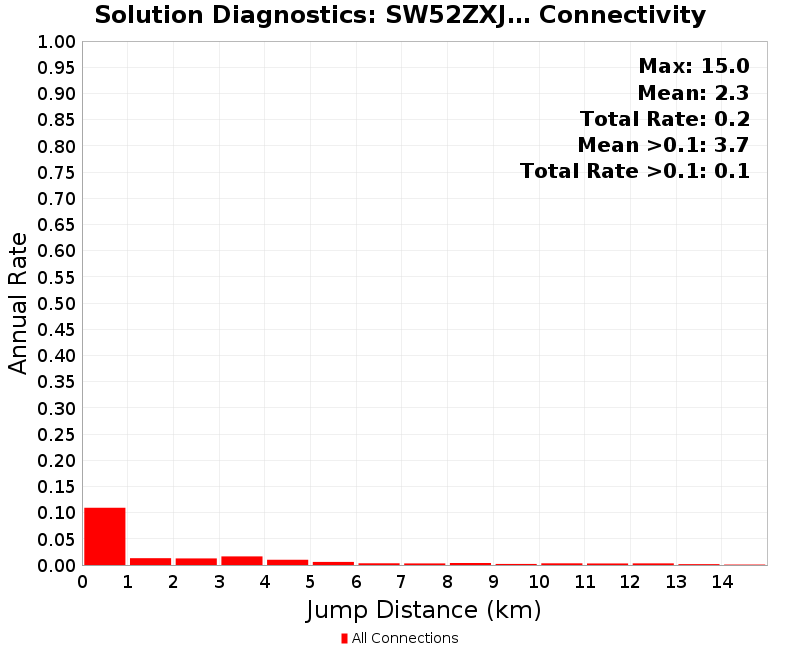
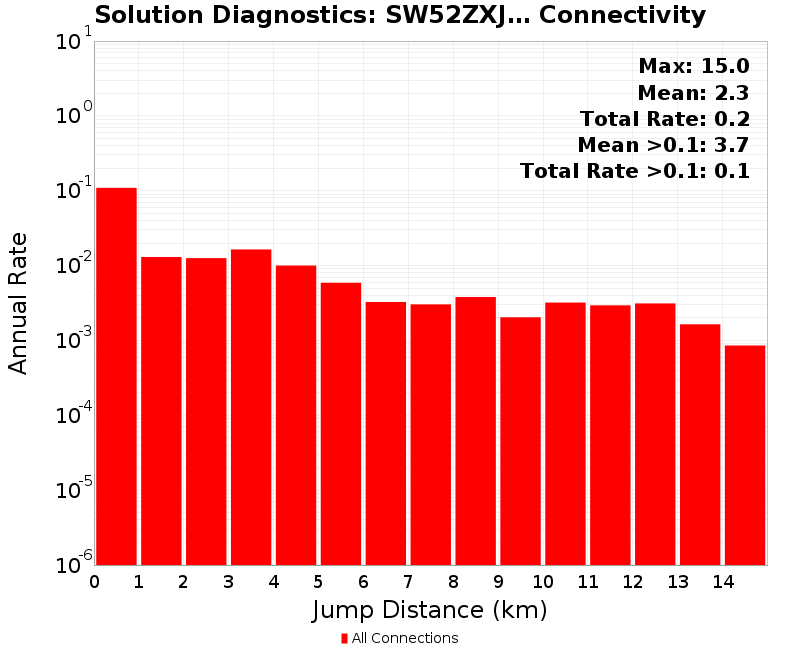
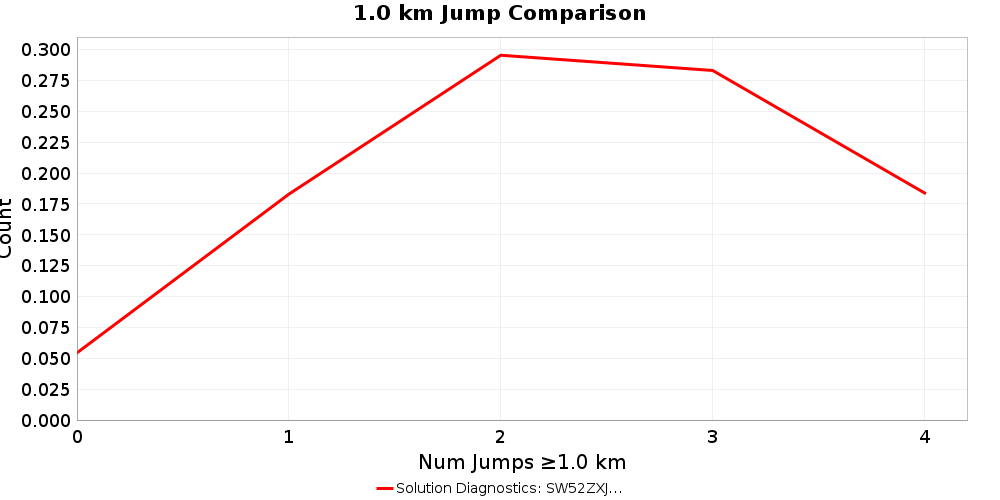
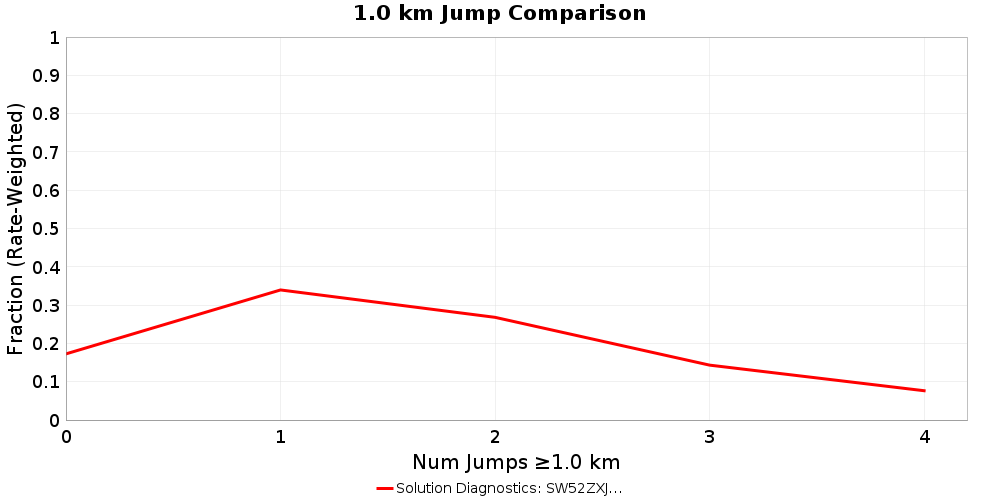
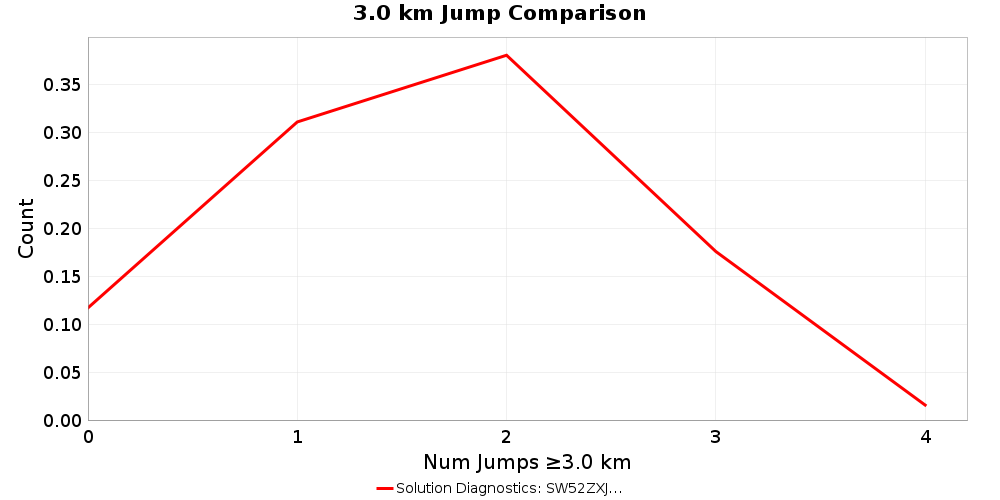
Jump Counts Over Distance
(top)
Supra-seismogenic Jump Counts
(top)
| As Discretized | Rate Weighted |
|---|
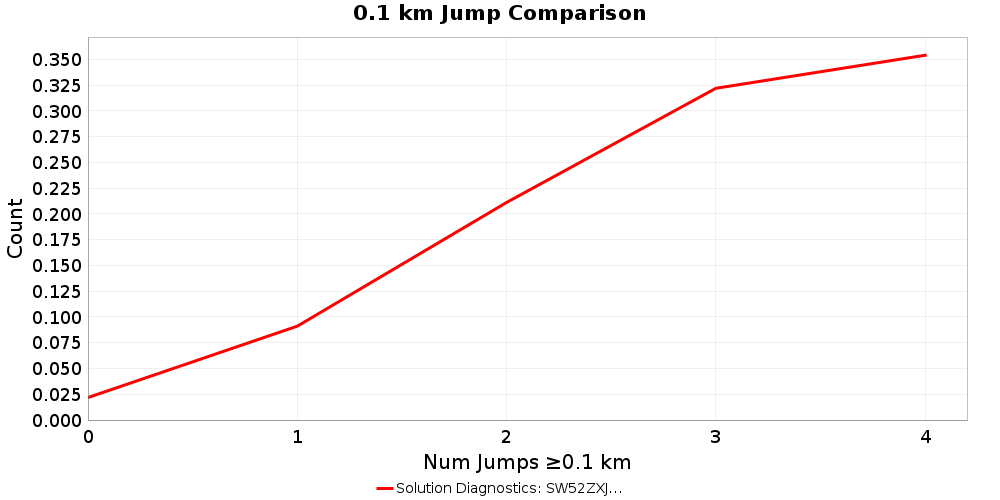 | 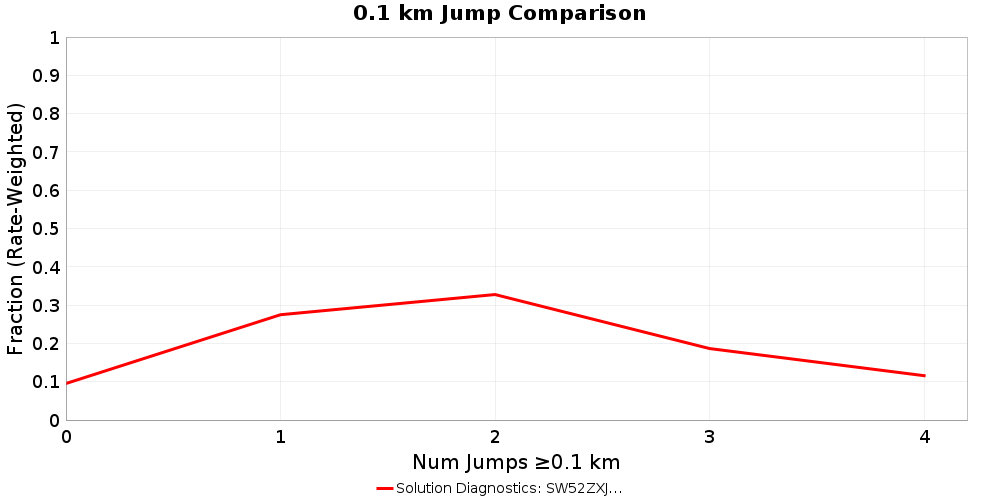 |
 |  |
 | 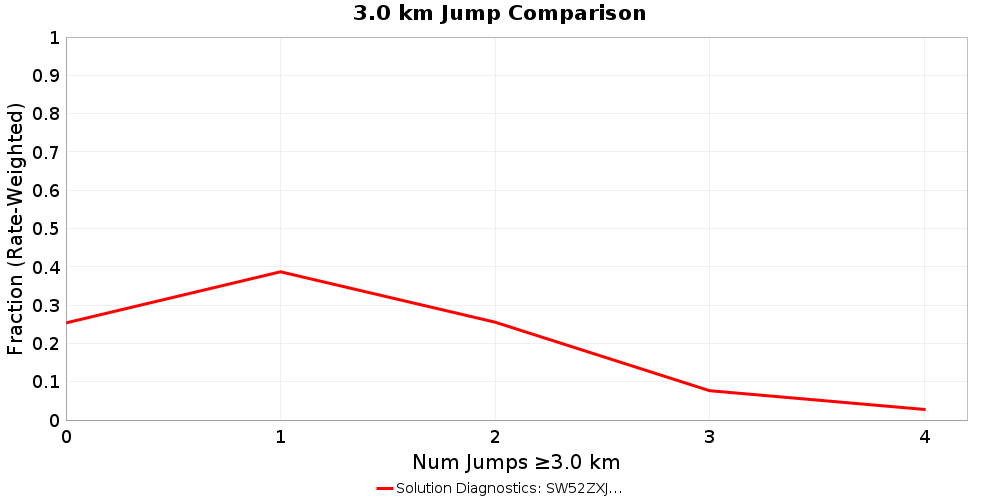 |
M≥7 Jump Counts
(top)
| As Discretized | Rate Weighted |
|---|
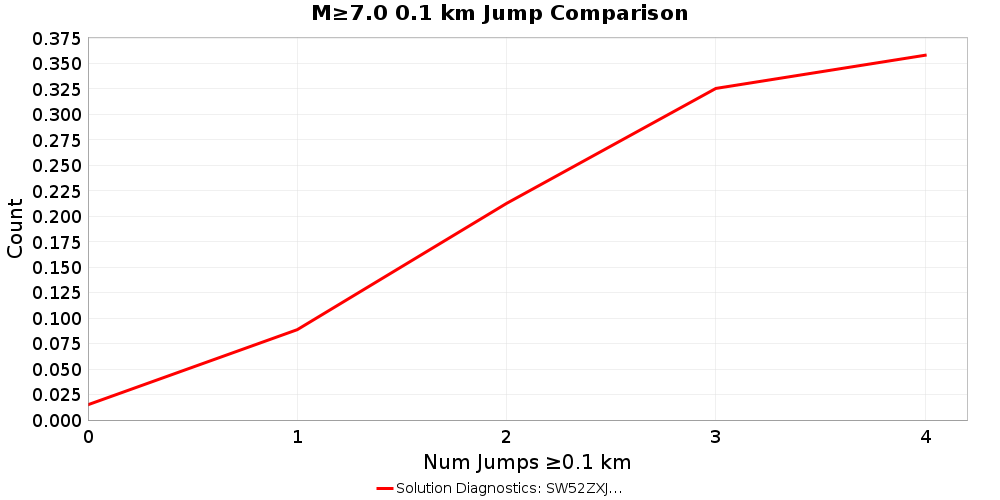 | 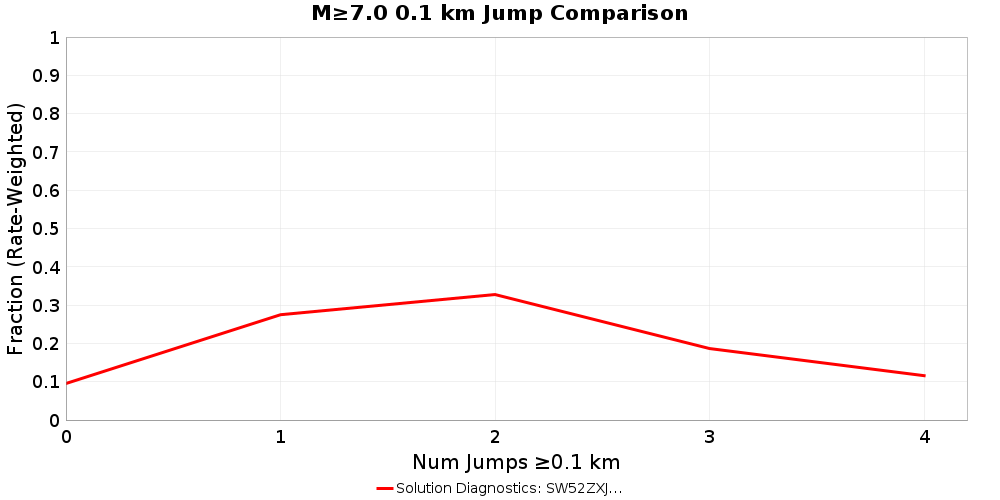 |
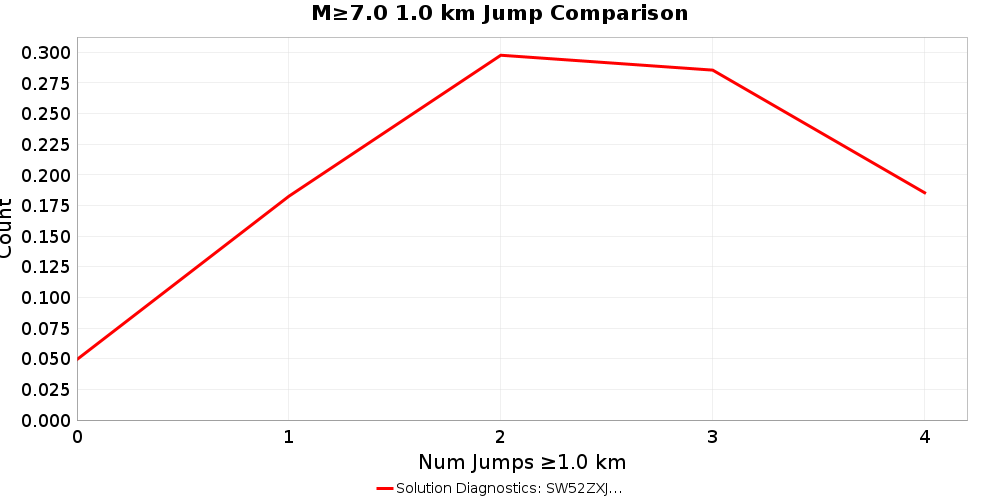 | 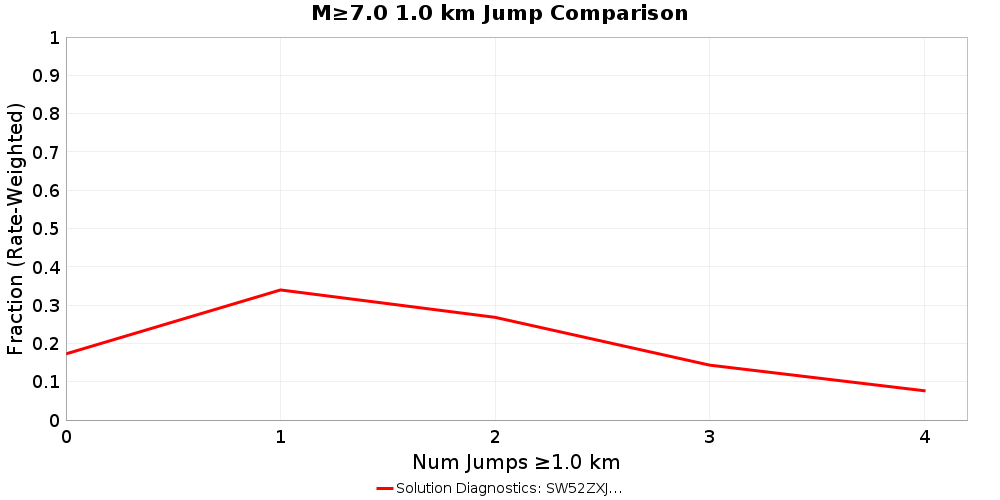 |
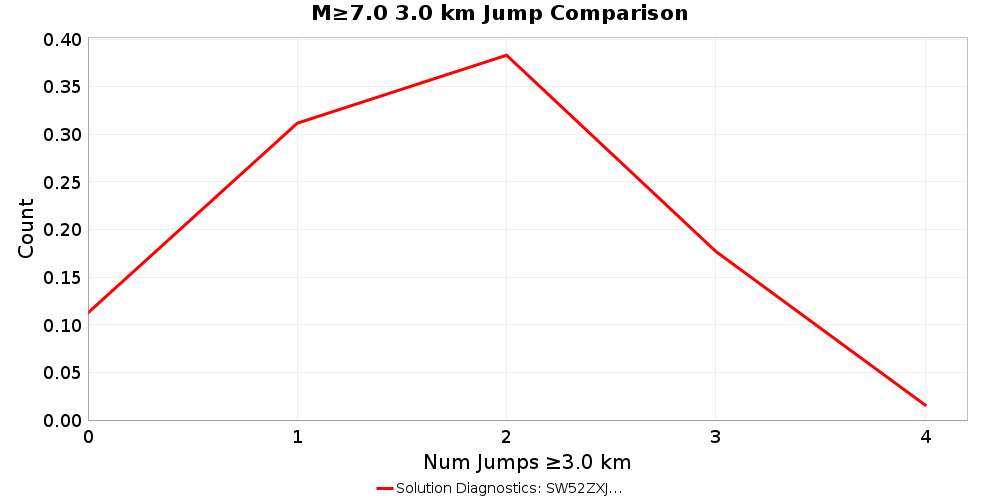 | 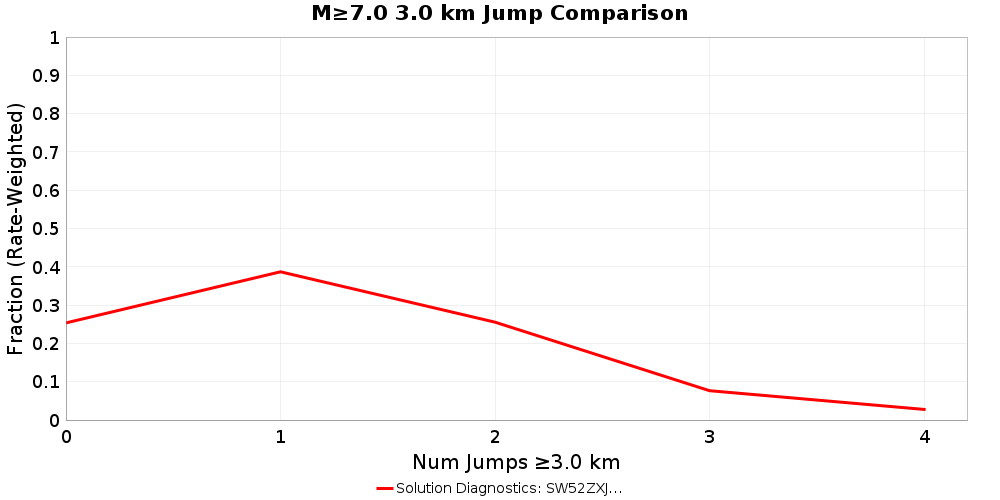 |