Solution Report: Solution Diagnostics: SW52ZXJzaW9uU29sdXRpb246MjA3OTYuMEhVekhG
| Num Ruptures | 447,797 |
|---|---|
| Num Single-Stranded Ruptures | 447,797 (100.00%) |
| Total Supra-Seis Rupture Rate | 0.047287356 |
| Total Supra-Seis Recurrence Interval | 21.15 yrs |
| Total Moment Rate | 2.8874501e19 N-m/yr |
| Deformation Model Total Moment Rate | 3.120471e19 N-m/yr |
| Magnitude Range | [5.93,8.62] |
| Length Range | [1.86,1132.40] km |
| Rupture Section Count Range | [2,109] |
Table Of Contents
- General Information
- Logic Tree Branch
- Solution MFDs
- Simulated Annealing Energy
- Rupture Rate Distribution
- Participation Rates
- Section b-values
- Plausibility Configuration
- Rupture Scalar Histograms
- Attached Modules
- Fault Section Connections
- Slip Rates
- Jump Counts Over Distance
- Hazard Maps
- Fault Segmentation
- Parent Section Detail Pages
General Information
Test down-dip subsectioning rup set
Logic Tree Branch
| Level | Choice |
|---|---|
| Fault Model | (N/A) |
| Fault Regime | Fault Regime |
| NZSHM22_SpatialSeisPDF | NZSHM22_1346 |
| Slip Along Rupture Model (Dsr) | Uniform |
| Inversion Model | Characteristic (Constrained) |
| NZSHM22_ScalingRelationship | NZSHM22_ScalingRelationship |
| NZSHM22_DeformationModel | FAULT_MODEL |
Solution MFDs
Total Target MFDs
| Incremental MFDs | Cumulative MFDs |
|---|---|
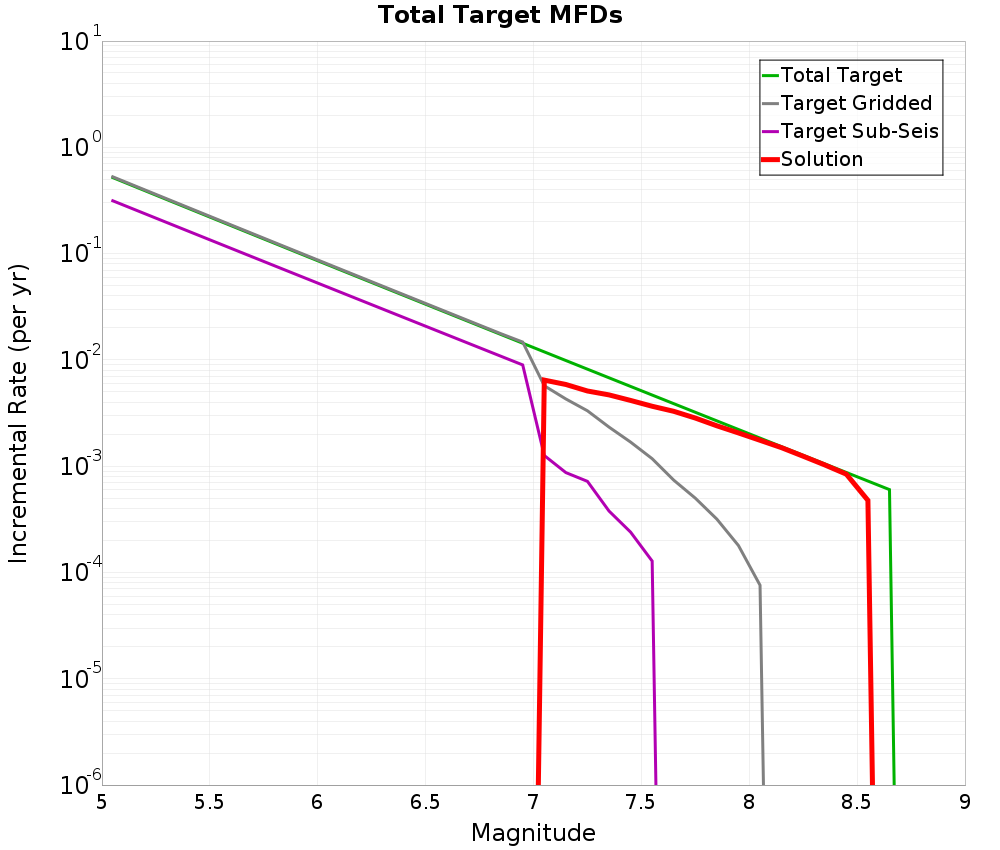 | 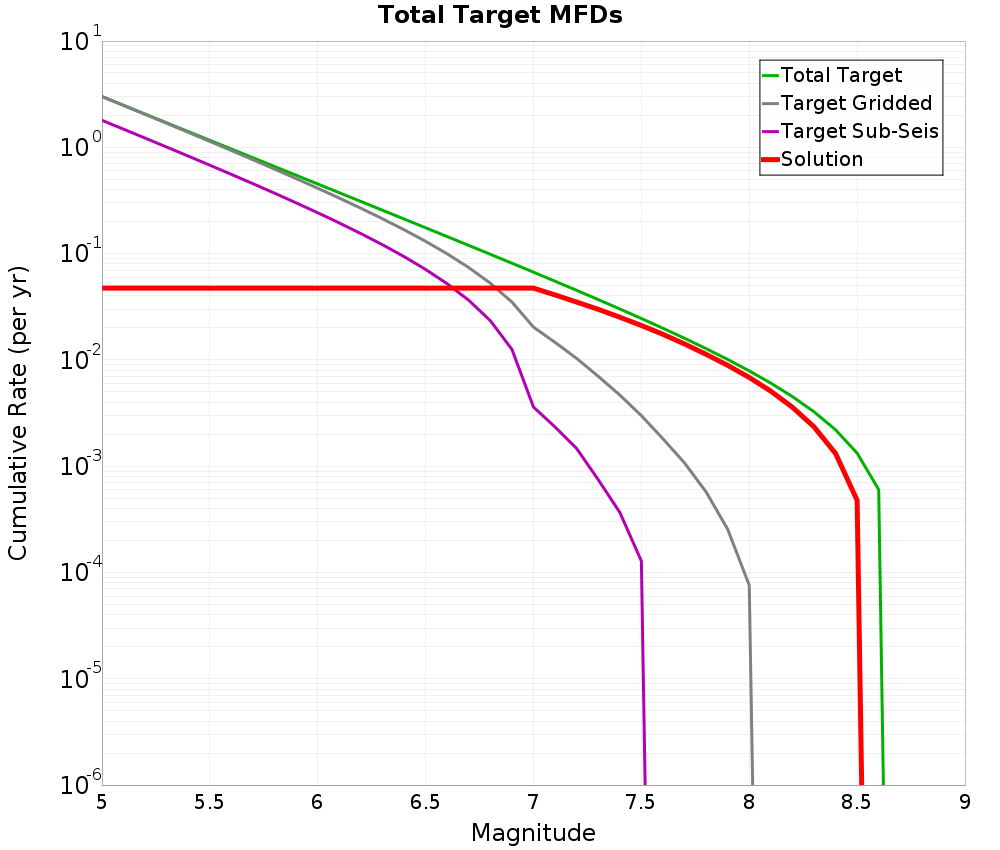 |
NZ RECTANGLE SANS TVZ Gridded Region
| Incremental MFDs | Cumulative MFDs |
|---|---|
 |  |
NZ TVZ Gridded Region
| Incremental MFDs | Cumulative MFDs |
|---|---|
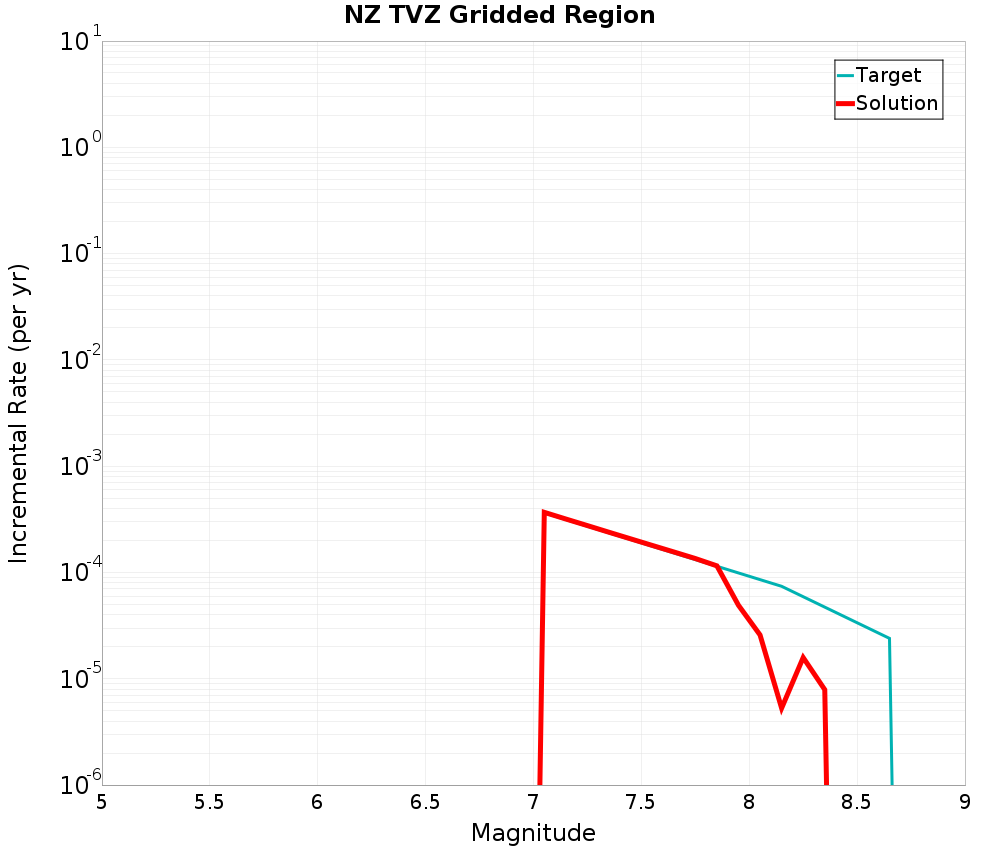 | 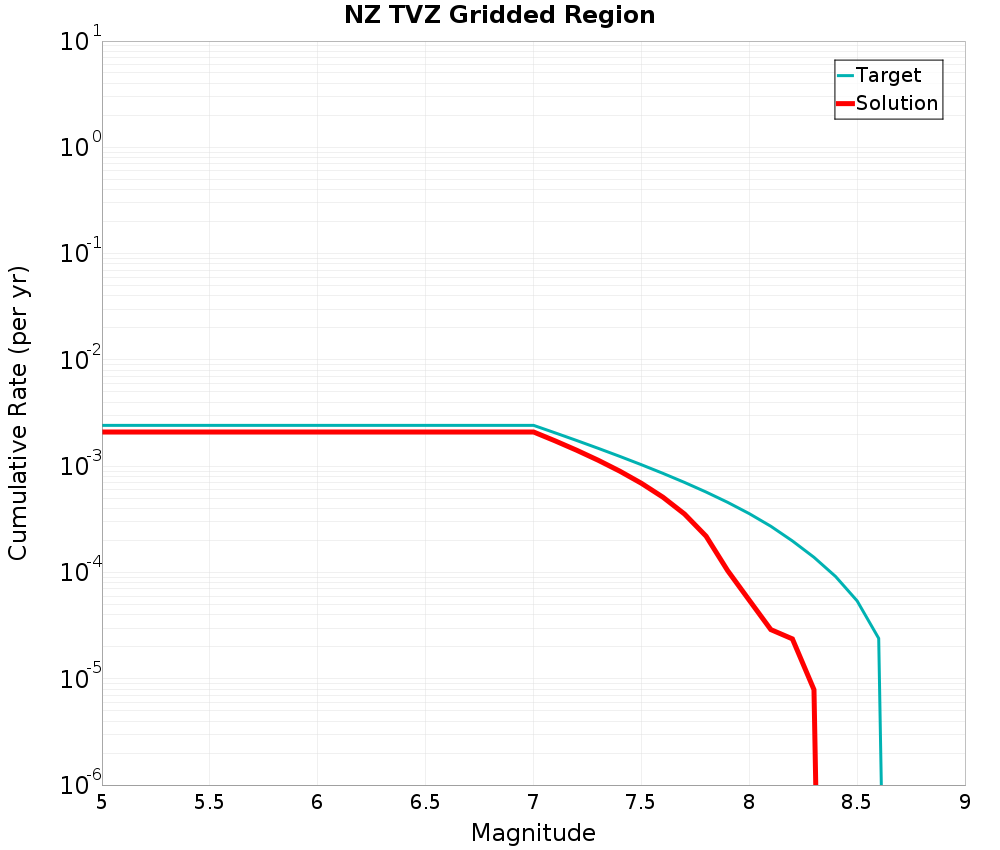 |
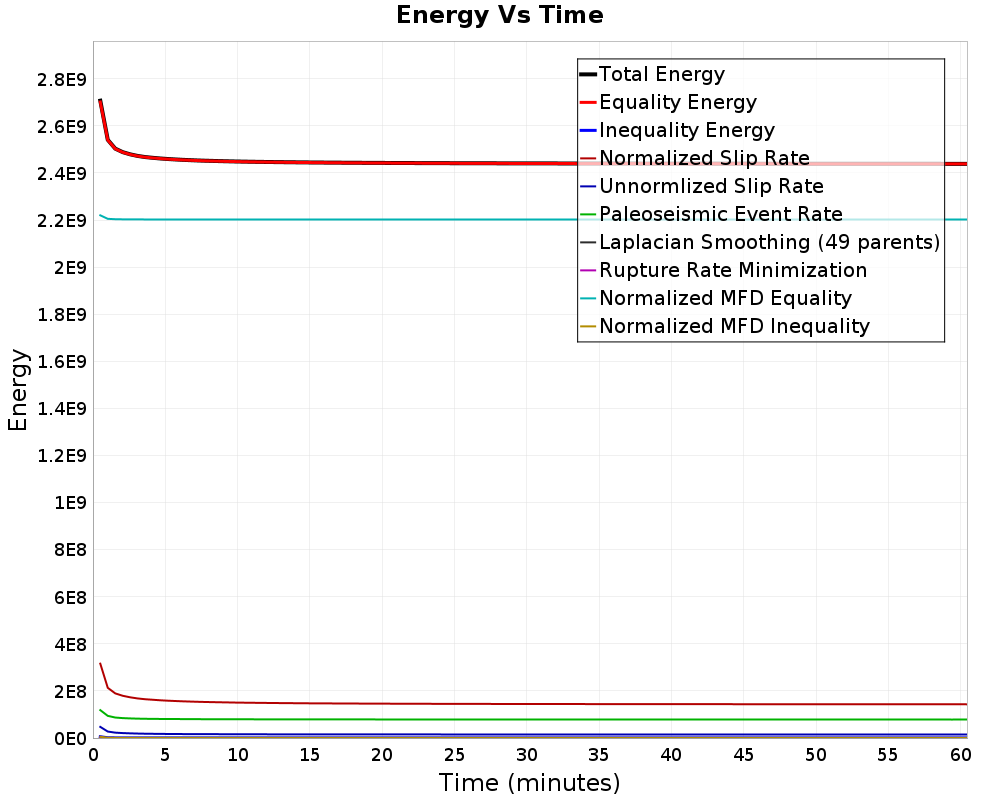
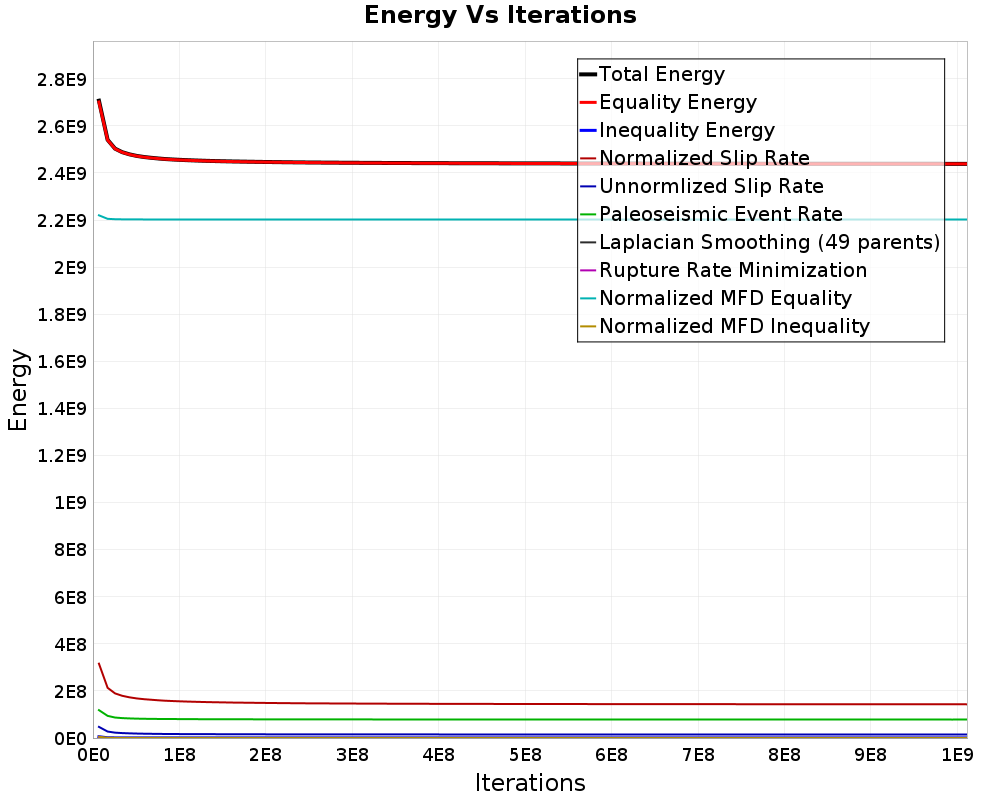
Simulated Annealing Energy
| Iterations | 1,011,235,894 |
|---|---|
| Time | 1 hour 0.4 mins |
| Iterations Per Sec. | 278,879 |
| Perturbations | 9,074,922 |
| # Worse Pertubations Kept | 7 |
| Iterations Per Perturb. | 111 |
| Total Energy | 2.43893427E9 |
Final Energies
| Energy Type | Final Energy (1 hour 0.4 mins) | % of Total | After 30 mins |
|---|---|---|---|
| Total Energy | 2.43893427E9 | 2.44082662E9 | |
| Equality Energy | 2.43855155E9 | 99.98% | 2.44042752E9 |
| Entropy Energy | 0.0 | 0.00% | 0.0 |
| Inequality Energy | 382662.7 | 0.02% | 398969.72 |
| Normalized Slip Rate | 1.43093376E8 | 5.87% | 1.4445824E8 |
| Unnormlized Slip Rate | 1.4770803E7 | 0.61% | 1.5017882E7 |
| Paleoseismic Event Rate | 7.8337272E7 | 3.21% | 7.85456E7 |
| Laplacian Smoothing (49 parents) | 1302.9084 | 0.00% | 1138.8765 |
| Rupture Rate Minimization | 0.0 | 0.00% | 0.0 |
| Normalized MFD Equality | 2.2023488E9 | 90.30% | 2.20240486E9 |
| Normalized MFD Inequality | 382662.7 | 0.02% | 398969.72 |
Energy Progress
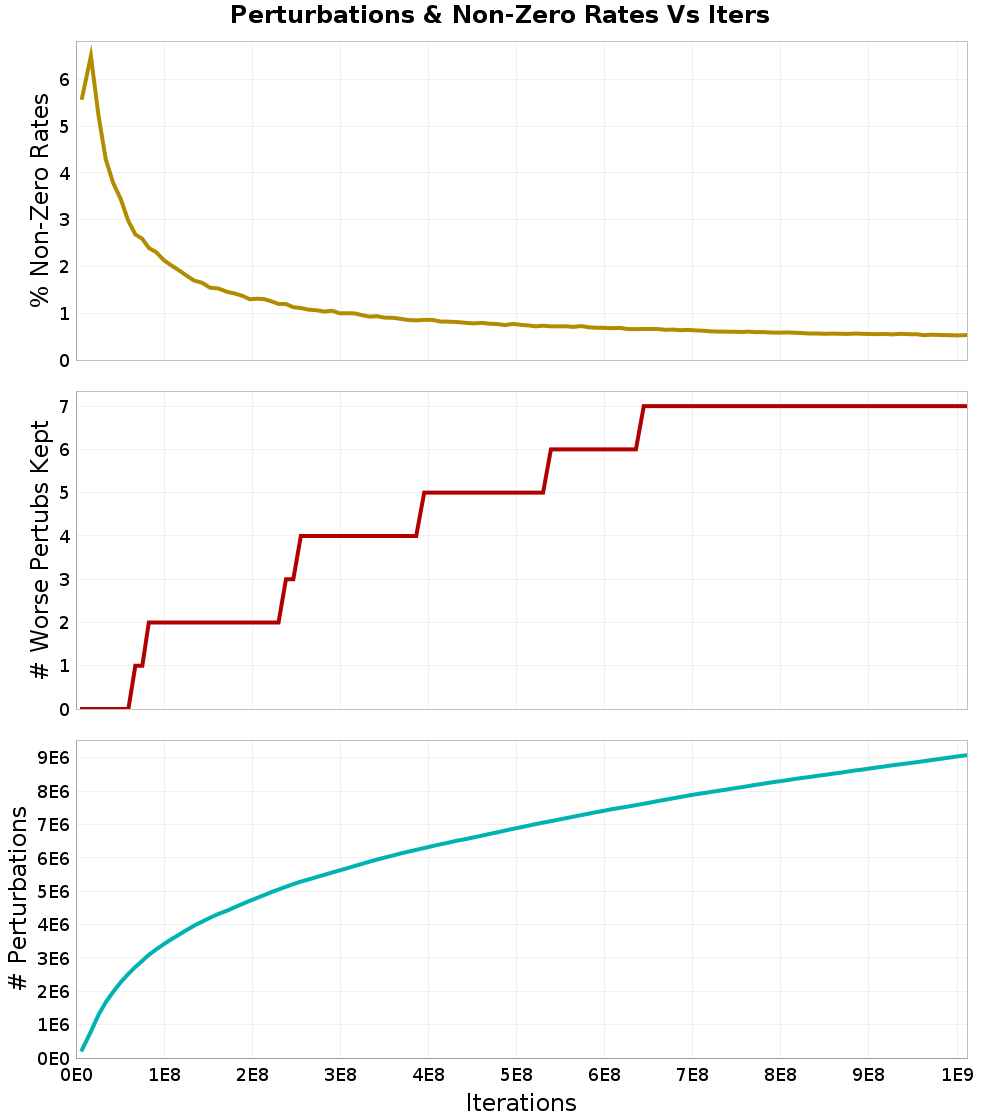
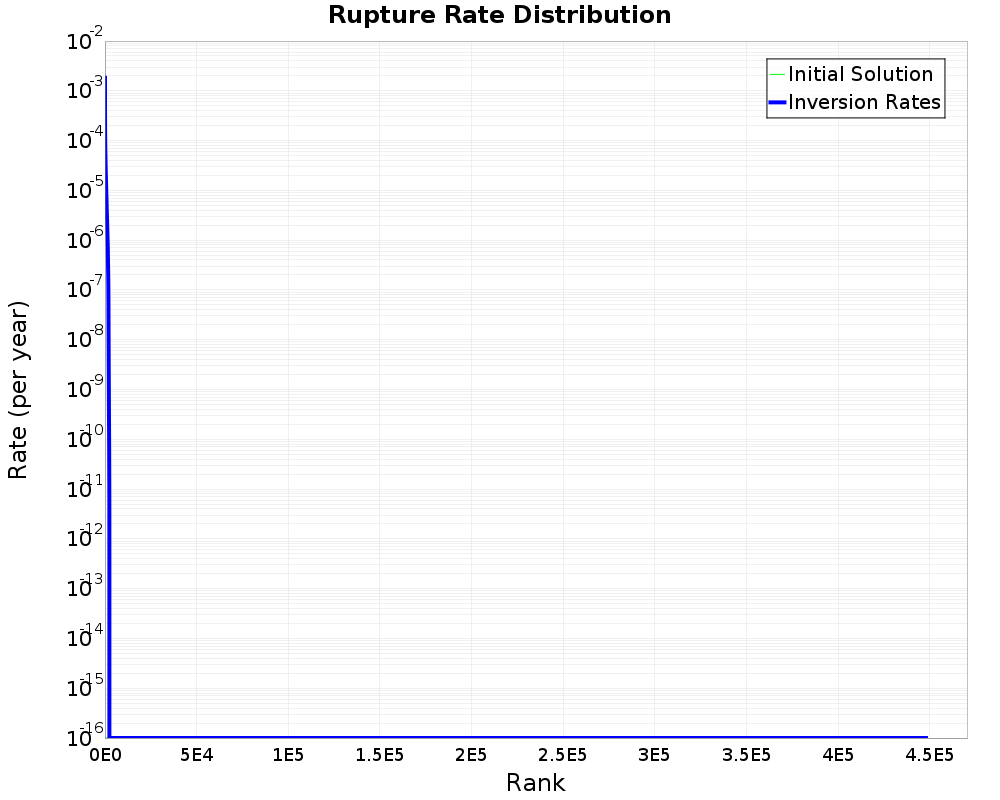
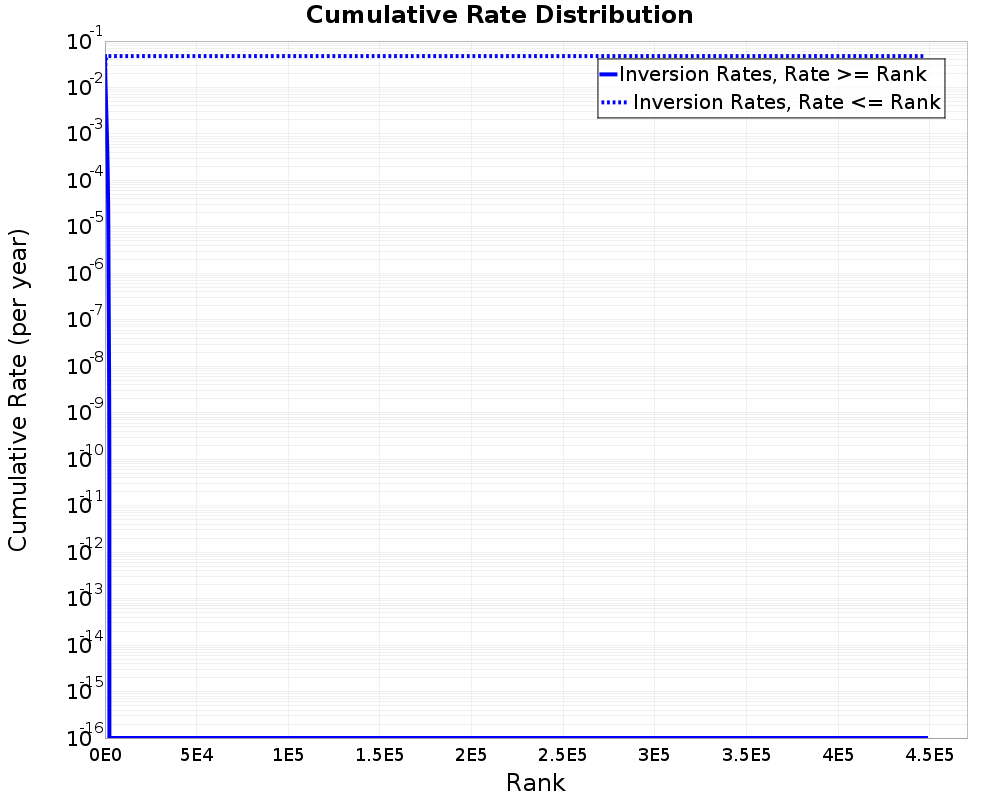
Rupture Rate Distribution
| Non-zero ruptures | 2,391 (0.53%) |
|---|---|
| Avg. # perturbations per rupture | 20.265705 |
| Avg. # perturbations per non-zero rupture | 3795.4504 |
Participation Rates
Supra-Seismogenic | Range: M≤6 |
|---|---|
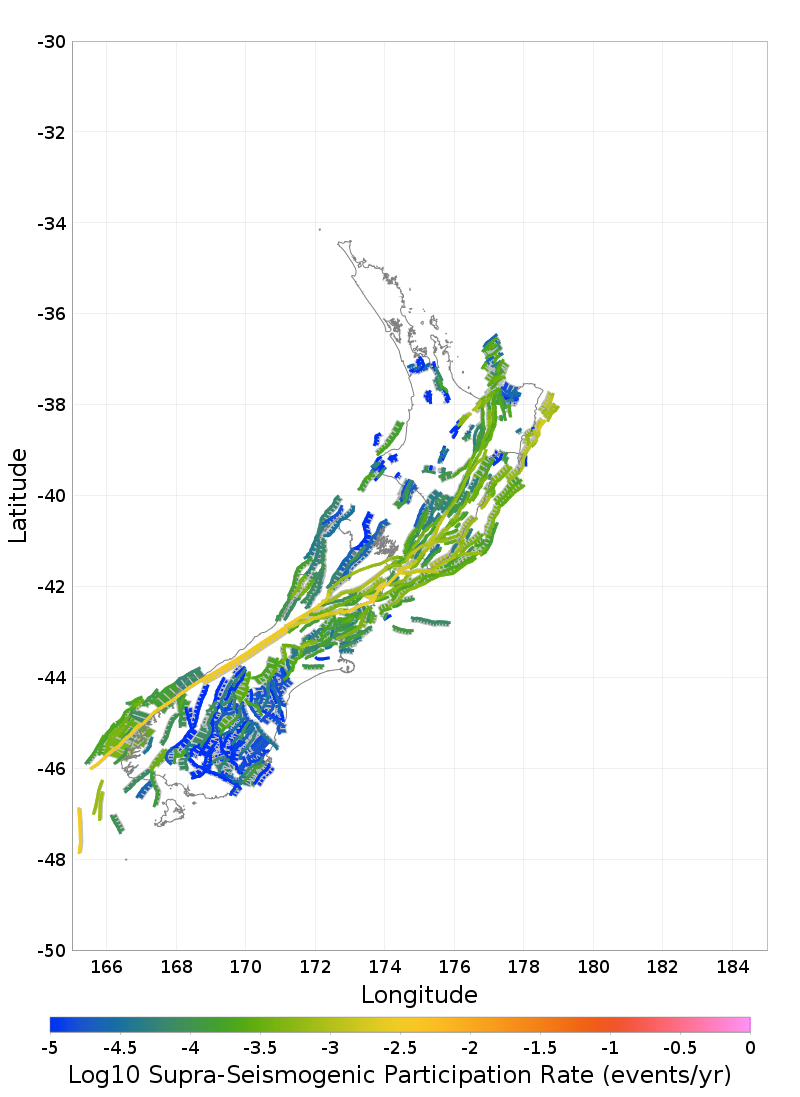 |  |
| Download GeoJSON | Download GeoJSON |
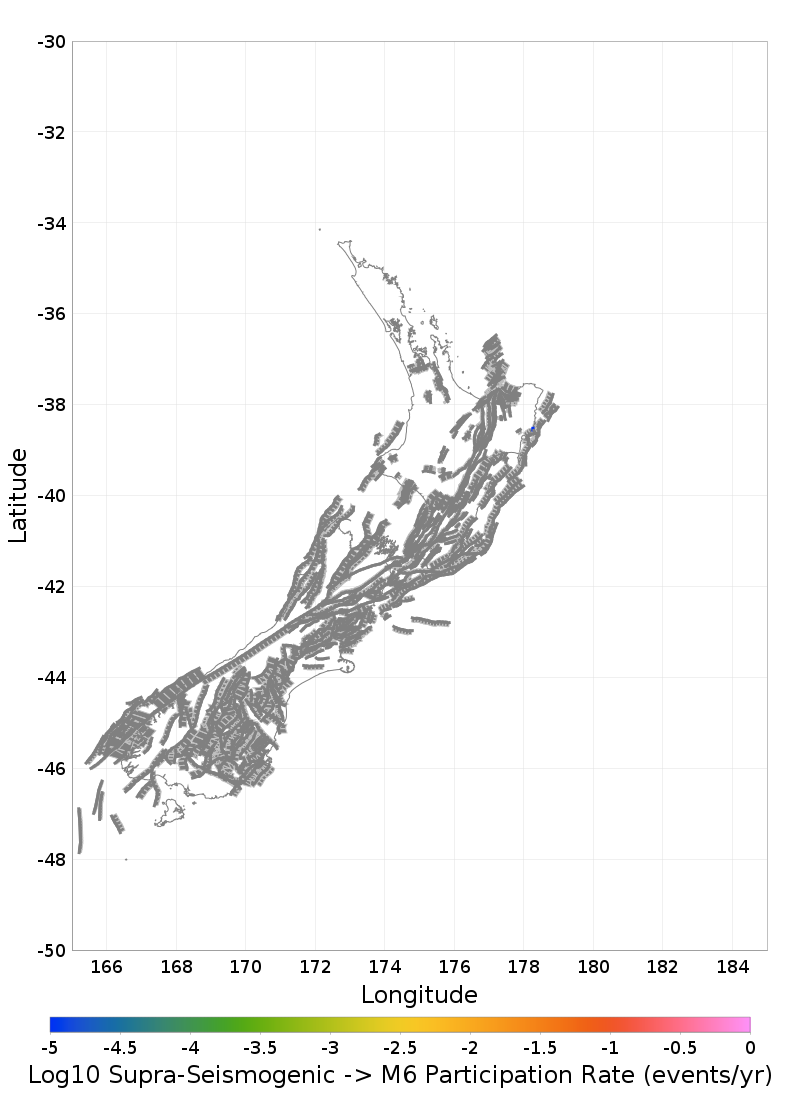
M≥6 | Range: M∈[6, 7] |
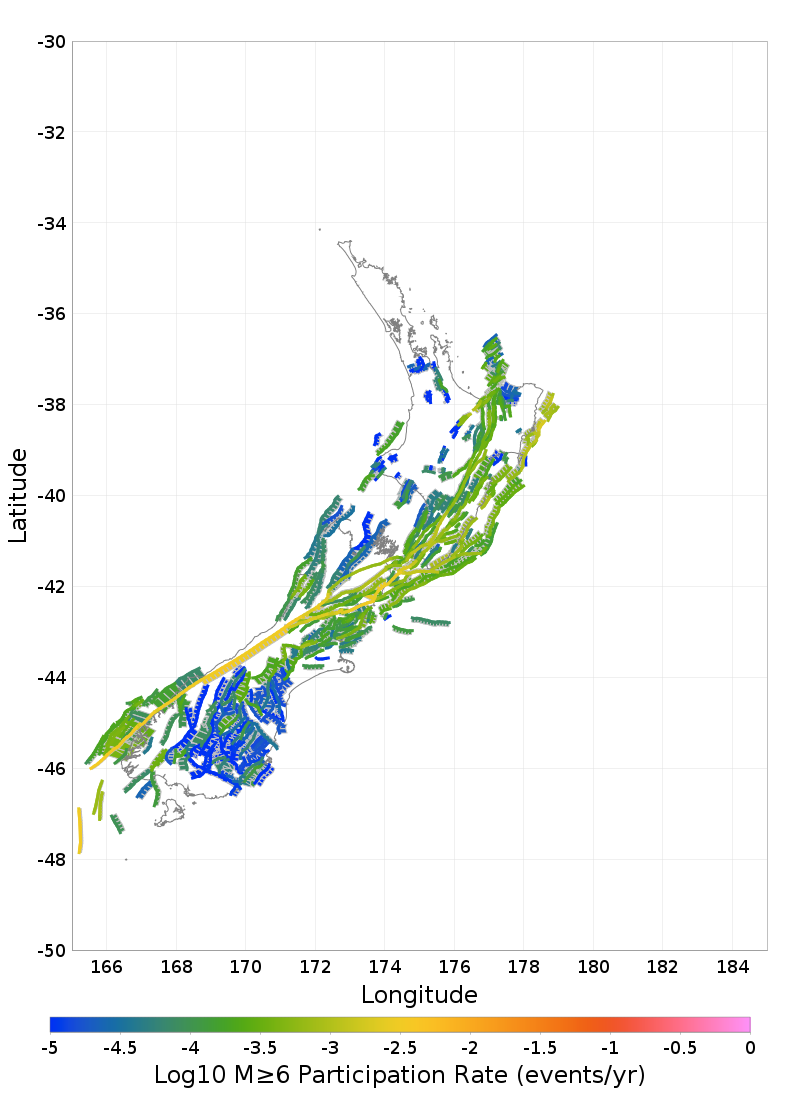 | 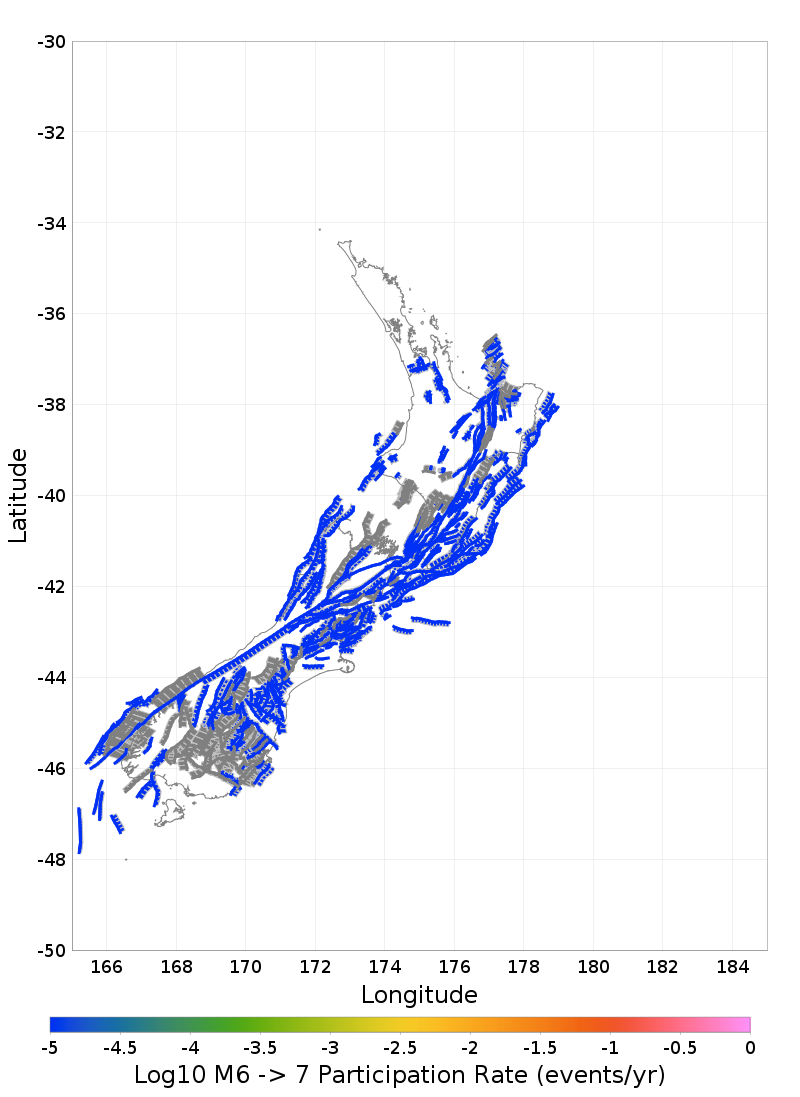 |
| Download GeoJSON | Download GeoJSON |
M≥7 | Range: M∈[7, 8] |
 | 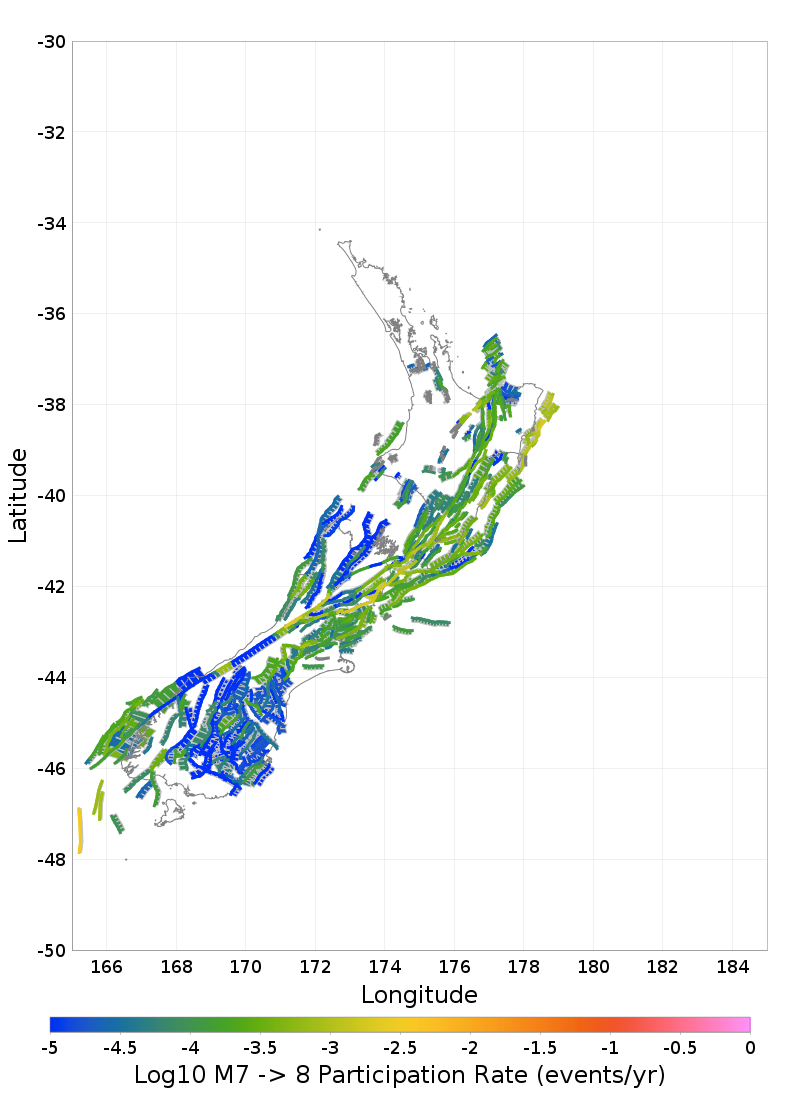 |
| Download GeoJSON | Download GeoJSON |
M≥8 | |
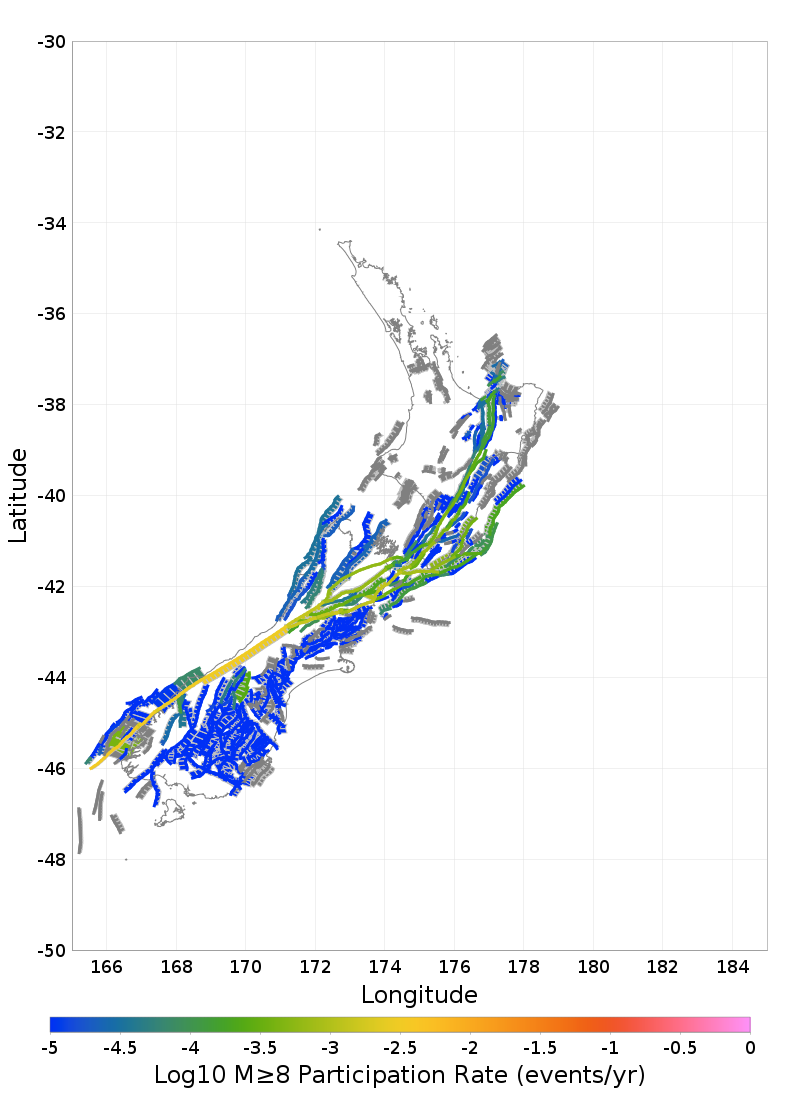 | |
| Download GeoJSON |
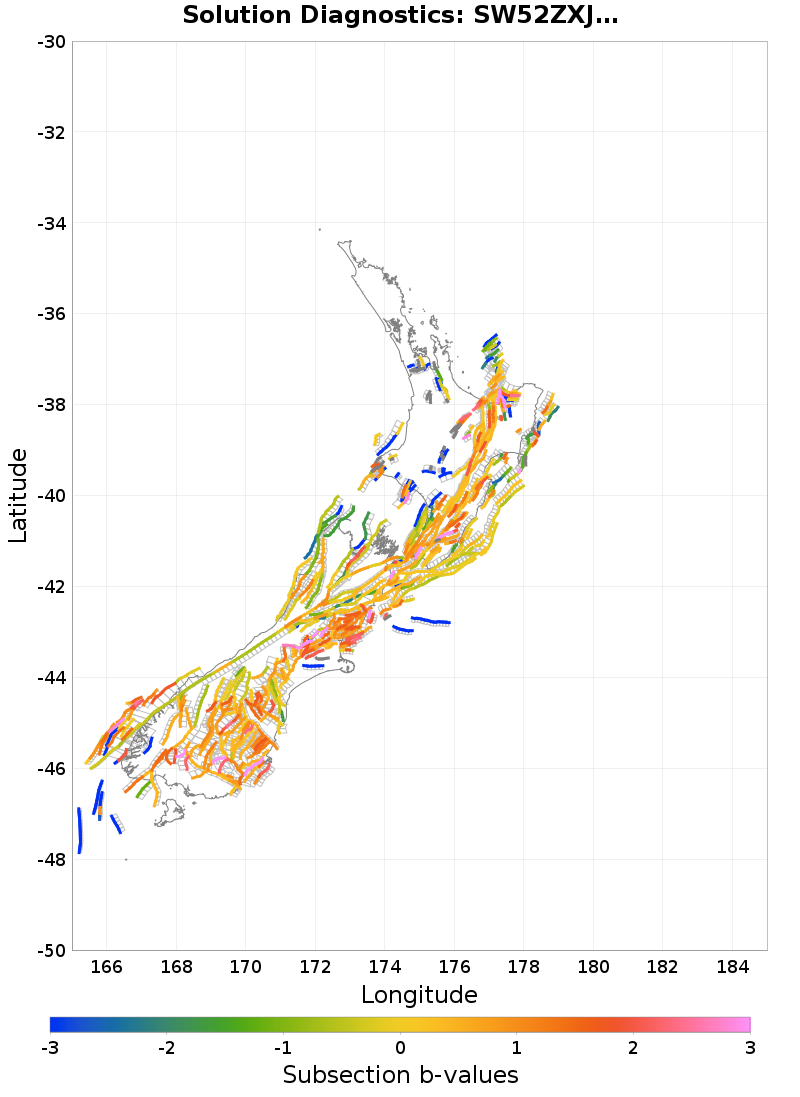
Section b-values
Subsection b-values
These plots estimate a Gutenberg-Richter b-value for each subsection and parent section nucleation MFD. This is a rough approximation, and is intended primarily for model comparisons.
Download b-value CSV file: sect_b_values.csv
| b-Value Distribution | b-Value Rate-Dependence |
|---|---|
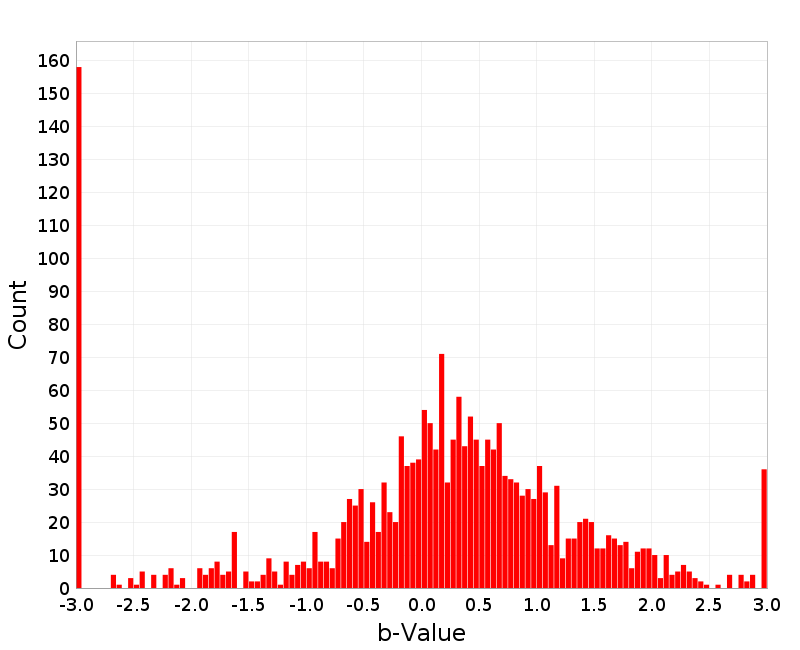 | 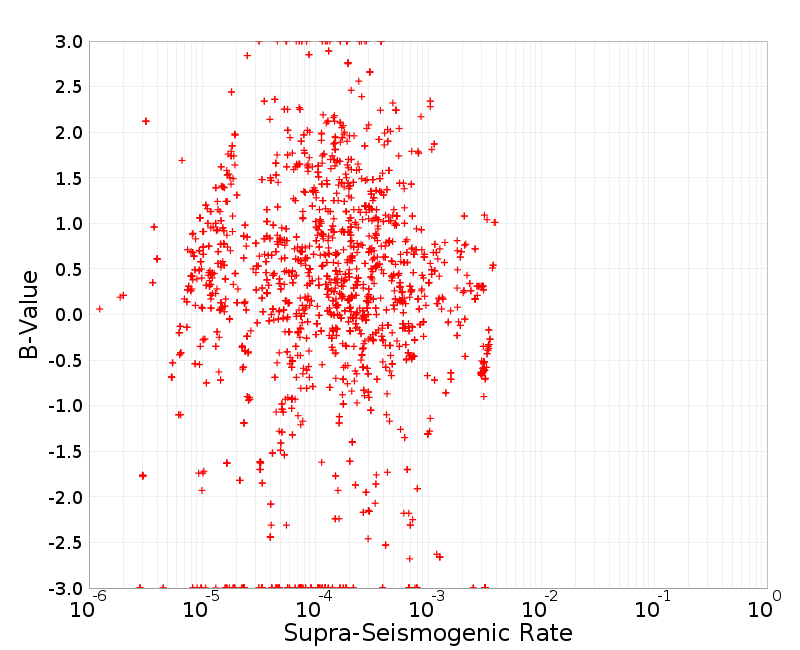 |
Parent Section b-values
Download b-value CSV file: parent_sect_b_values.csv
| b-Value Distribution | b-Value Rate-Dependence |
|---|---|
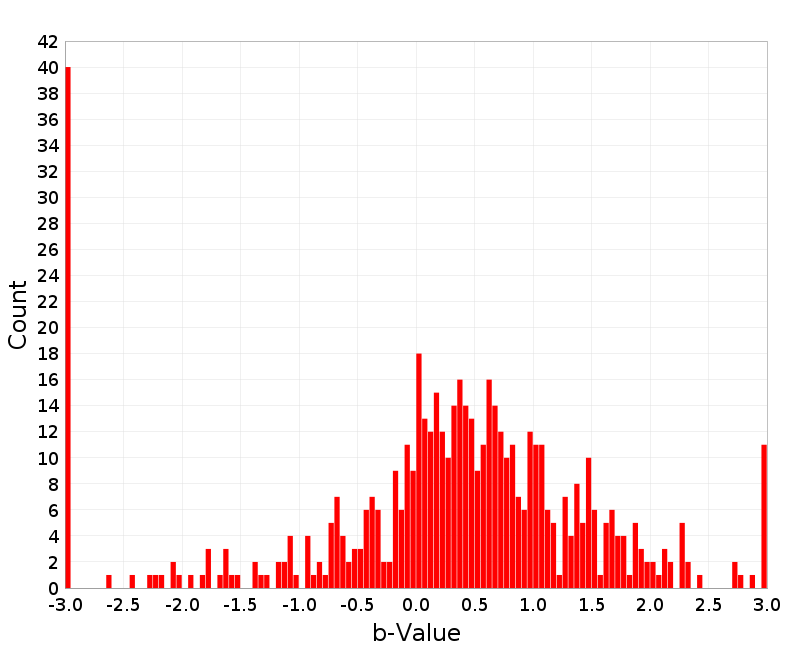 | 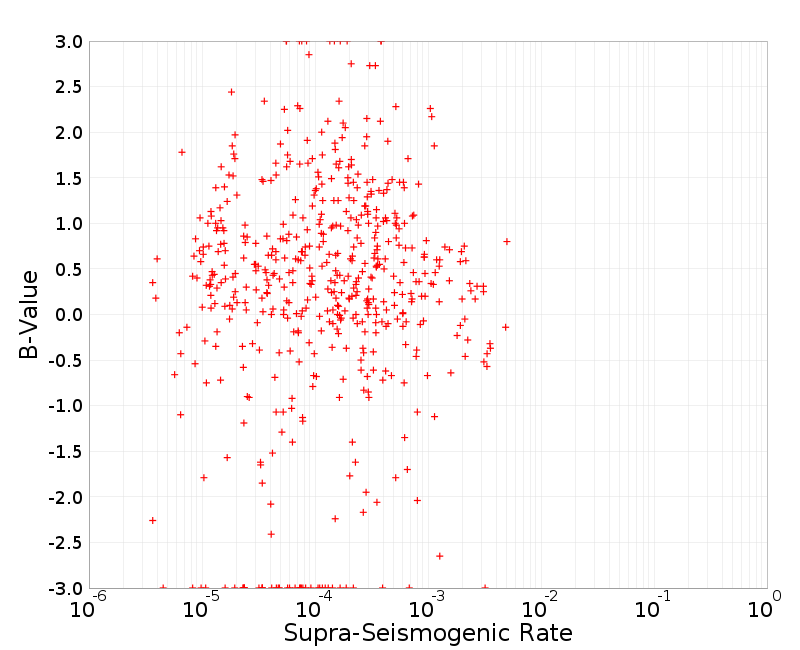 |
Plausibility Configuration
Connection Strategy
| Solution Diagnostics: SW52ZXJzaW9uU29sdXRpb246MjA3OTYuMEhVekhG | |
|---|---|
| Name | Adaptive (r₀=6.0 km) Plausible (3 filters): maxDist=15 km, MultiEnds |
| Max Jump Dist | 15 km |
| Possible parent-section connections | Total: 2248, Avg: 3.99, Range: [0,16] |
| Actual connections (after applying filters) | Total: 1205, Avg: 4.55, Range: [1,17] |
Splays
| Solution Diagnostics: SW52ZXJzaW9uU29sdXRpb246MjA3OTYuMEhVekhG | |
|---|---|
| Max Allowed Splays | 0 |
Plausibility Filters
| Solution Diagnostics: SW52ZXJzaW9uU29sdXRpb246MjA3OTYuMEhVekhG |
|---|
| Cumulative Rake Change ≤360 |
| Min Sections Per Parent |
| Net Rupture [[Sum [Num ≥0]]/Count]>0.75 |
| No Indirect Connections |
| P(Rel Slip Rate (@incr.)) ≥0.05 |
| P(Shaw07 [R₀=3]) ≥0.001 |
| Path [P(Rel CFF Sect, Fav15km) ≥0.01, P(CFF Sect Ratio, N=2, Fav15km) ≥0.5] |
Rupture Scalar Histograms
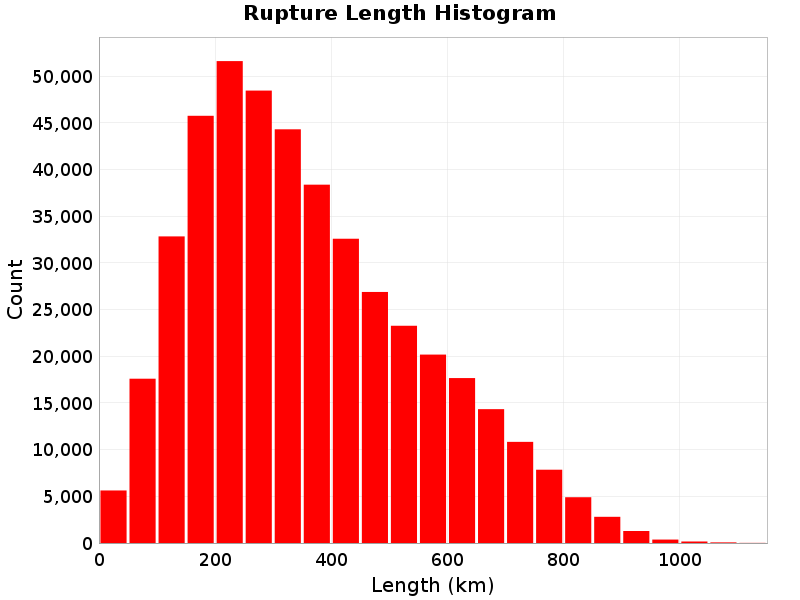
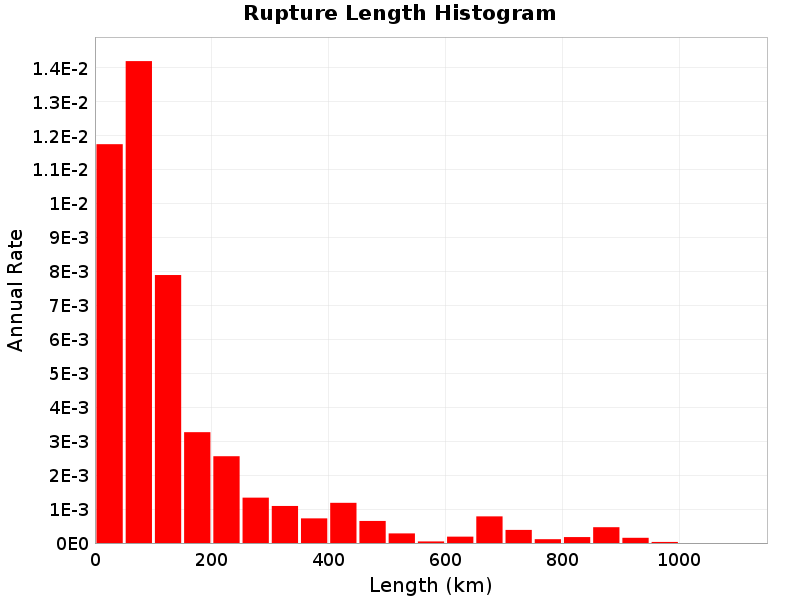
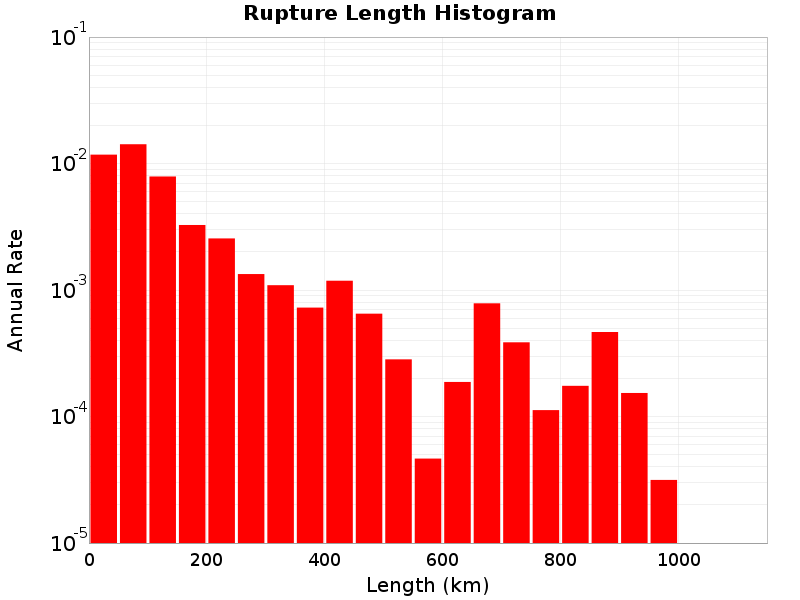
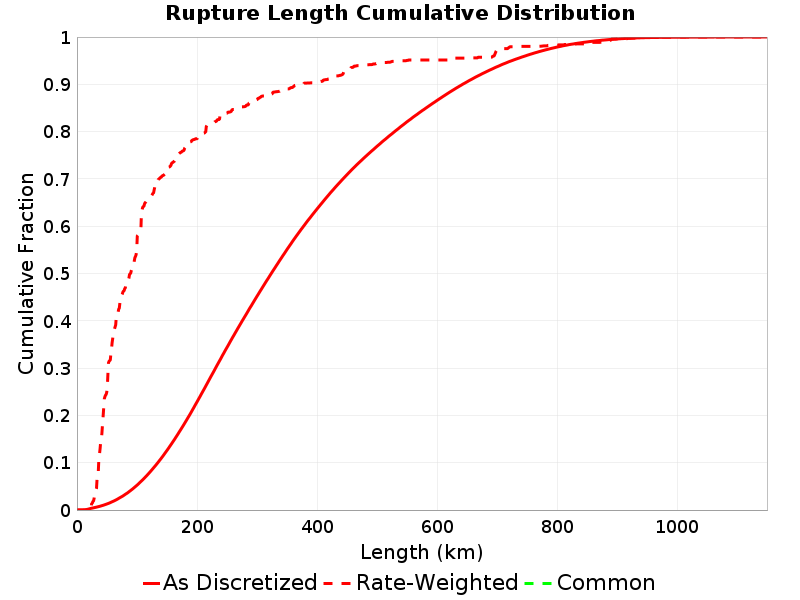
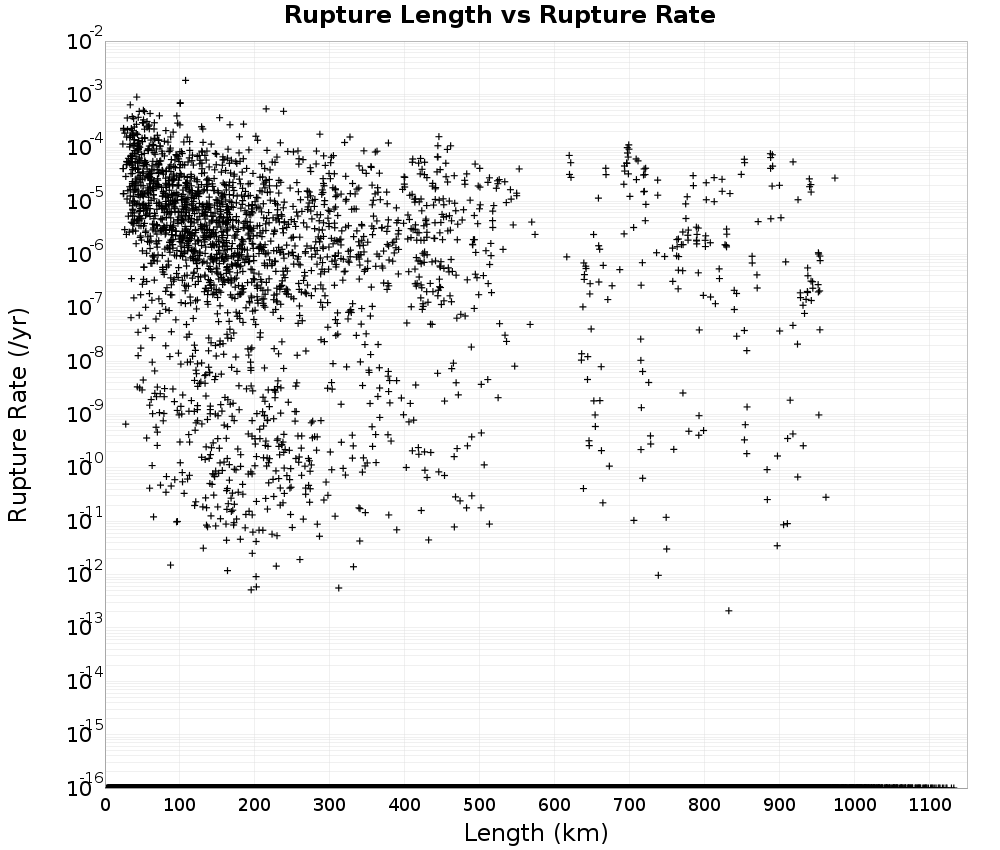
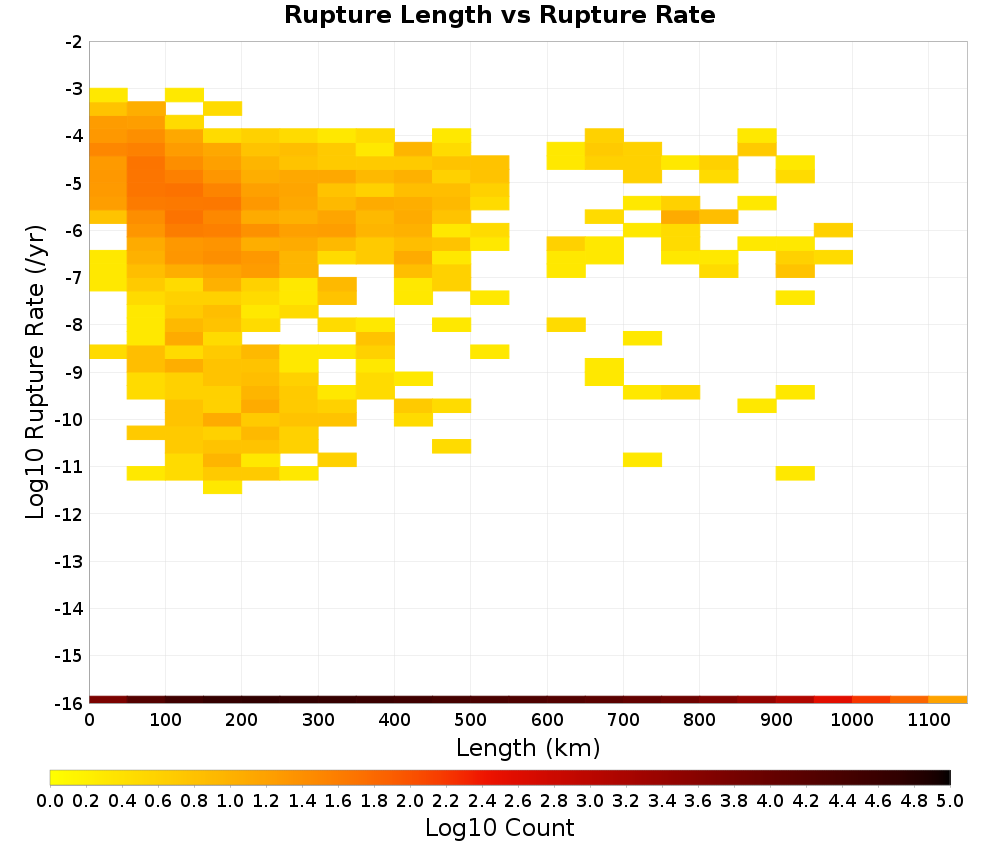
Rupture Length
Total length (km) of the rupture, not including jumps or gaps.
 |
|---|
 |
 |
 |
Rupture Length vs Rupture Rate
 |  |
|---|
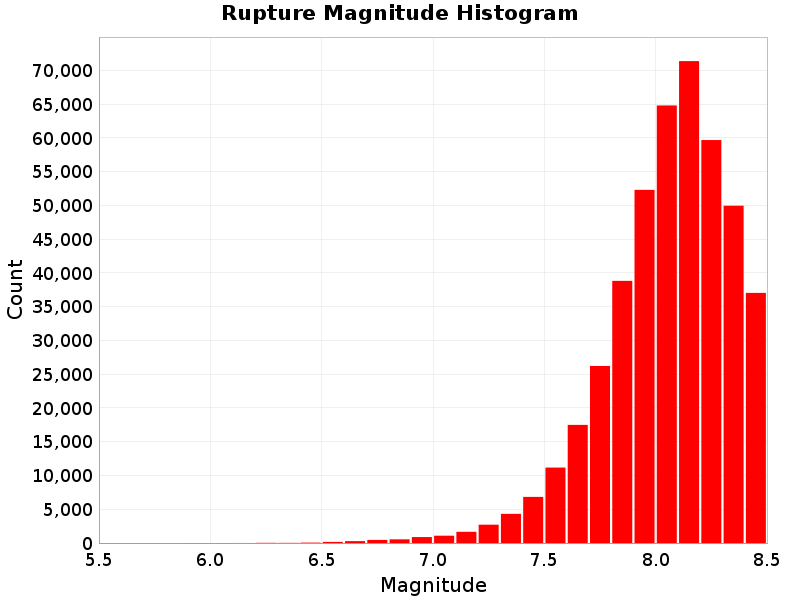
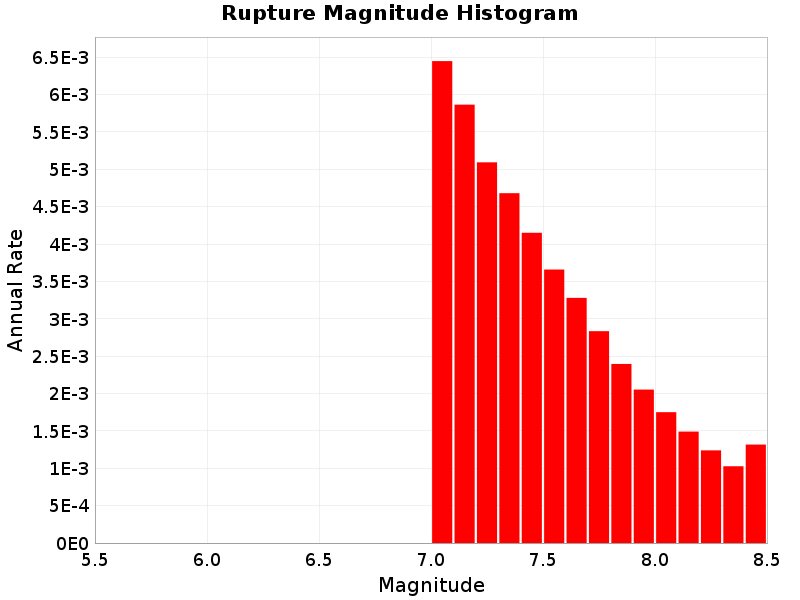
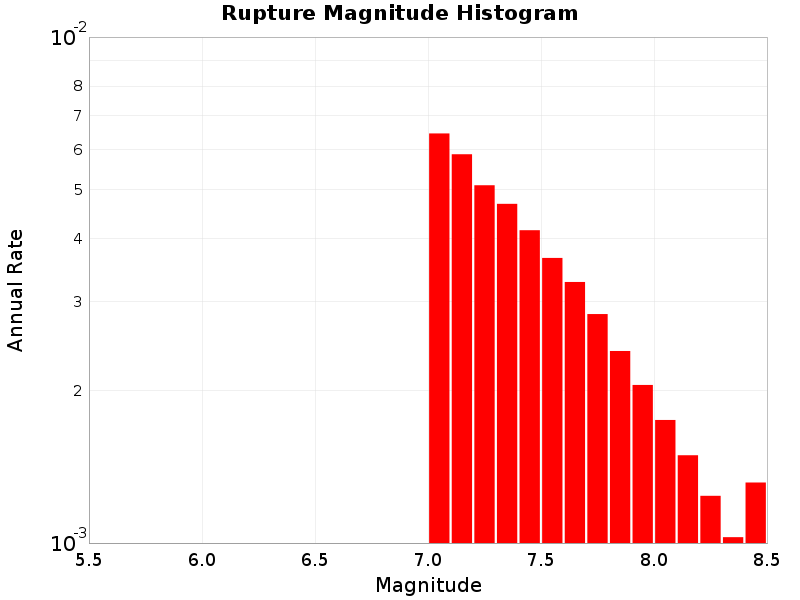
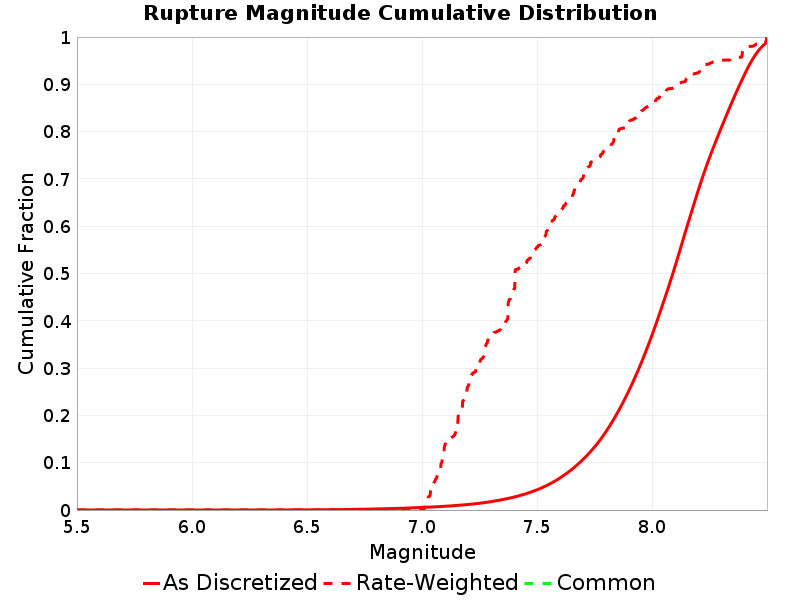
Rupture Magnitude
Magnitude of the rupture.
 |
|---|
 |
 |
 |
Rupture Magnitude vs Rupture Rate
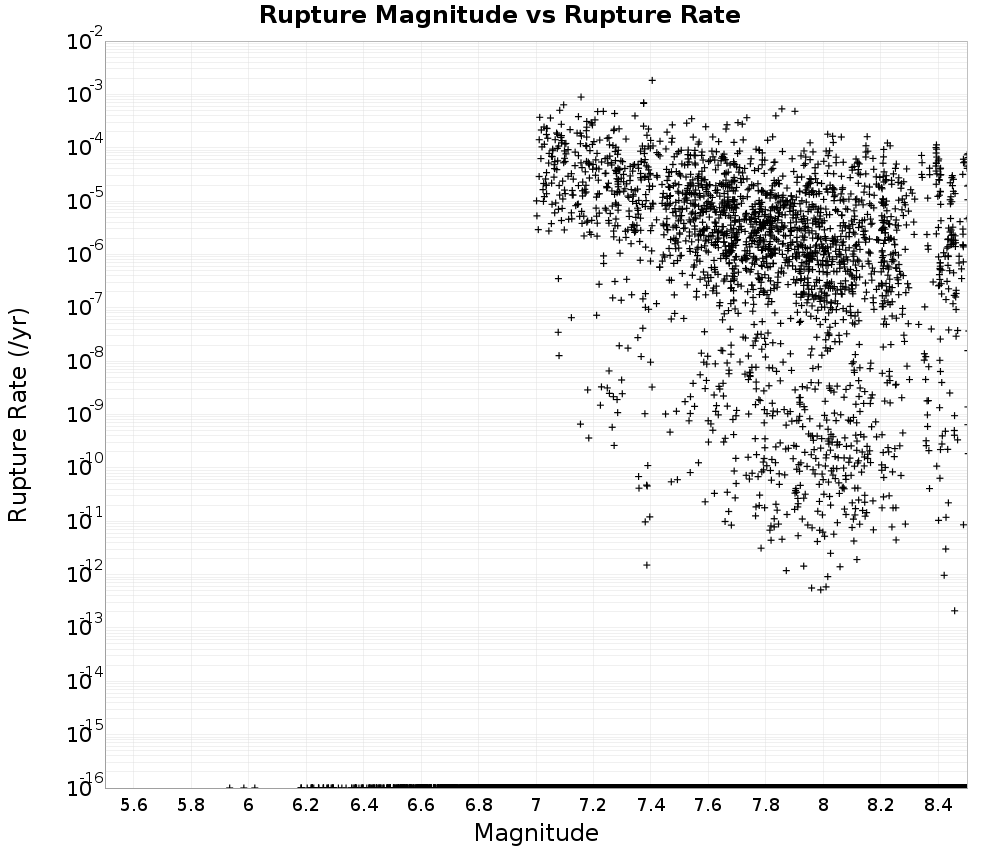 | 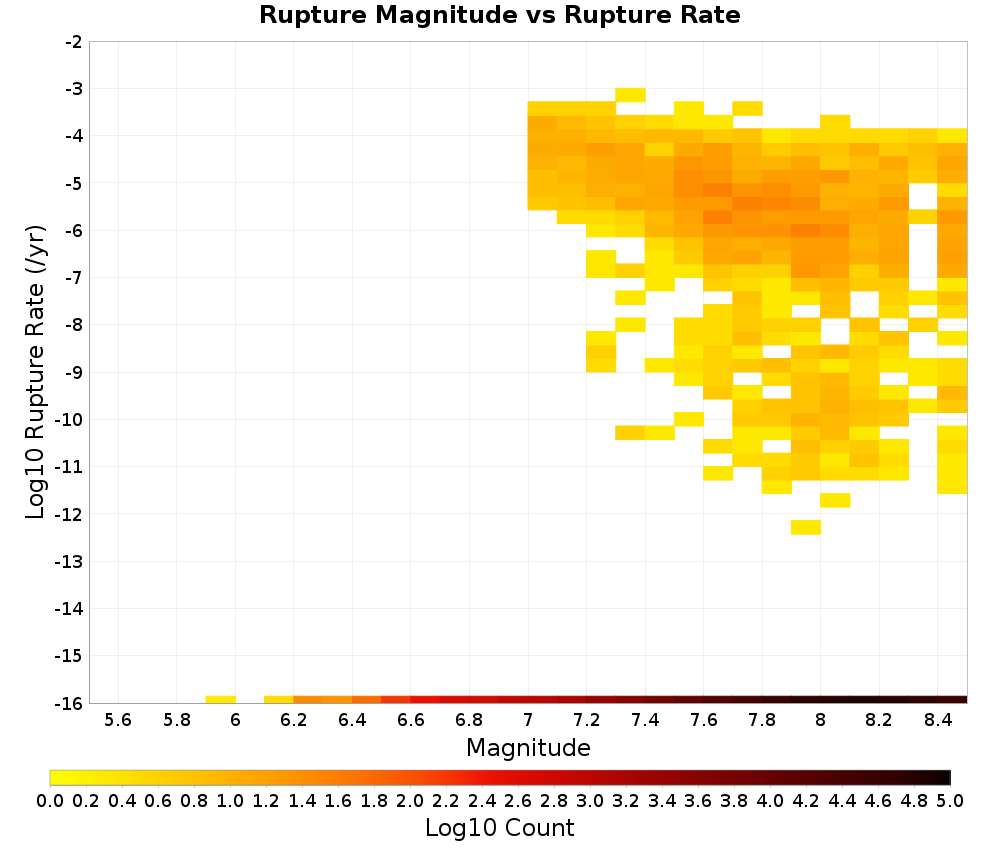 |
|---|
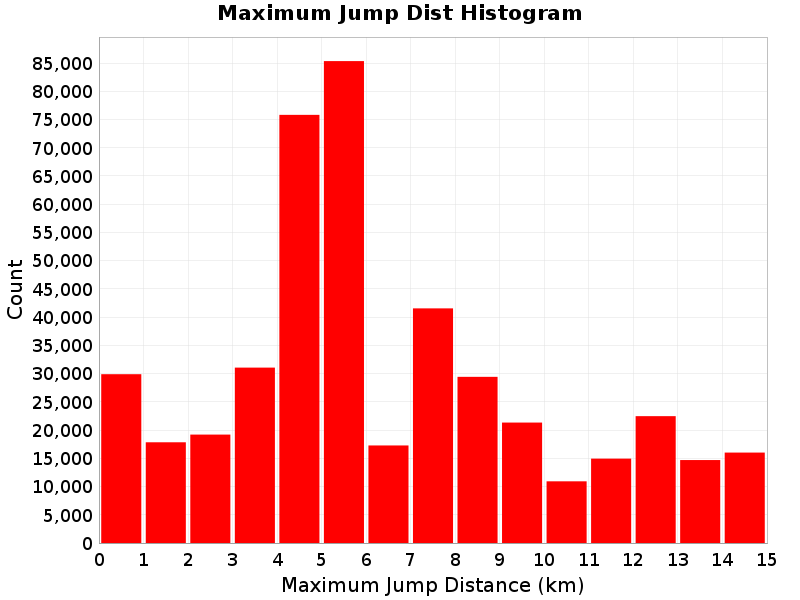
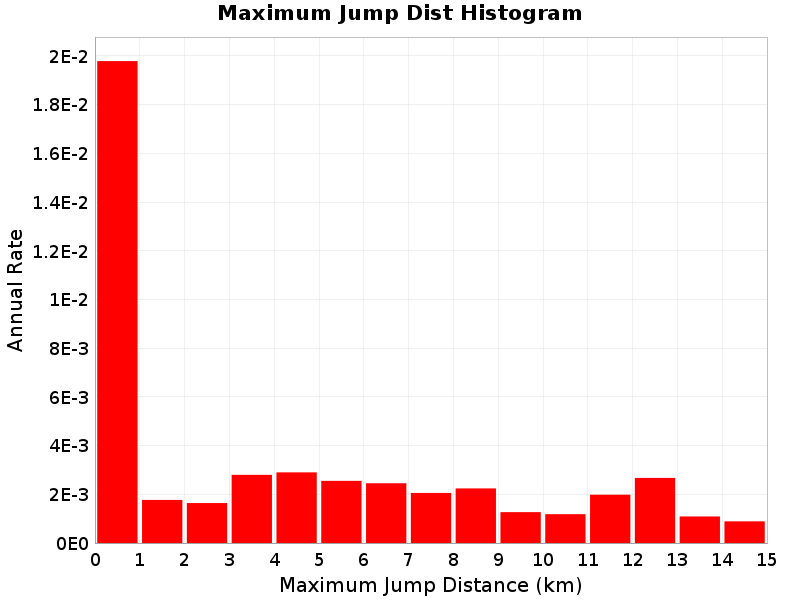
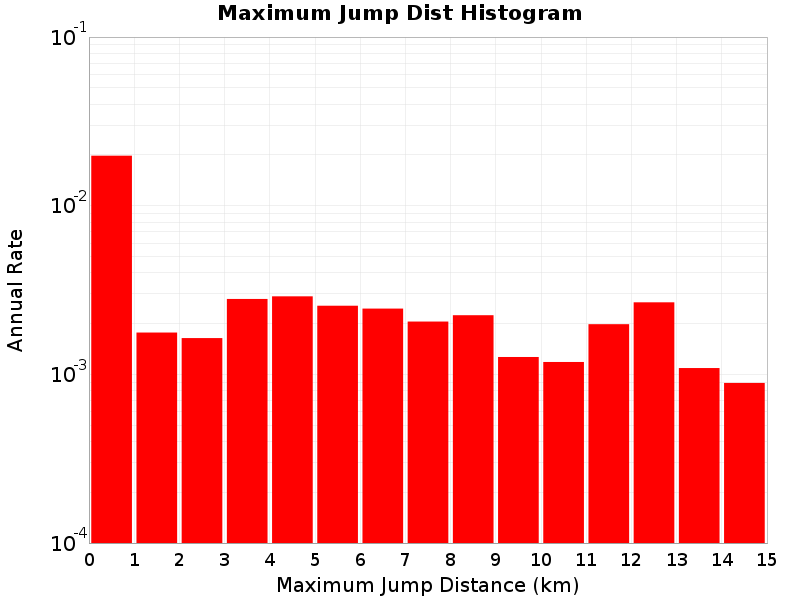
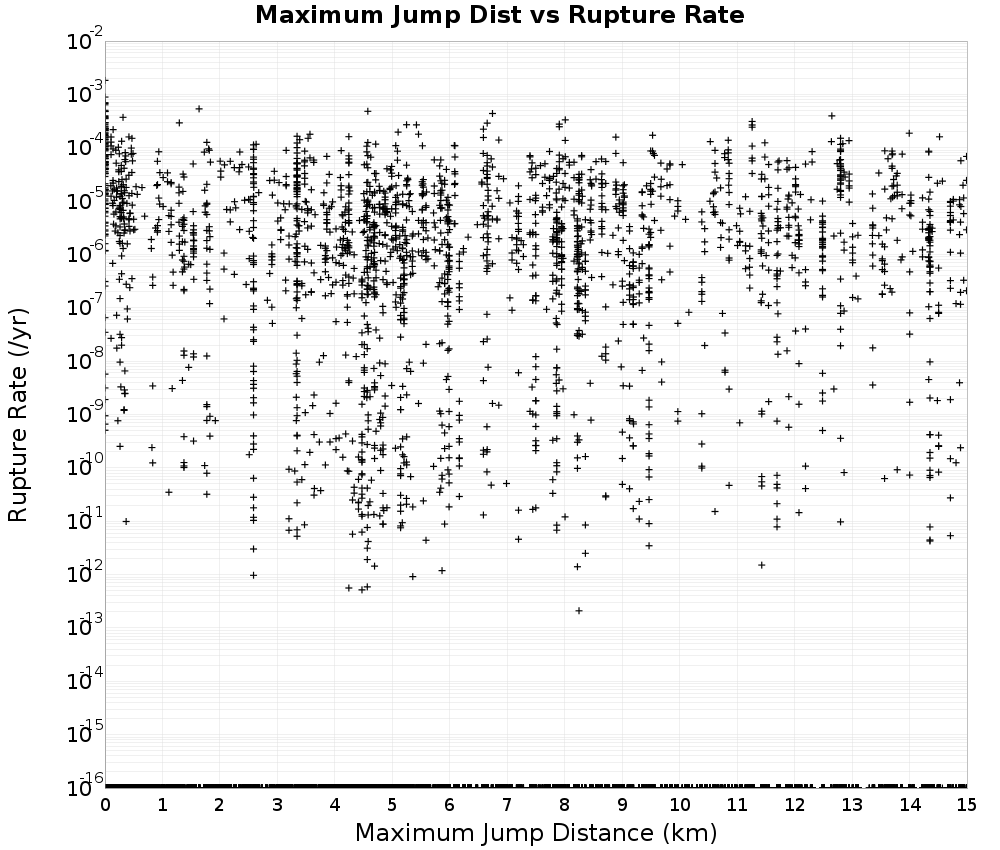
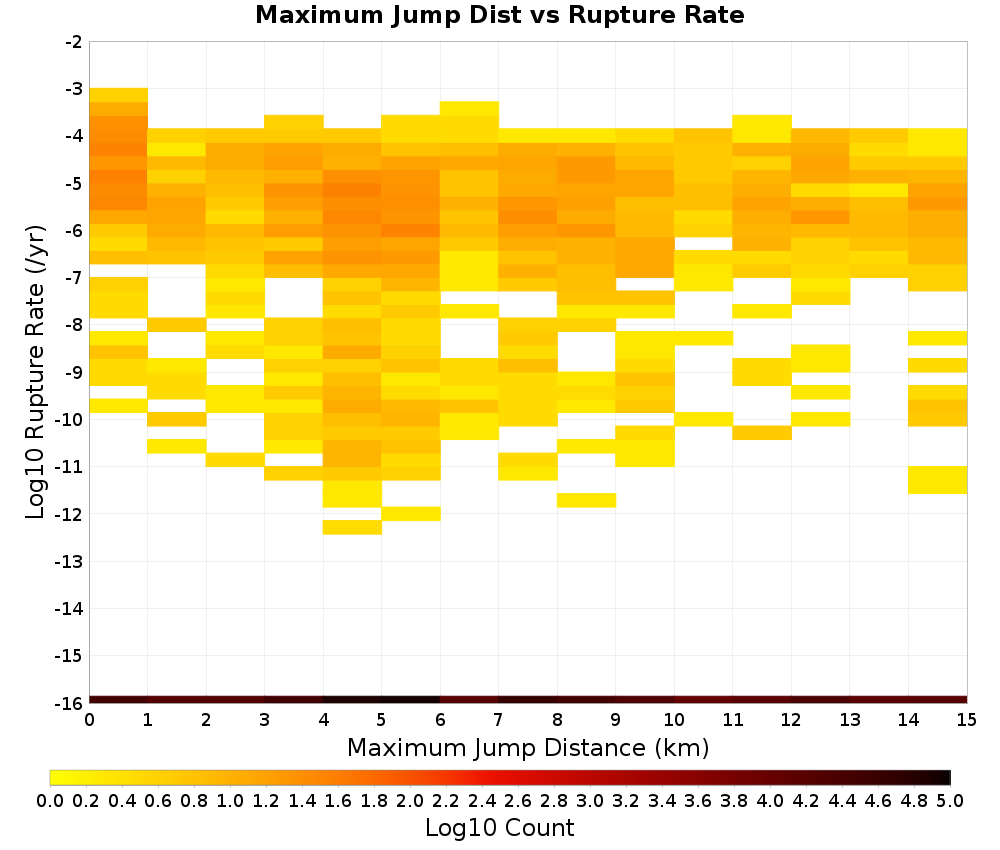
Maximum Jump Dist
The maximum jump distance in the rupture.
 |
|---|
 |
 |
 |
Maximum Jump Dist vs Rupture Rate
 |  |
|---|
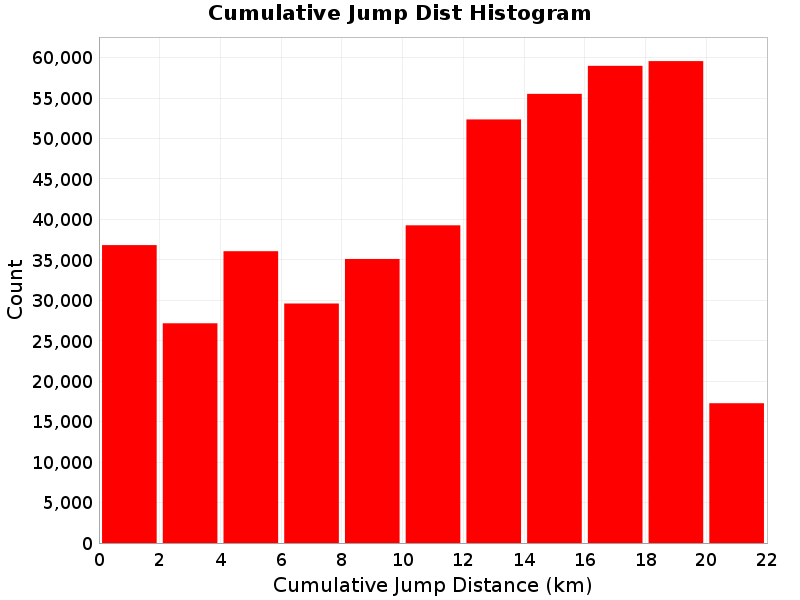
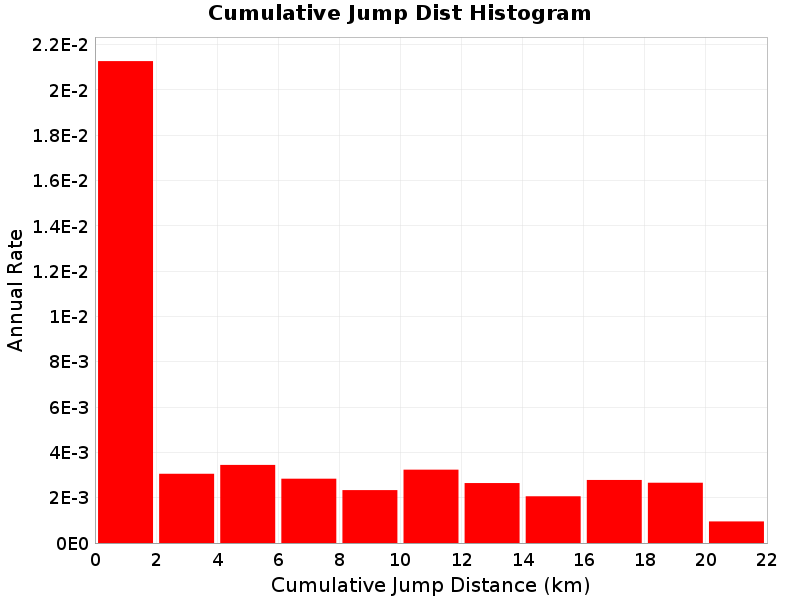
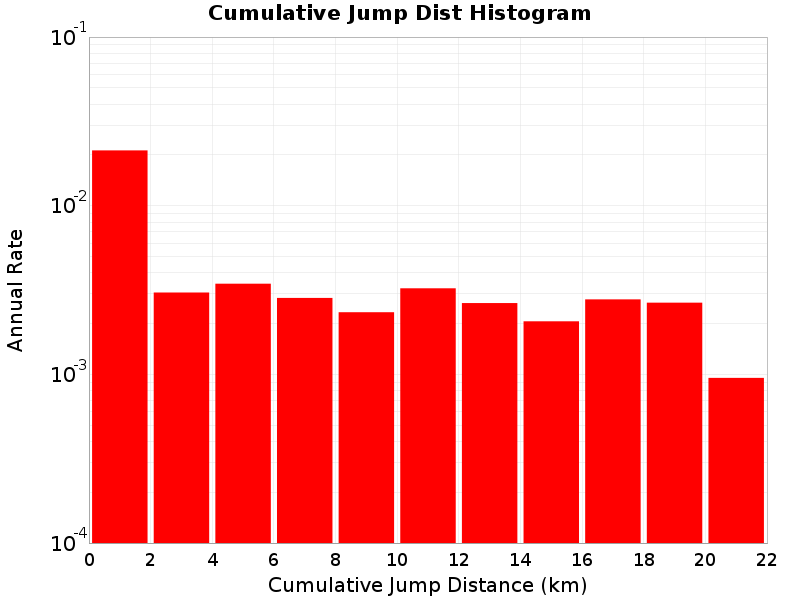
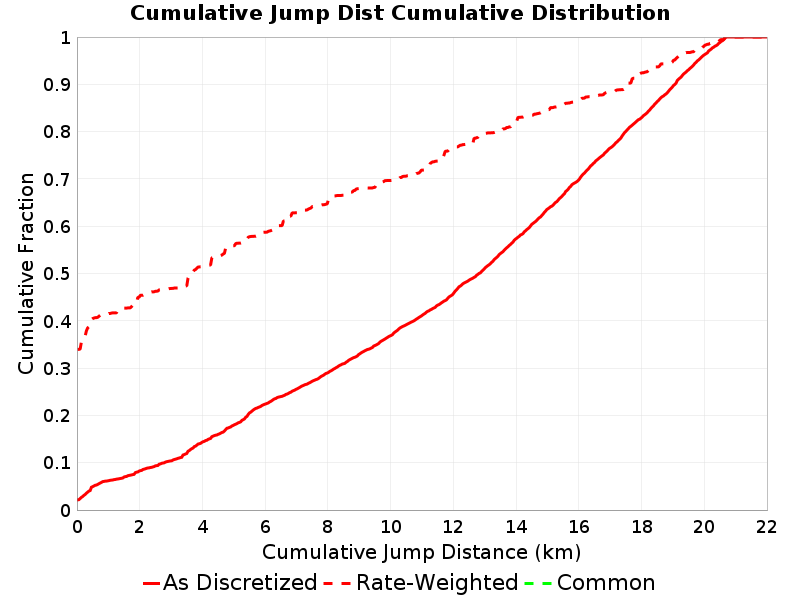
Cumulative Jump Dist
The total cumulative jump distance summed over all jumps in the rupture.
 |
|---|
 |
 |
 |
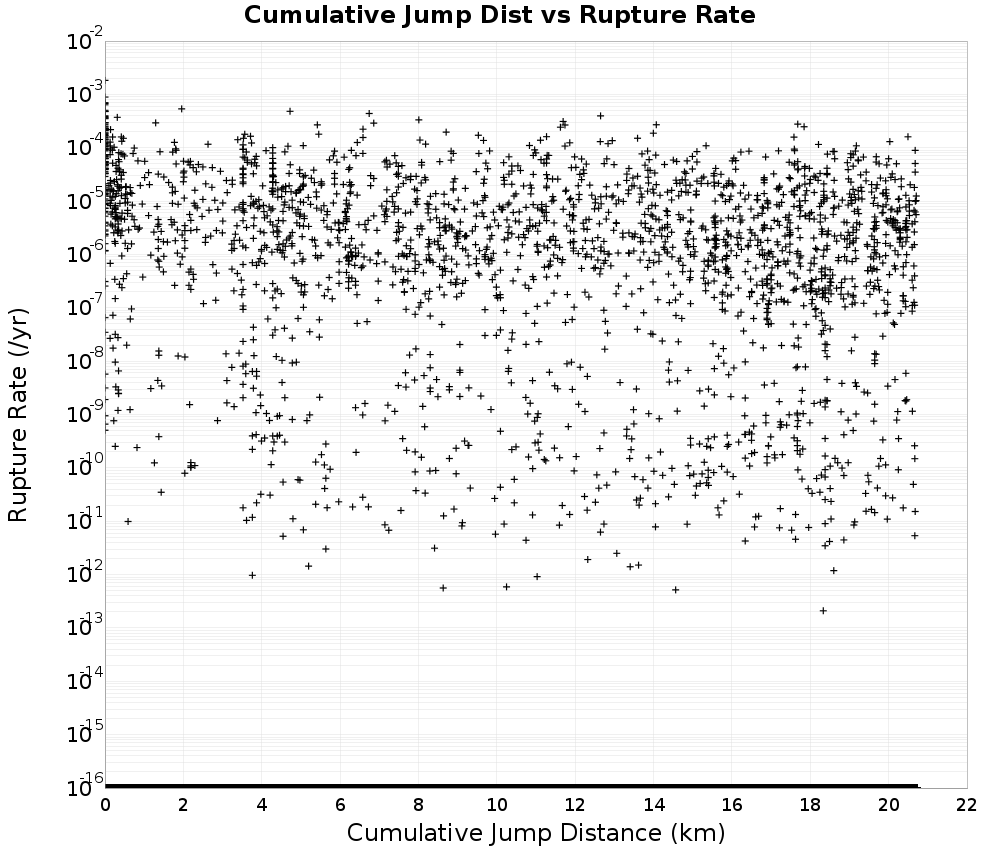
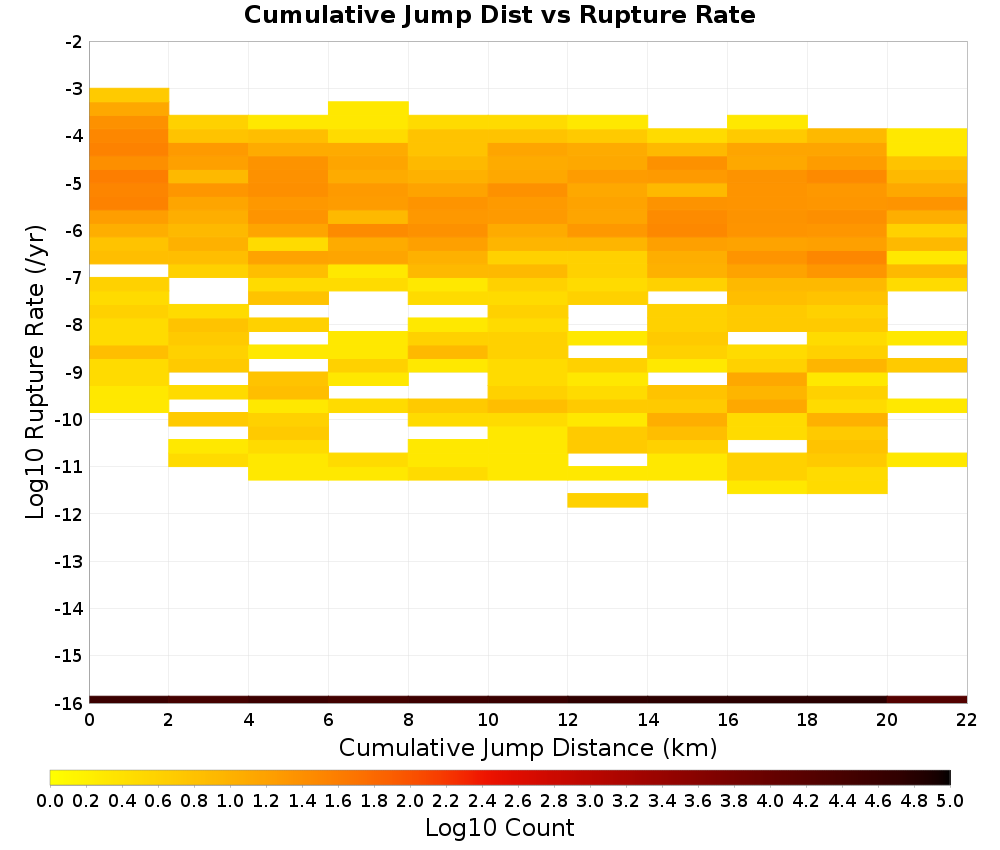
Cumulative Jump Dist vs Rupture Rate
 |  |
|---|
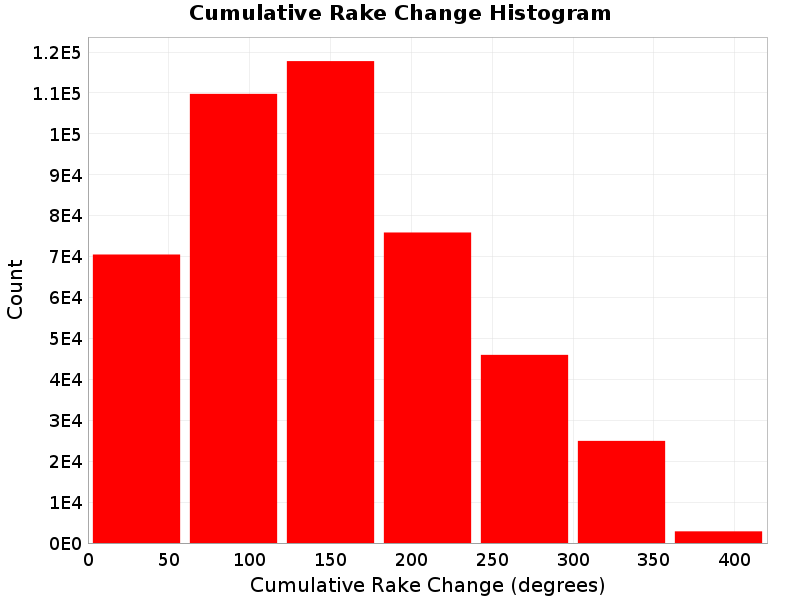
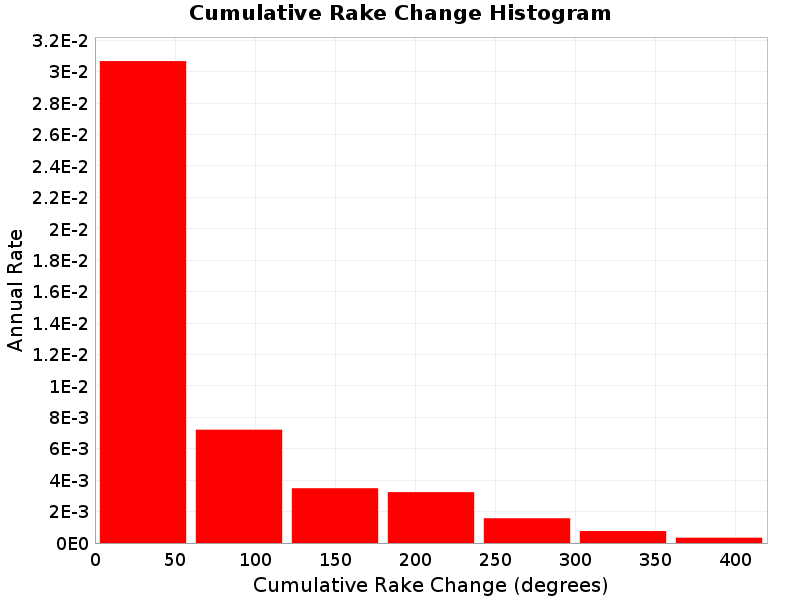
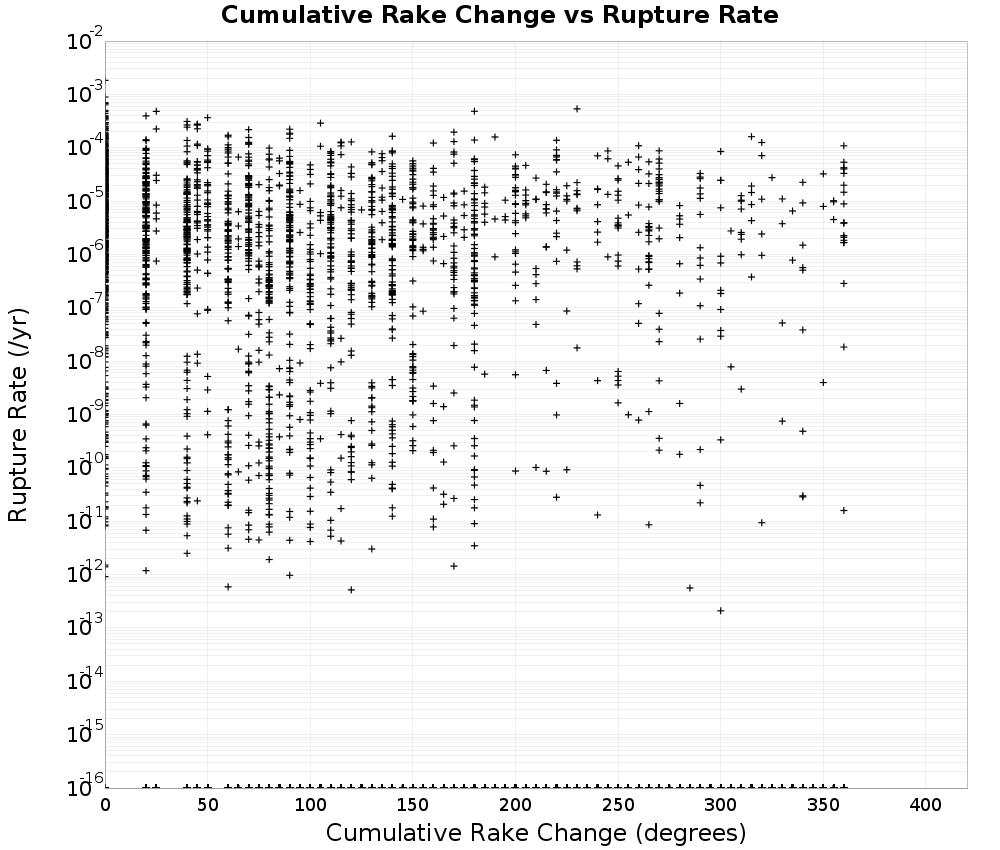
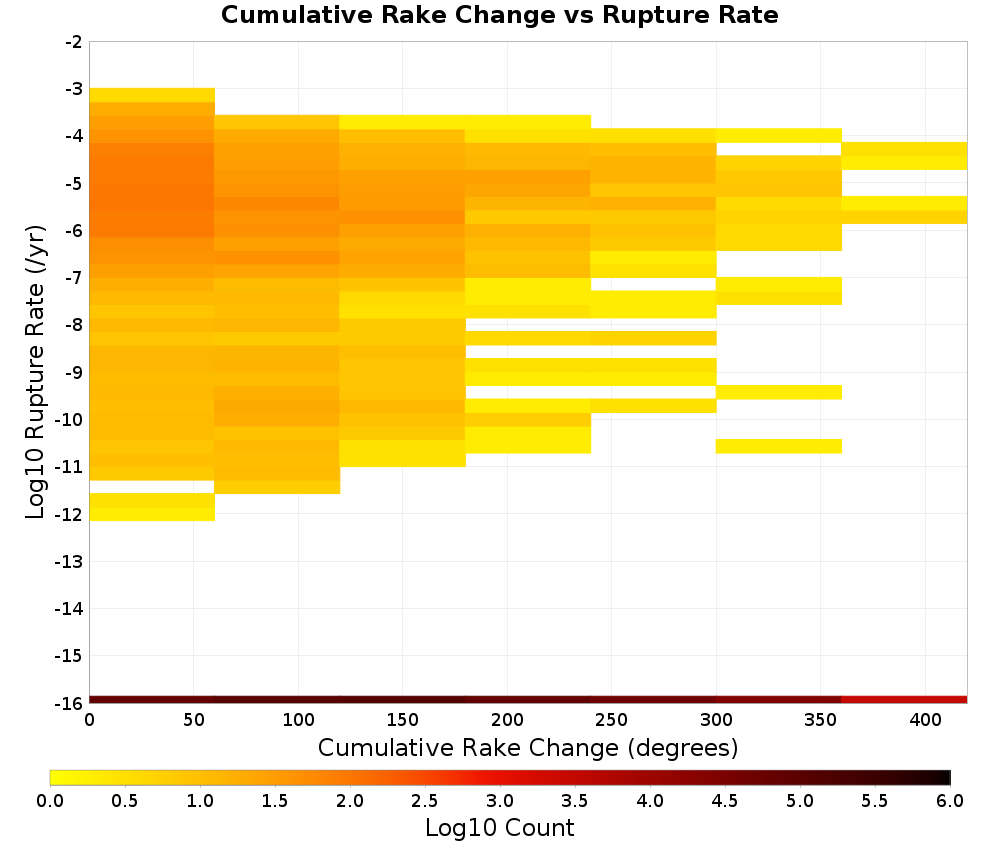
Cumulative Rake Change
Cumulative rake change for this rupture.
 |
|---|
 |
 |
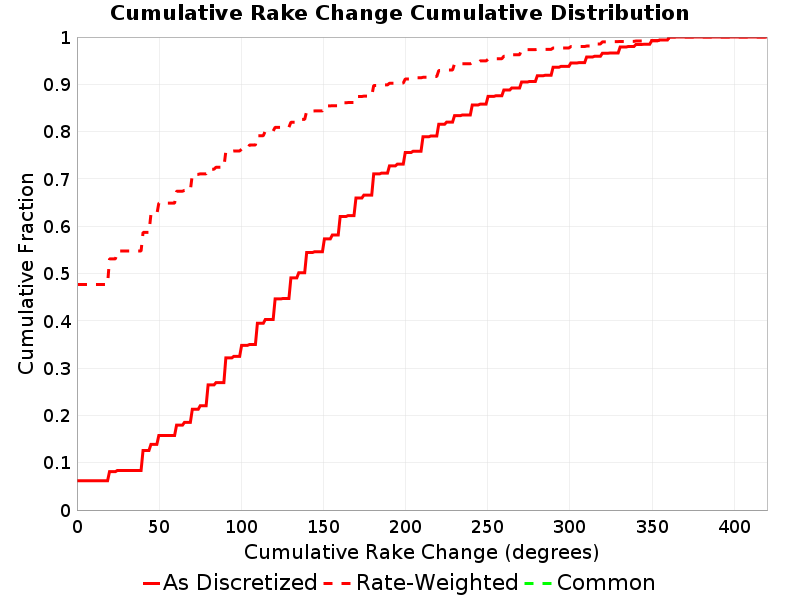 |
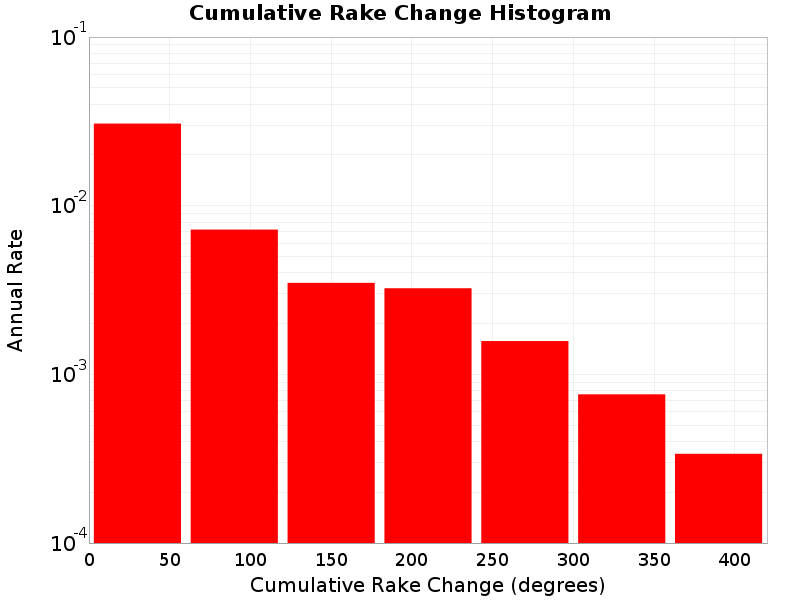
Cumulative Rake Change vs Rupture Rate
 |  |
|---|
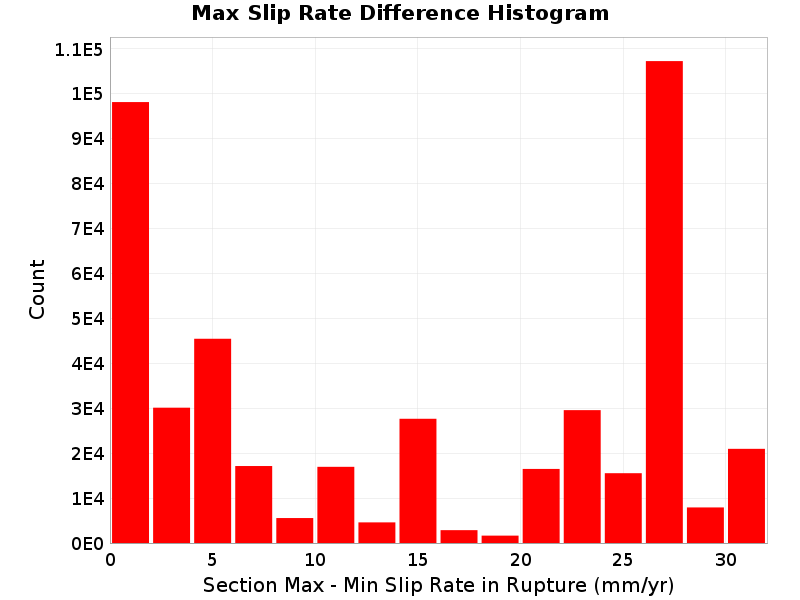
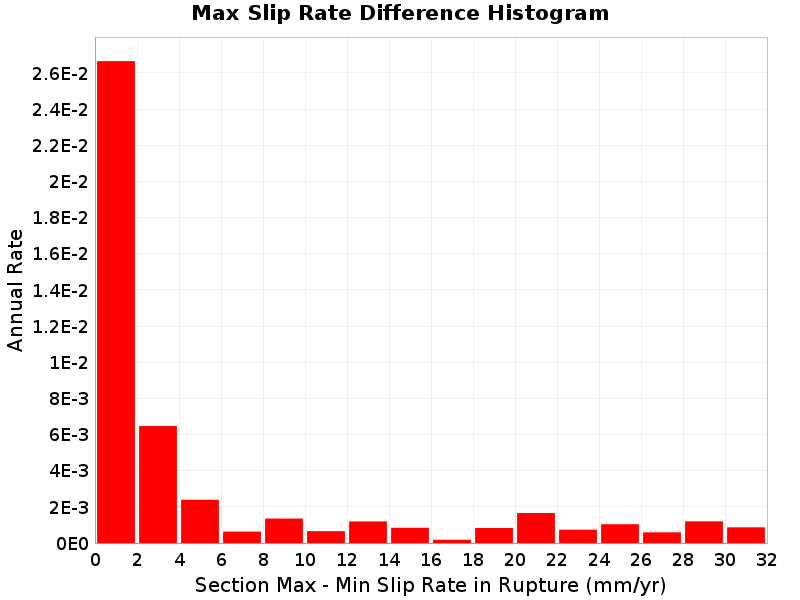
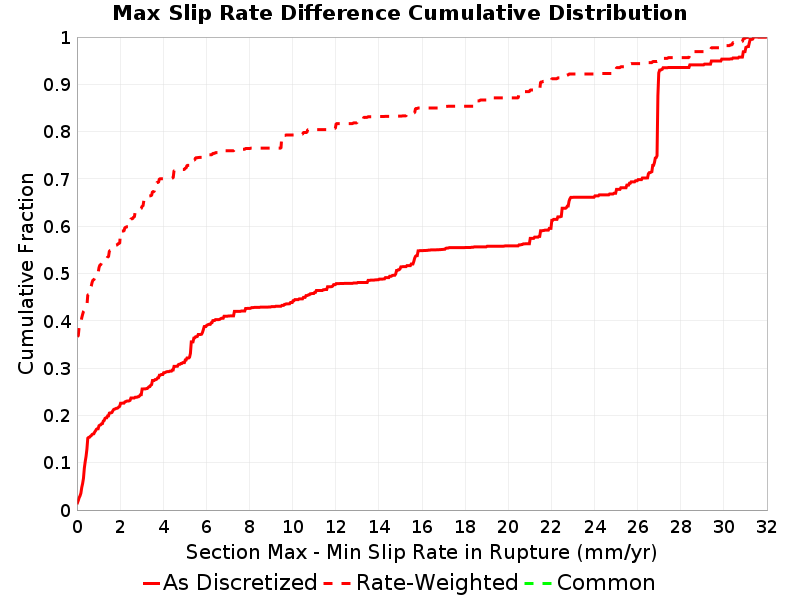
Max Slip Rate Difference
The difference between the slip rate of the sections with the highest and lowest slip rate in the rupture.
 |
|---|
 |
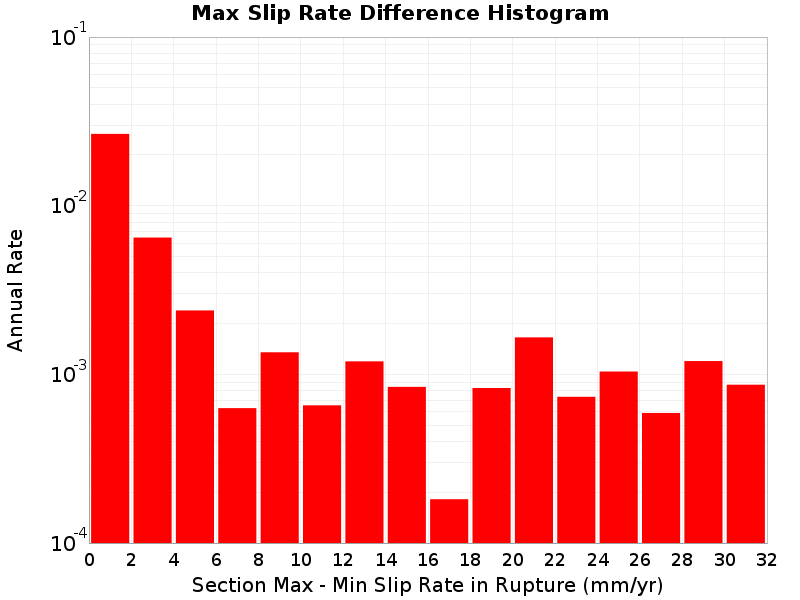 |
 |
Max Slip Rate Difference vs Rupture Rate
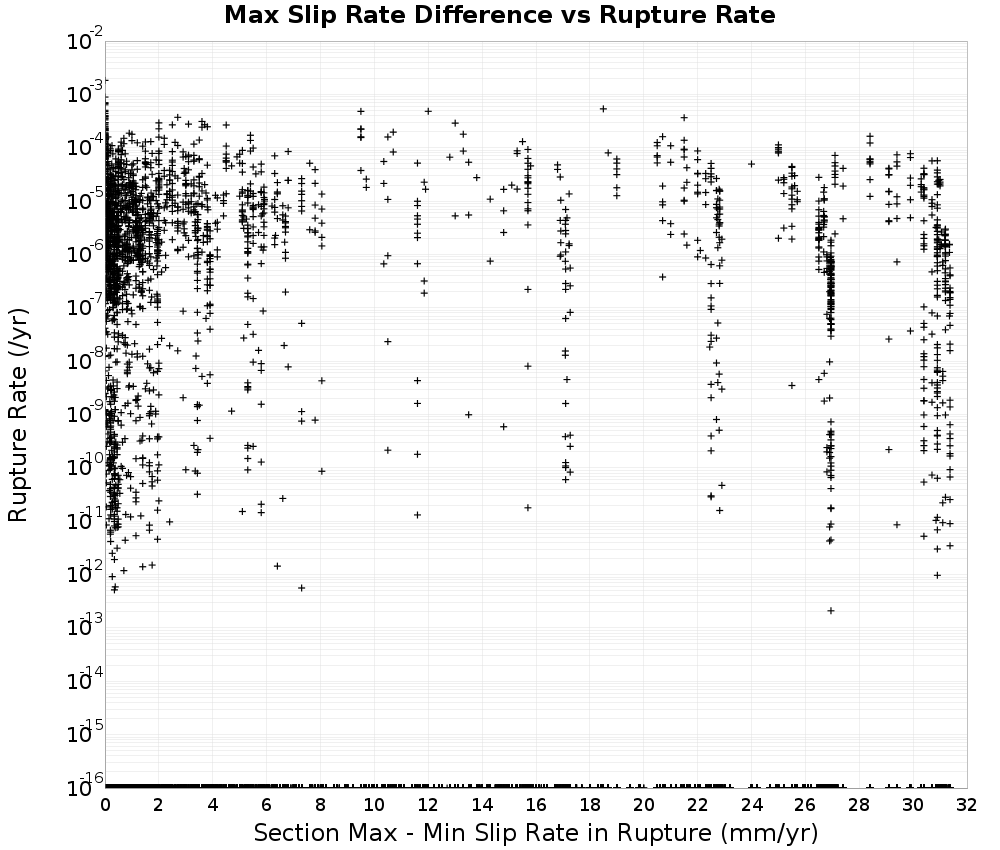 | 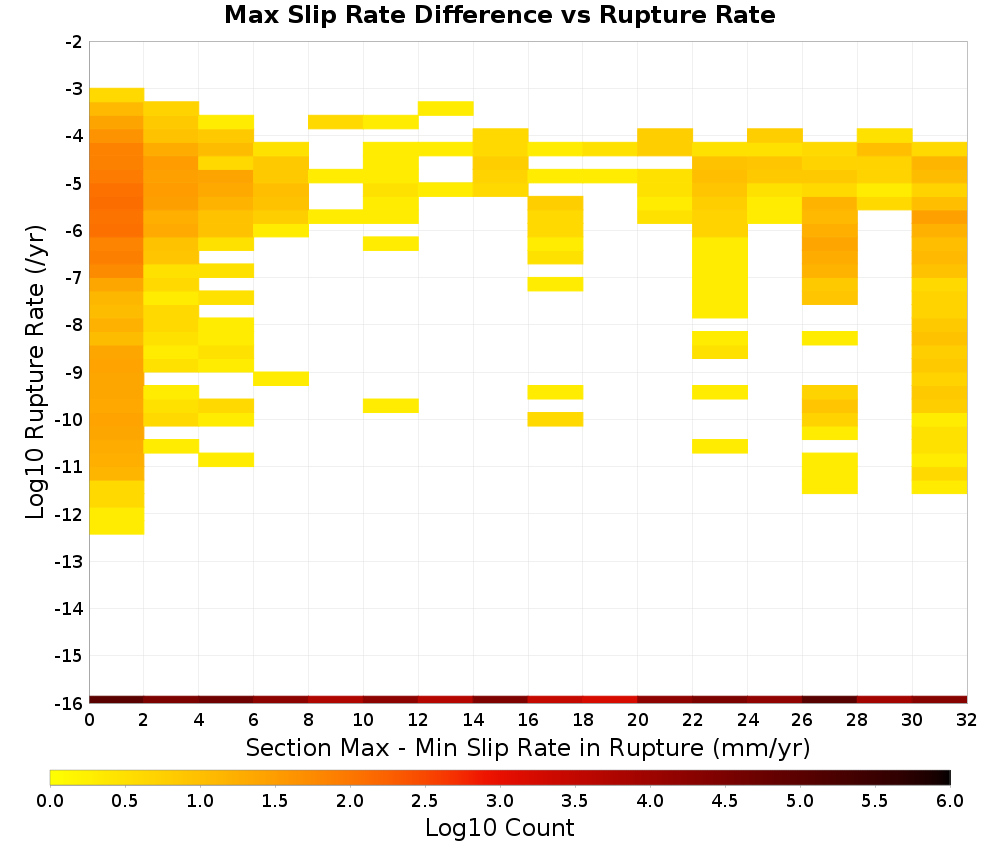 |
|---|
Attached Modules
List of all modules that have been attached to this Solution.
Note: Modules classes in the standard modules package, org.opensha.sha.earthquake.faultSysSolution.modules, have been shortened to omit the package name.
Rupture Set Modules
| Name | Implementing Class |
|---|---|
| Single-Strand Cluster Ruptures | ClusterRuptures$SingleStranded |
| Plausibility Configuration | org.opensha.sha.earthquake.faultSysSolution.ruptures.plausibility.PlausibilityConfiguration |
| Logic Tree Branch | nz.cri.gns.NZSHM22.opensha.enumTreeBranches.NZSHM22_LogicTreeBranch |
| Polygon Fault Grid Associations | PolygonFaultGridAssociations$Precomputed |
| Section Distance-Azimuth Calculator | org.opensha.sha.earthquake.faultSysSolution.ruptures.util.SectionDistanceAzimuthCalculator |
| Rupture Connection Search | org.opensha.sha.earthquake.faultSysSolution.ruptures.util.RuptureConnectionSearch |
| Section Slip Rates | SectSlipRates$Precomputed |
| Section Areas | SectAreas$Precomputed |
| Info | InfoModule |
| Inversion Target MFDs | InversionTargetMFDs$Precomputed |
| Rupture Average Slips | AveSlipModule$Precomputed |
| Modified Section Minimum Magnitudes | ModSectMinMags$Precomputed |
| Uniform Slip Along Rupture | SlipAlongRuptureModel$Uniform |
| OpenSHA Build Information | BuildInfoModule |
Solution Modules
| Name | Implementing Class |
|---|---|
| Annealing Progress | org.opensha.sha.earthquake.faultSysSolution.inversion.sa.completion.AnnealingProgress |
| OpenSHA Build Information | BuildInfoModule |
| Sub-Seismogenic On-Fault MFDs | SubSeismoOnFaultMFDs |
Fault Section Connections
 |
|---|
| Download GeoJSON |
 |
 |
 |
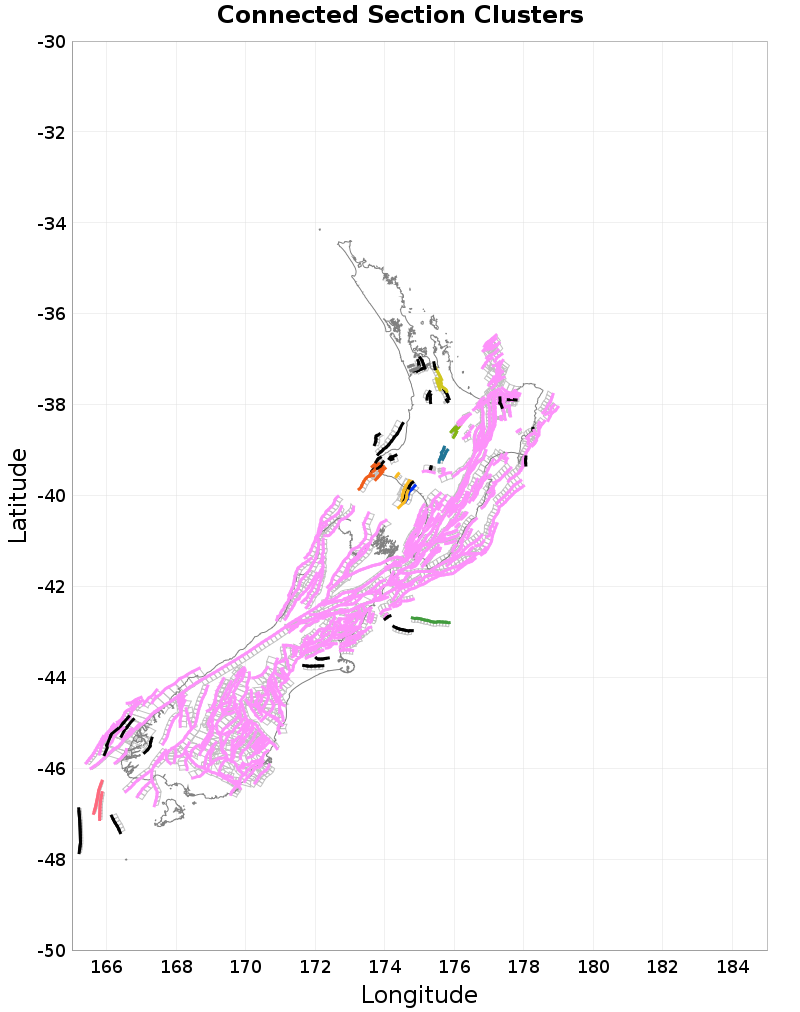
Connected Clusters
Connected clusters of fault sections, where all sections plotted in a given color connect with all other sections of the same color through ruptures. There may not be any single rupture that connects all such sections, but rather, chains of ruptures connect the sections. Only the first 10 clusters are plotted, with smaller clusters plotted in gray, and fully isolated faults plotted in black.
 |
|---|
| Download GeoJSON |
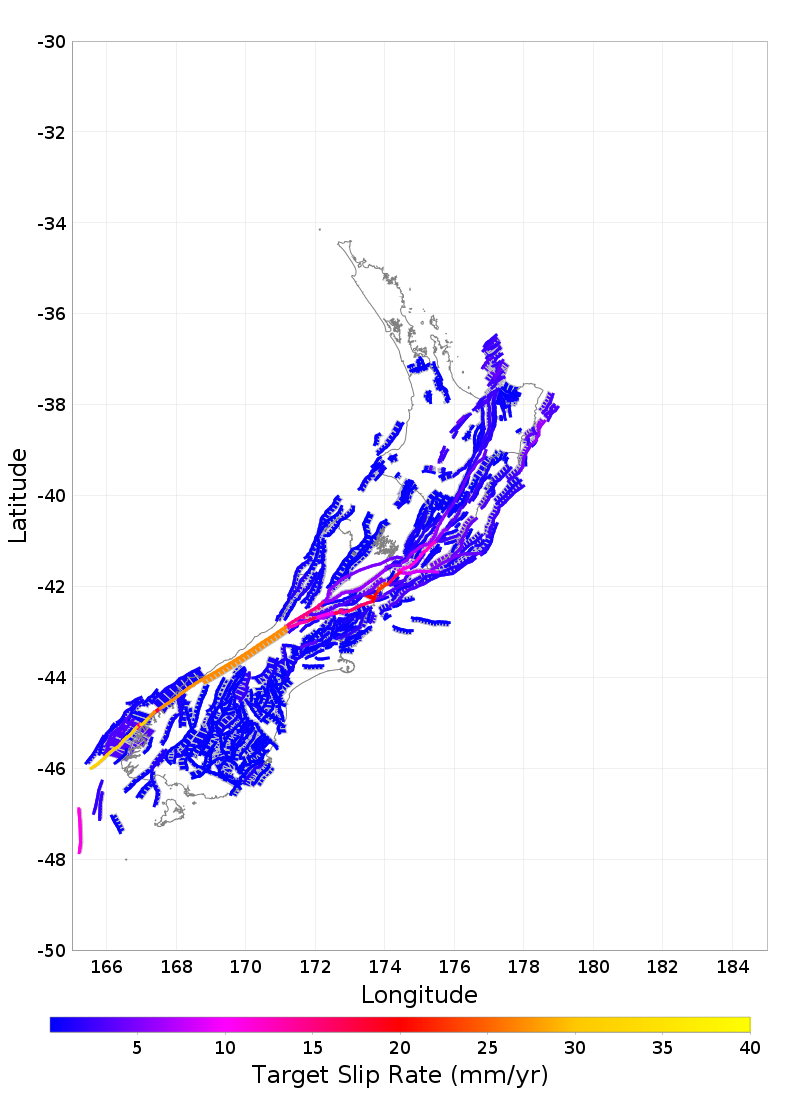
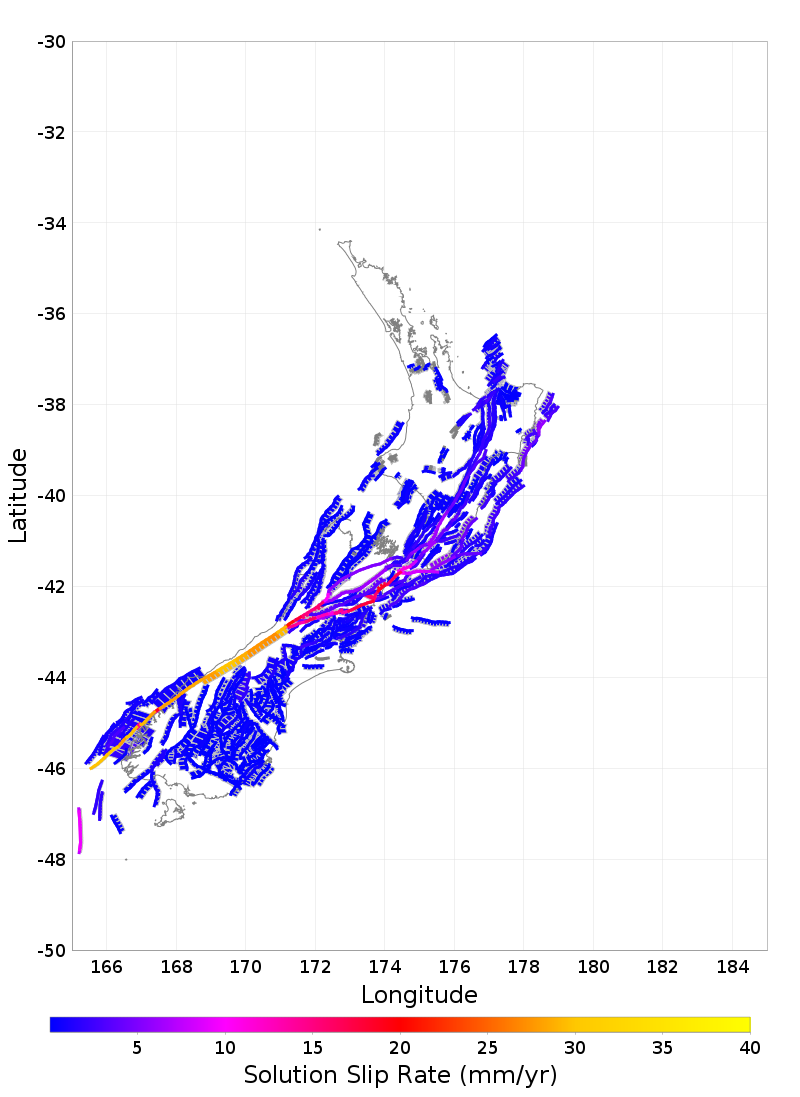
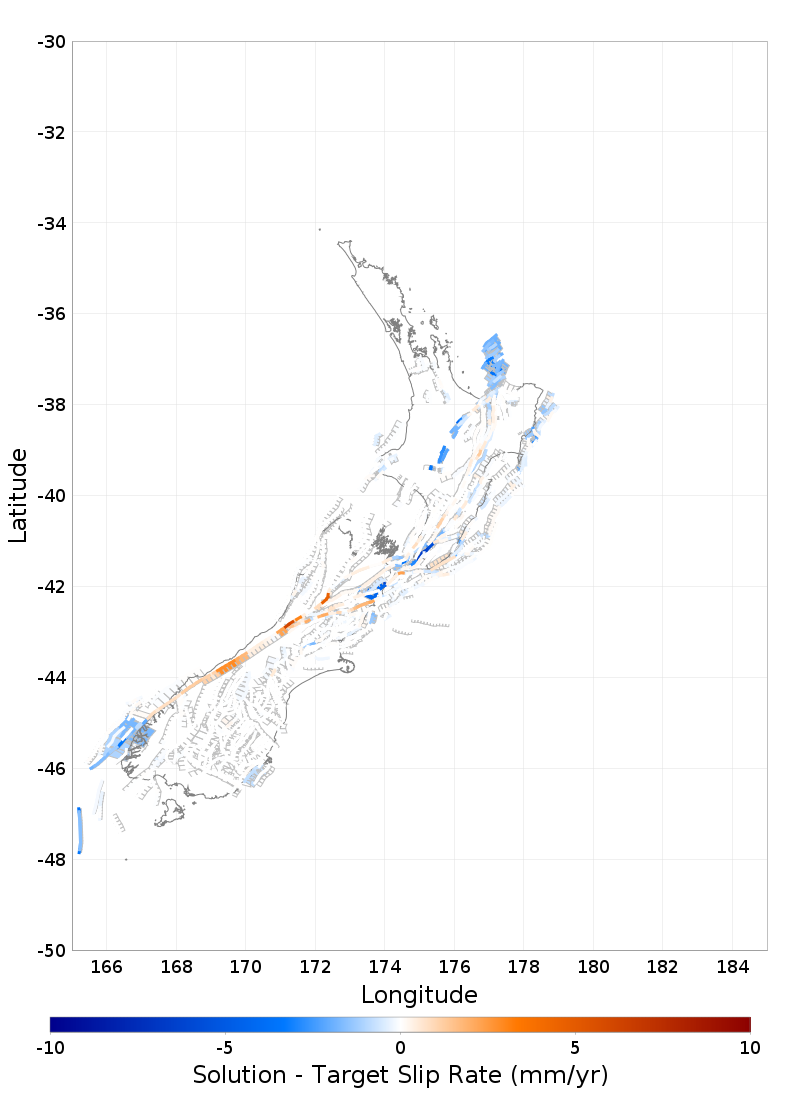
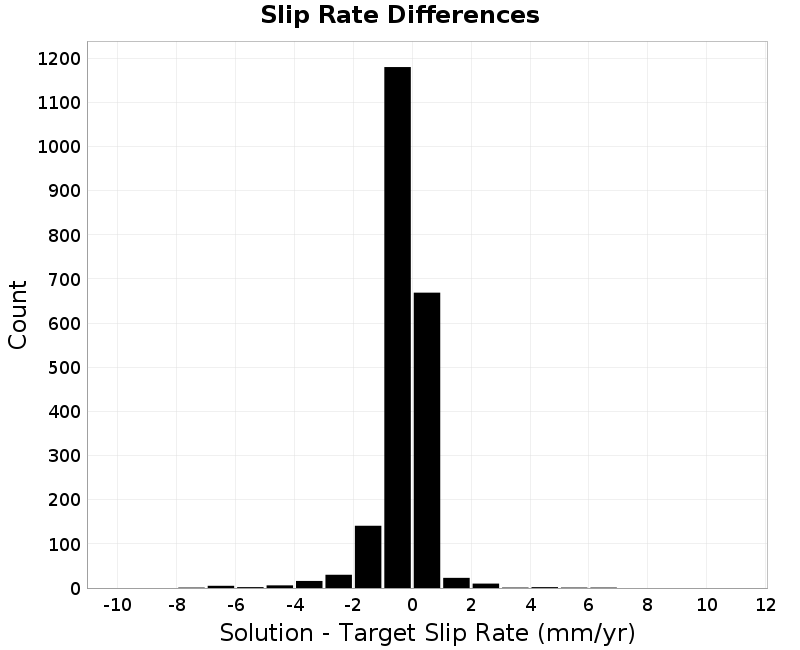
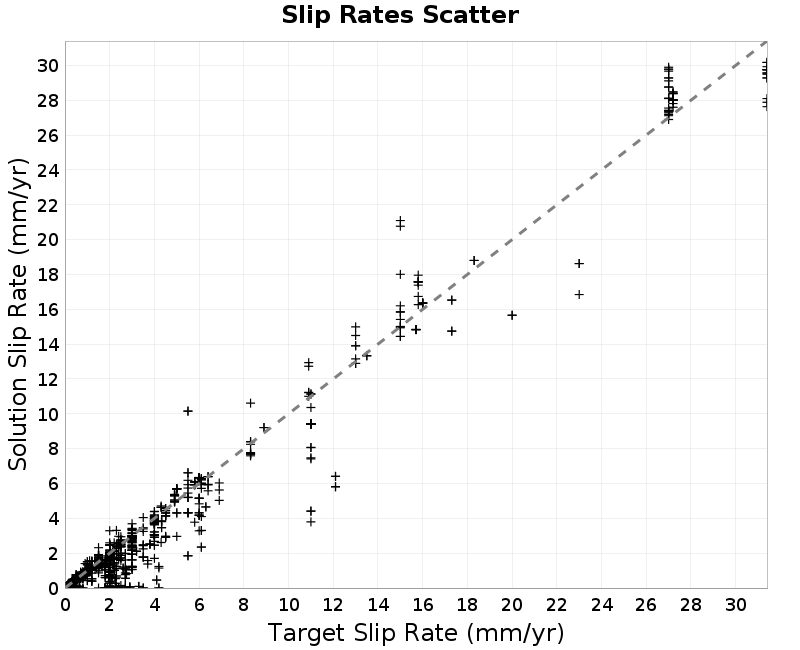
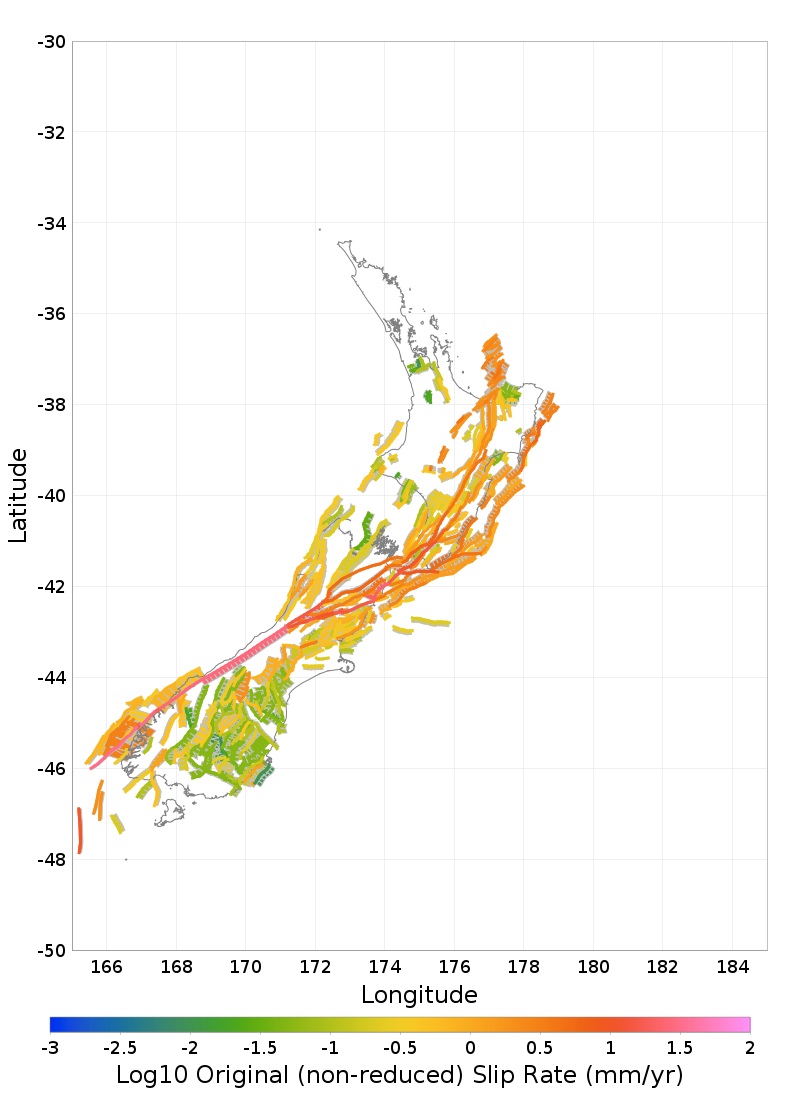
Slip Rates
Linear Slip Rate Plots
 |  |
|---|---|
| Download GeoJSON | Download GeoJSON |
 |  |
| Download GeoJSON | Download GeoJSON |
 |  |
| Download GeoJSON | Download GeoJSON |
 |  |
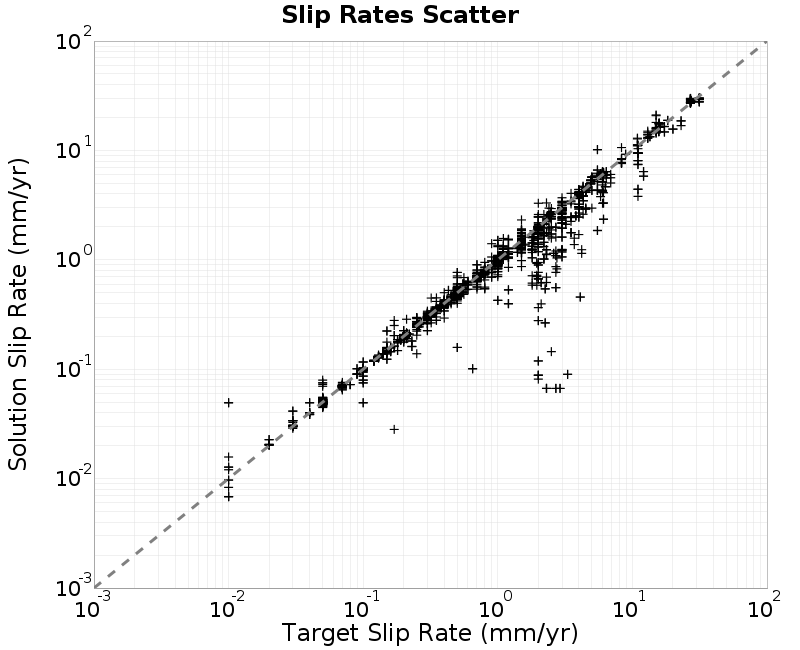
Log10 Slip Rate Plots
 |  |
|---|---|
| Download GeoJSON | Download GeoJSON |
 |  |
| Download GeoJSON | Download GeoJSON |
 |  |
| Download GeoJSON |
Slip Rate Std Dev Plots
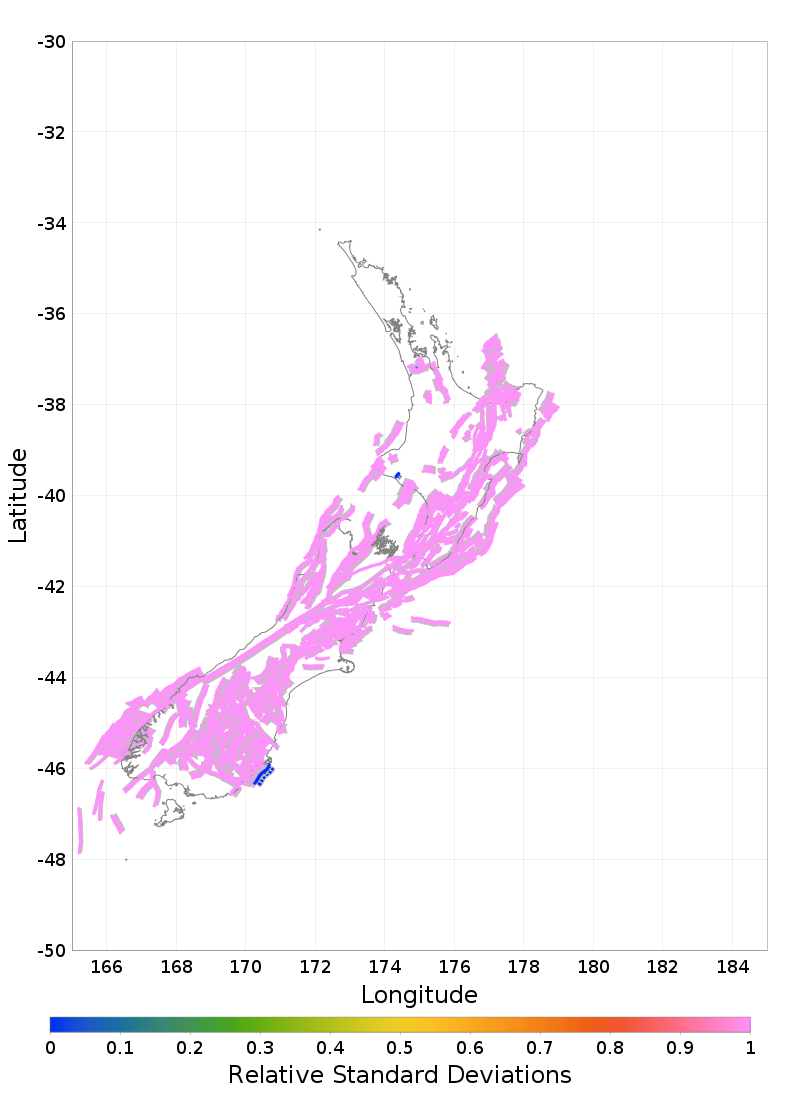 |  |
|---|---|
| Download GeoJSON | Download GeoJSON |
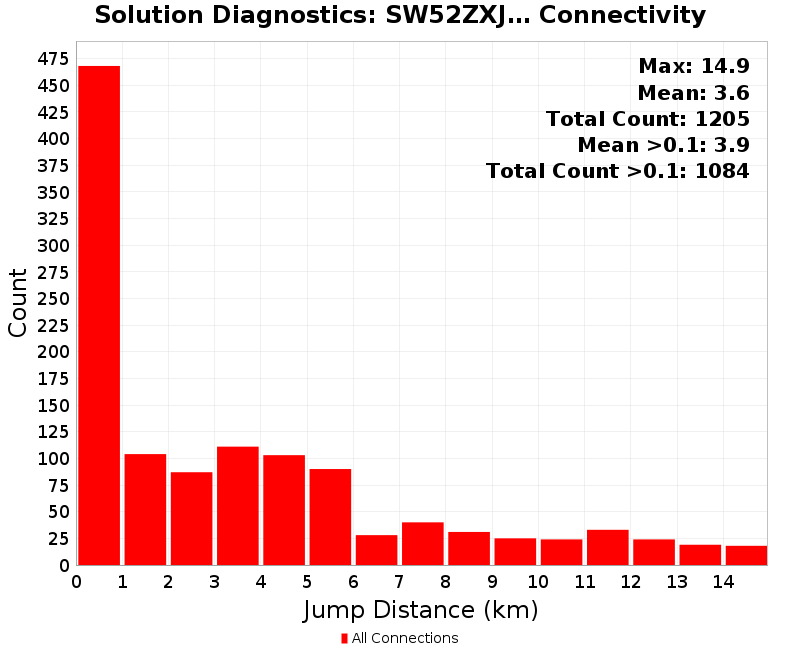
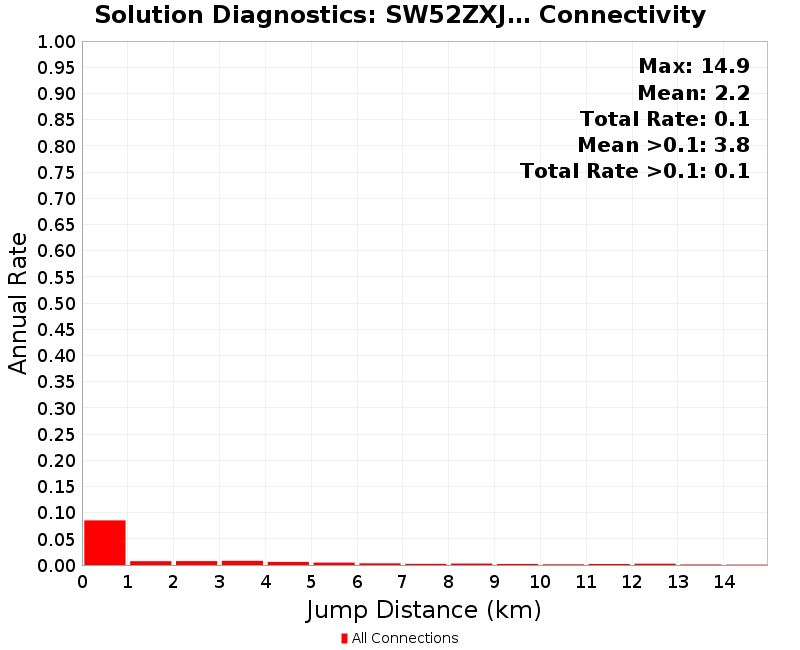
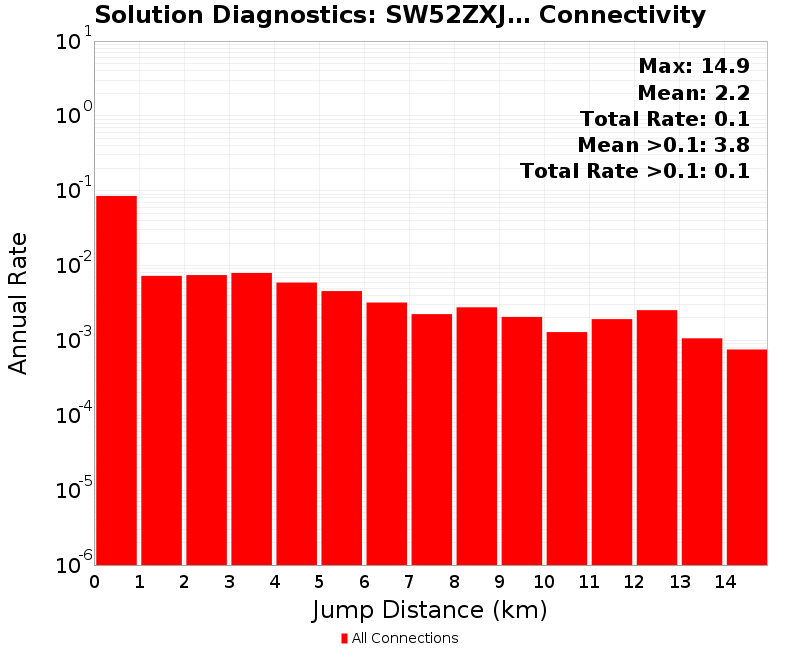
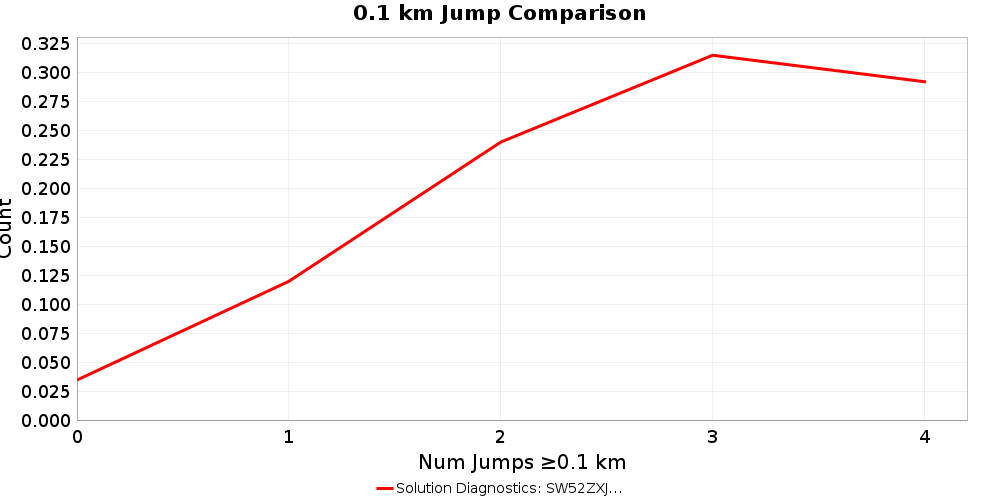
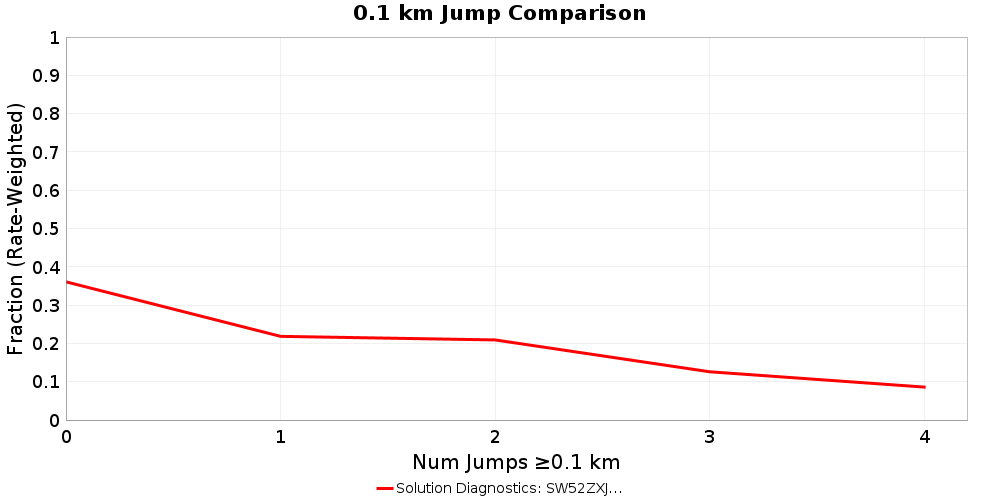
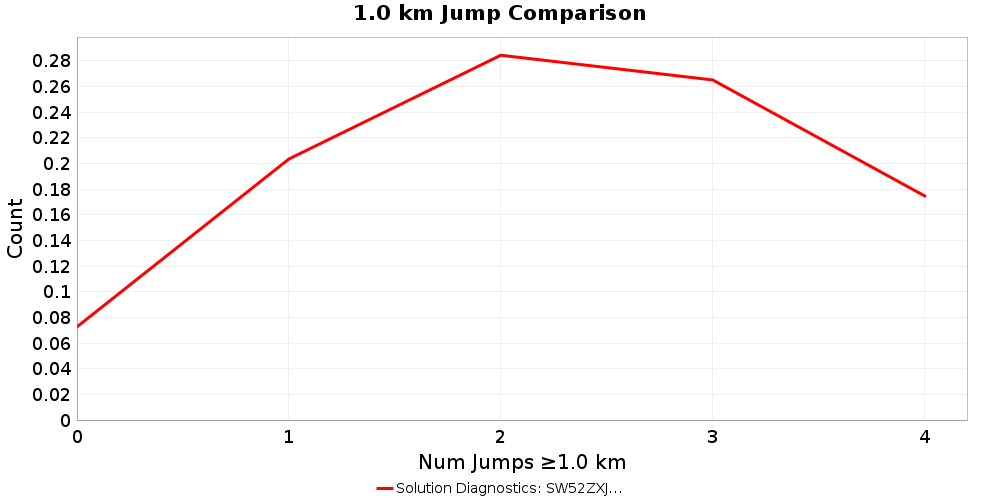
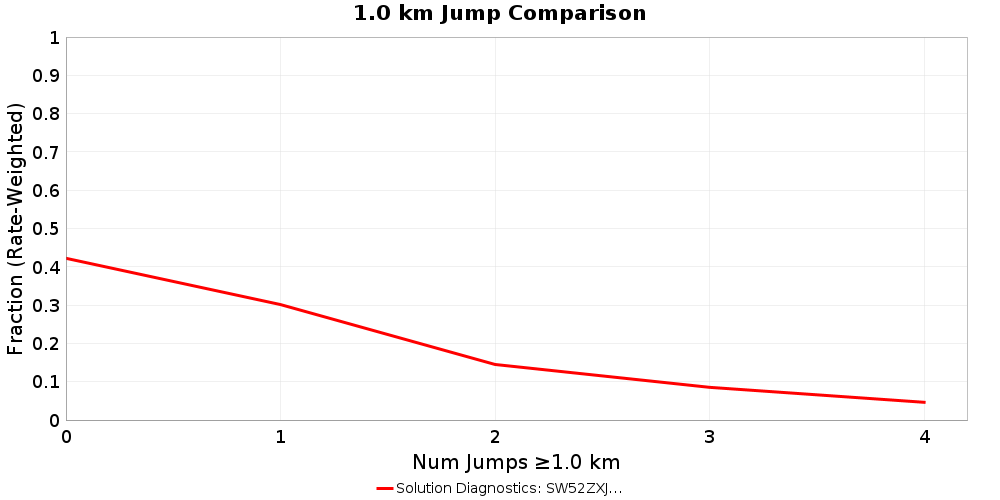
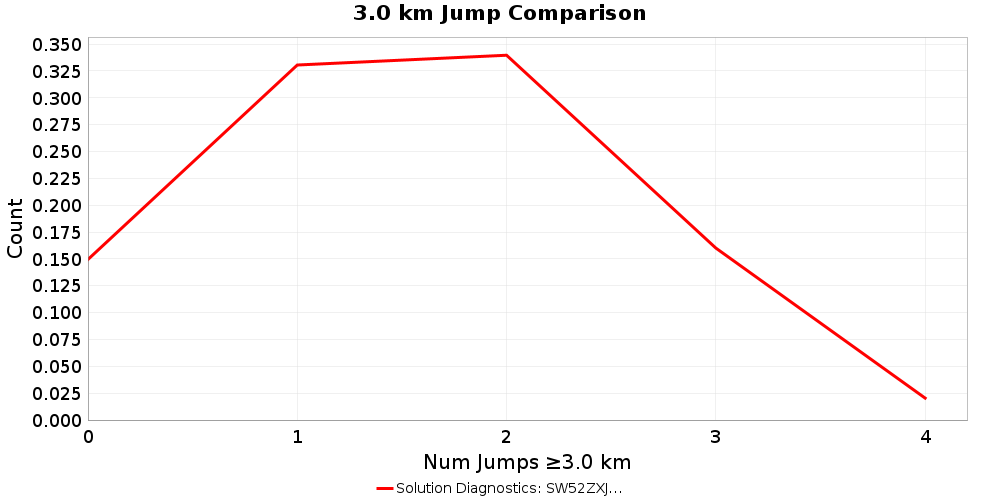
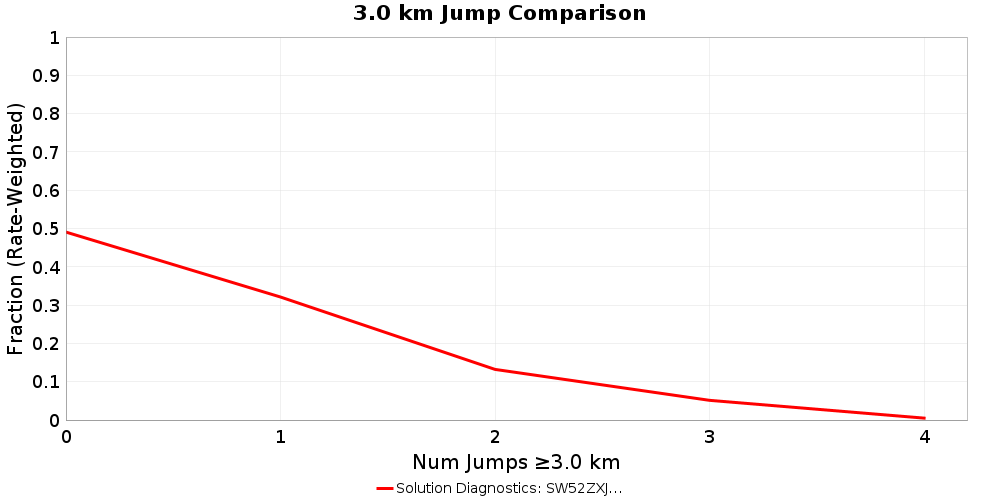
Jump Counts Over Distance
Supra-seismogenic Jump Counts
| As Discretized | Rate Weighted |
|---|---|
 |  |
 |  |
 |  |
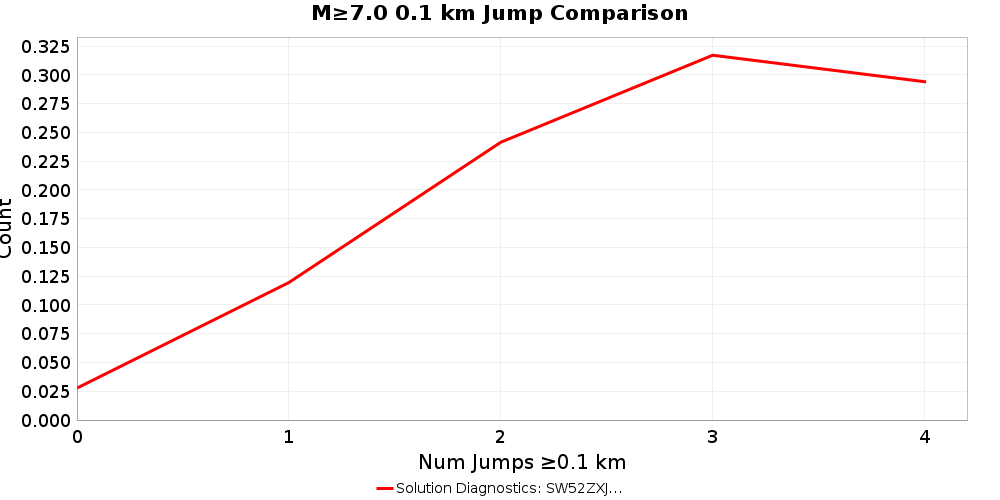
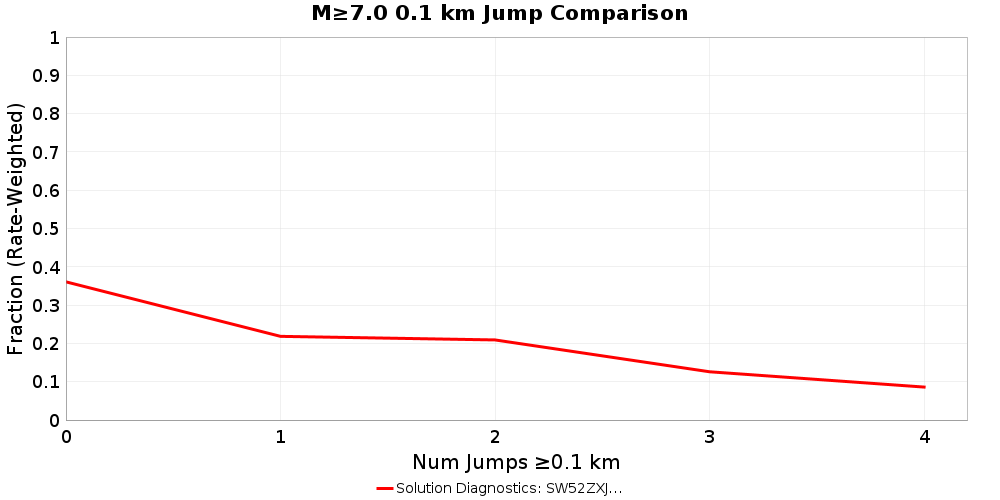
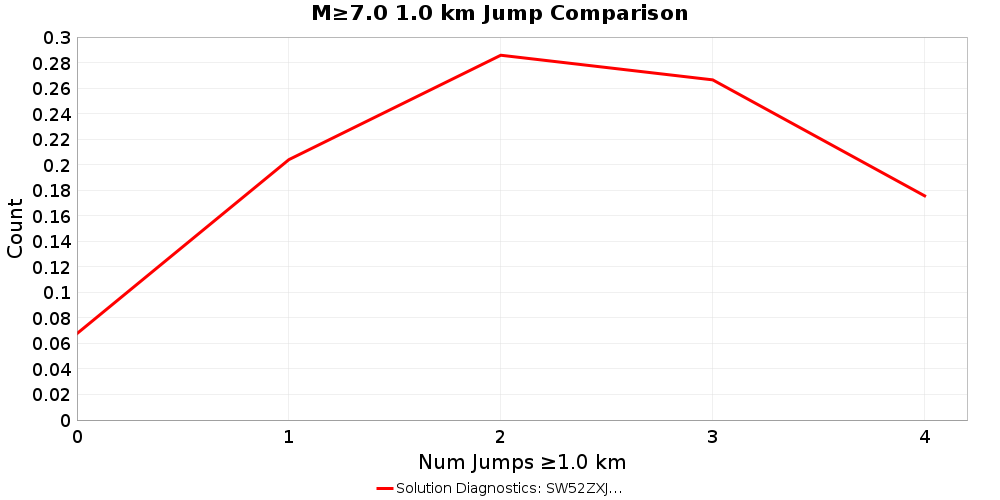
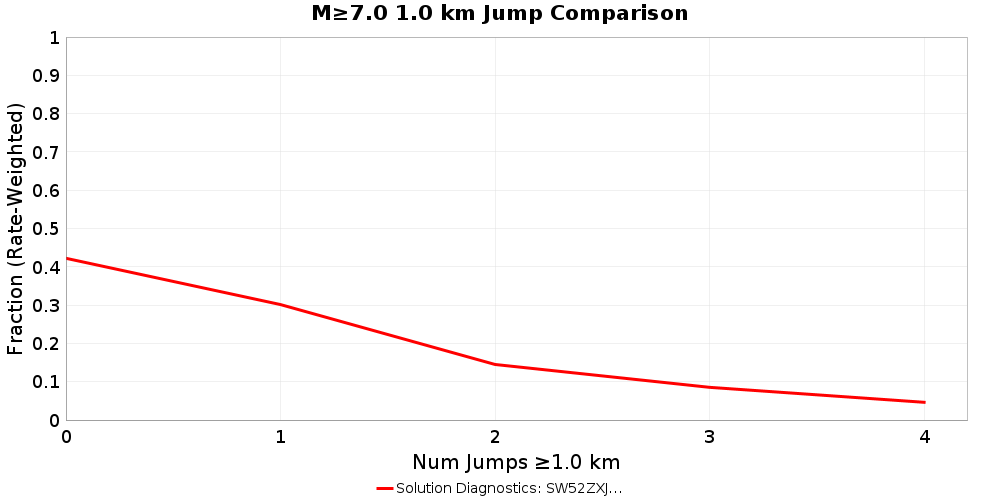
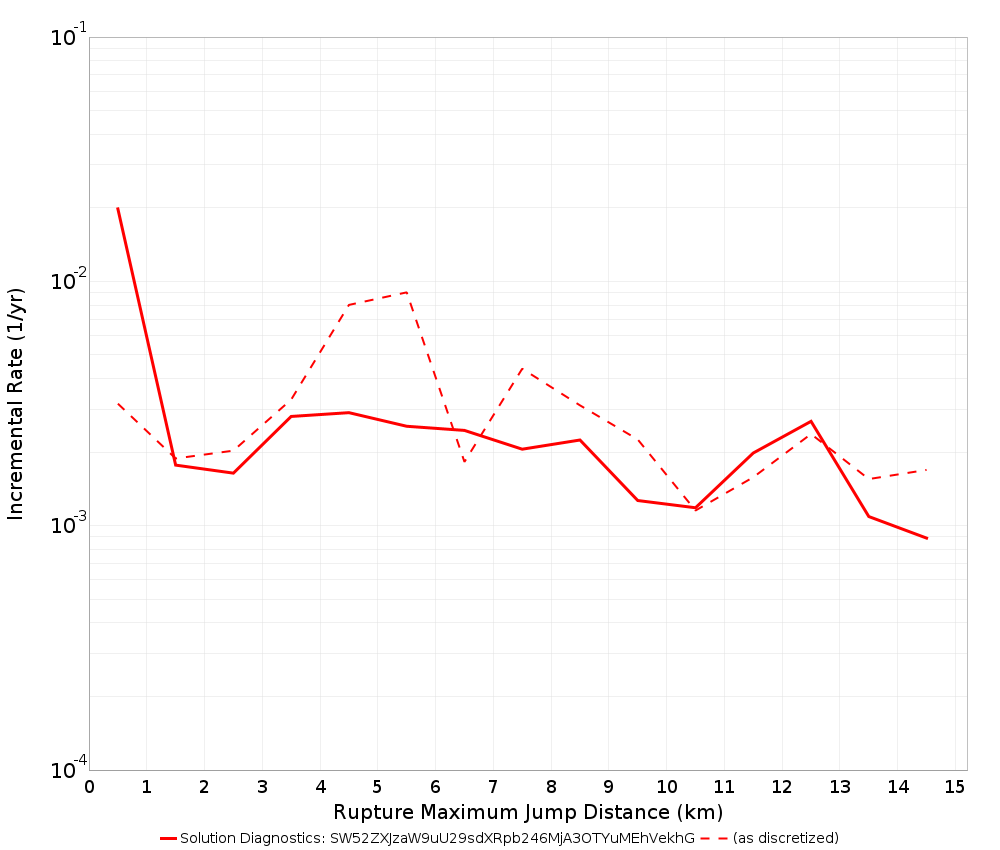
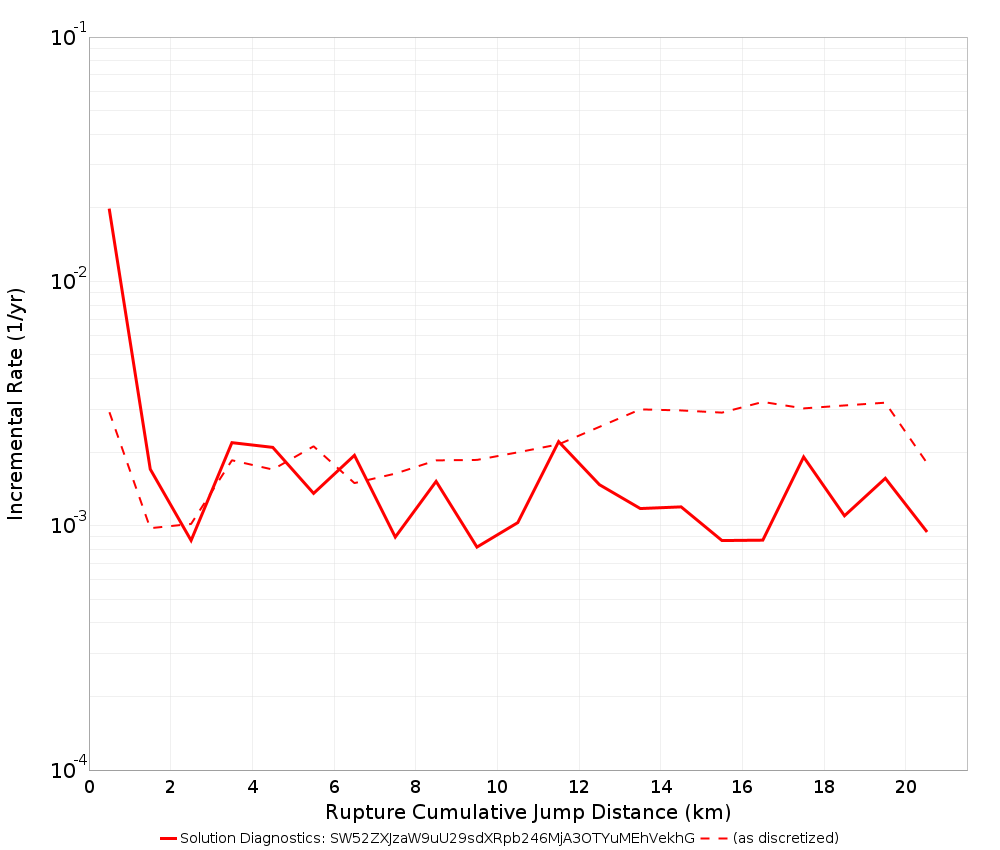
M≥7 Jump Counts
| As Discretized | Rate Weighted |
|---|---|
 |  |
 |  |
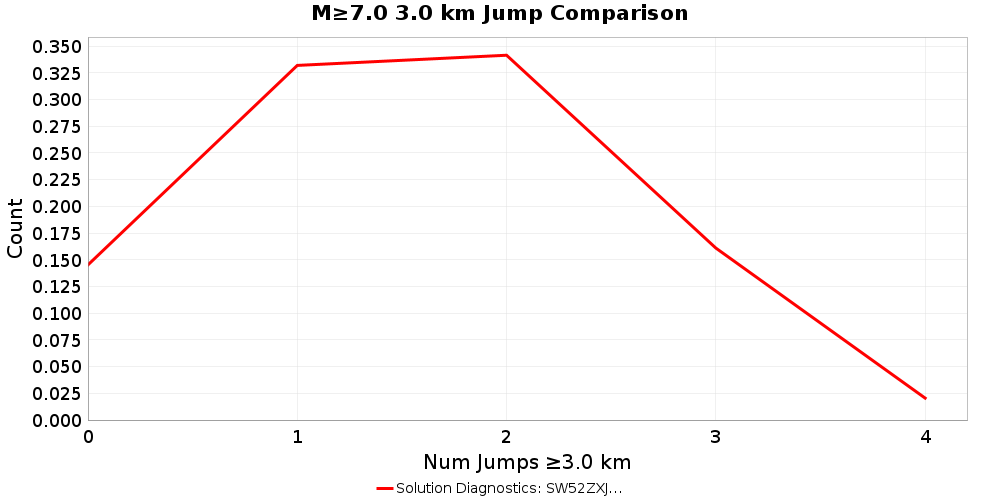 | 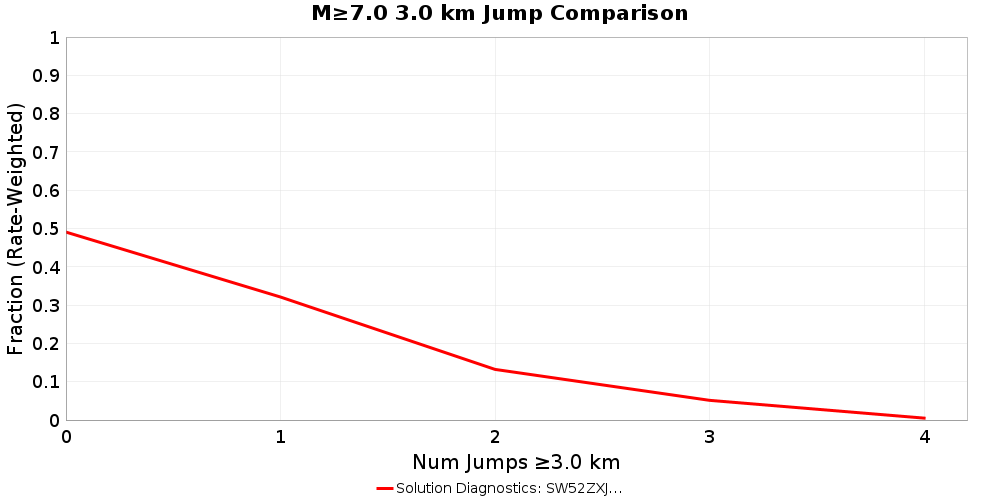 |
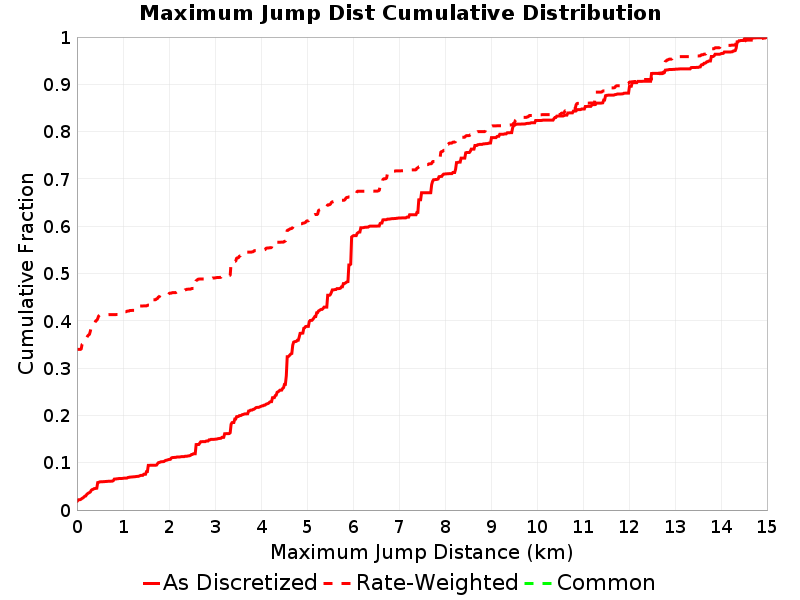
Max Jump Distance Distribution
Cumulative Jump Distance Distribution
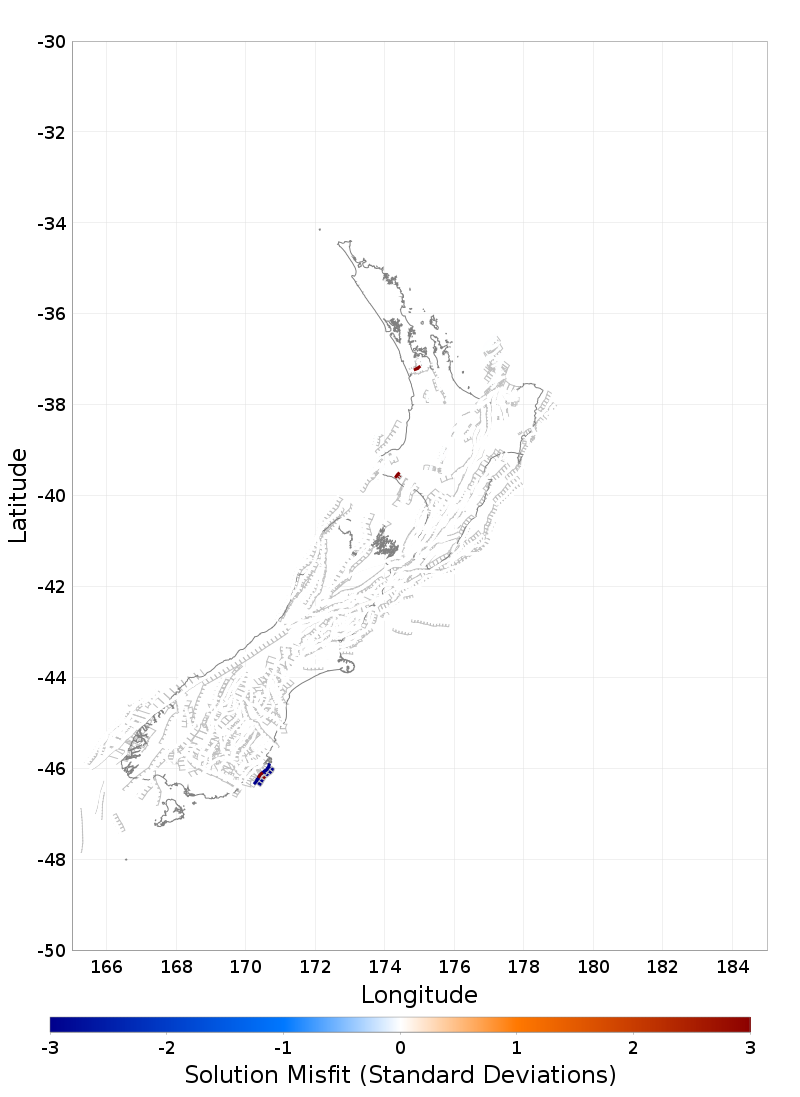
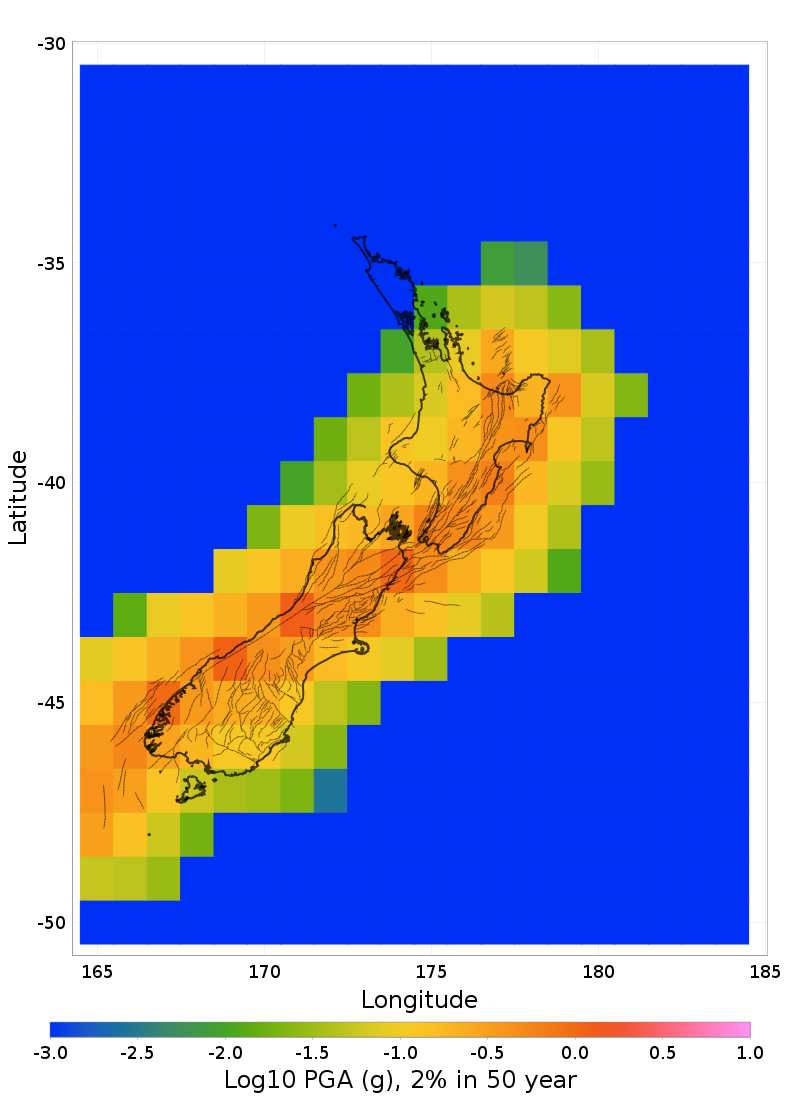
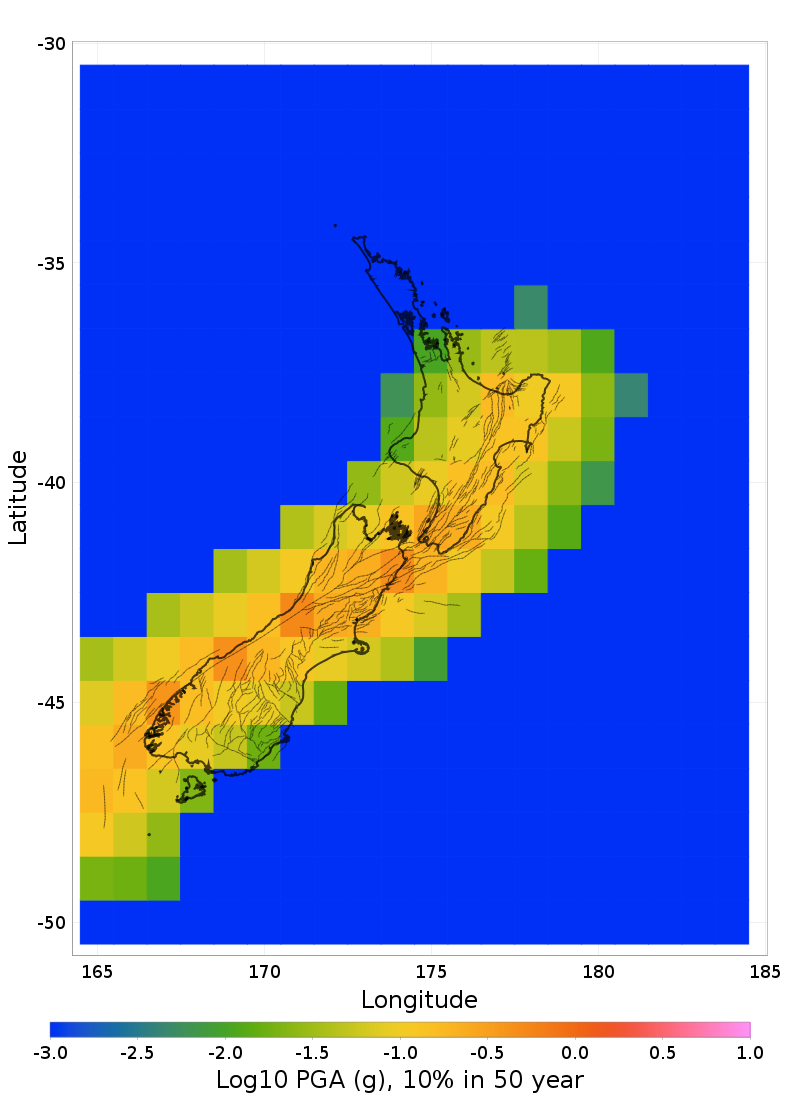
Hazard Maps
Hazard map comparisons with a resolution of 1 degrees (400 sites). Hazard is computed with the ASK2014 GMPE, default site parameters, and supra-seismogenic fault sources only.
PGA Hazard Maps
PGA, 2% in 50 year Hazard Maps
PGA, 10% in 50 year Hazard Maps
1s SA Hazard Maps
1s SA, 2% in 50 year Hazard Maps

1s SA, 10% in 50 year Hazard Maps

Fault Segmentation
The following plots show implied segmentation from the rates of this fault system solution.
NOTE: Solution Diagnostics: SW52ZXJzaW9uU29sdXRpb246MjA3OTYuMEhVekhG has multiple jumping points between parent sections. We consolidate all jumps to occur at a single jumping point (with the highest jumping rate) and average quantities on either side of the jump (participation/slip rates)
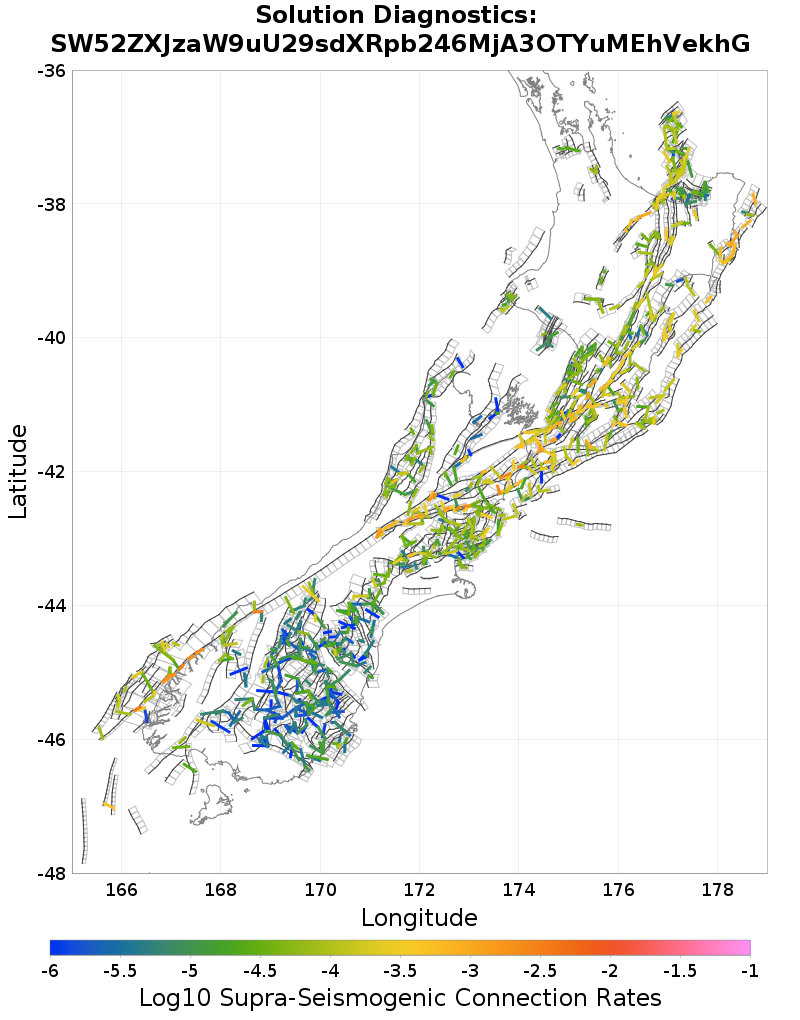
Supra-Seismogenic Fault Segmentation
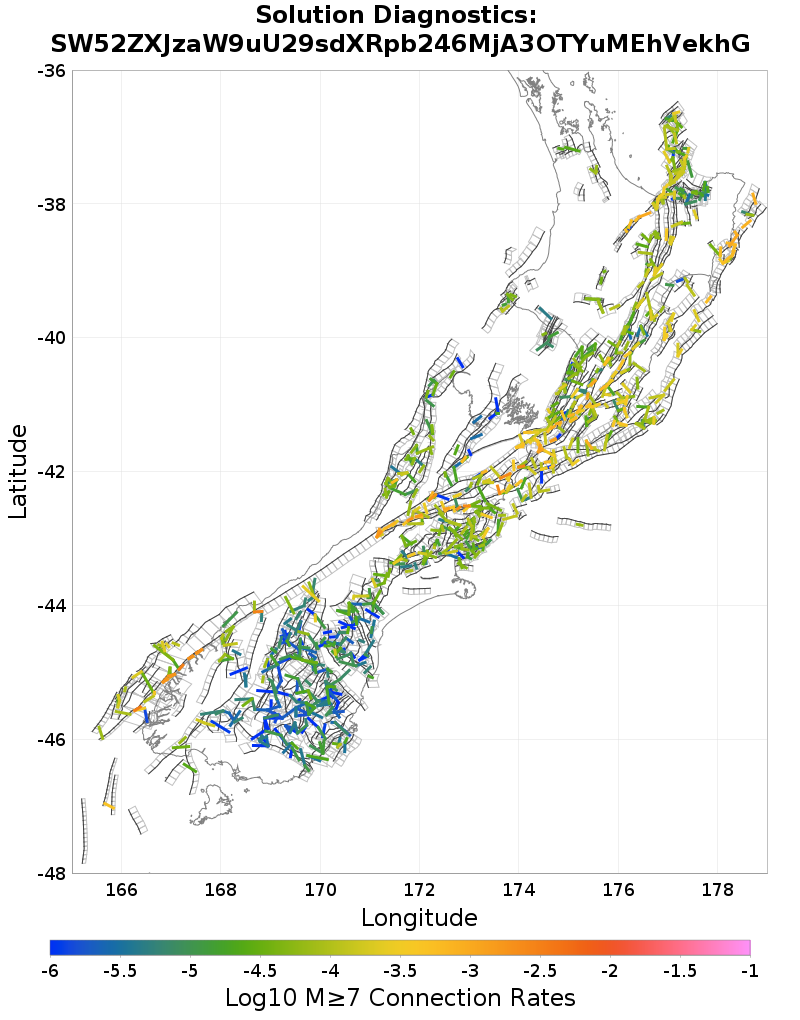
Connection Rates
This shows the rate at which each connection is taken.
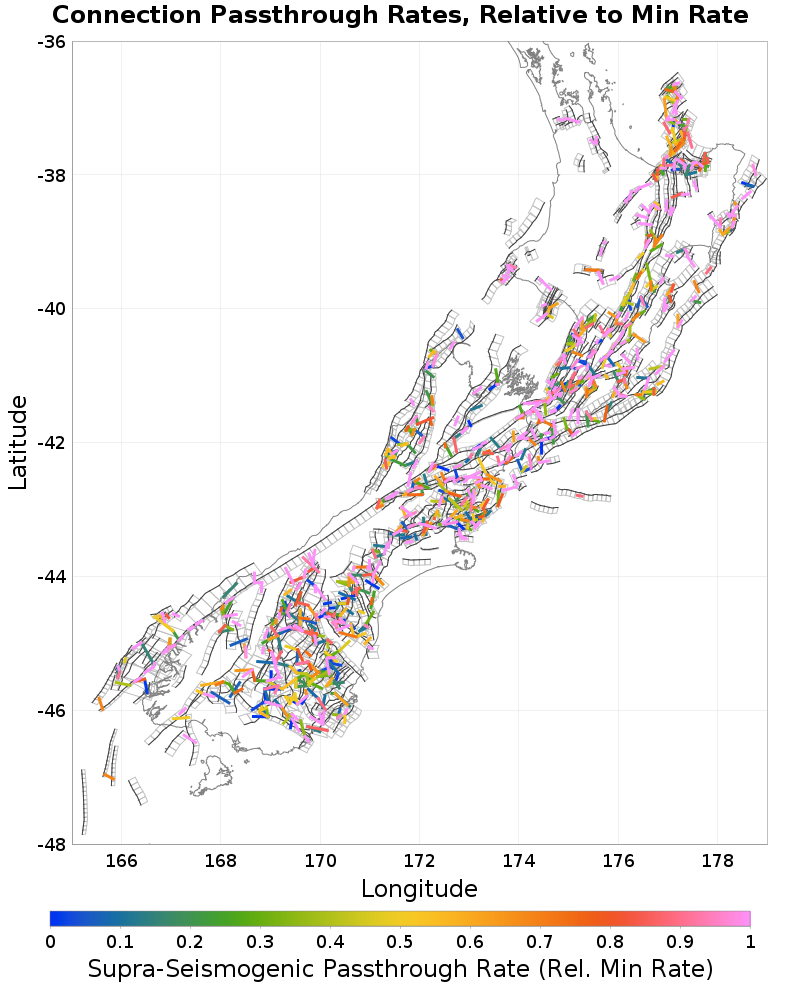
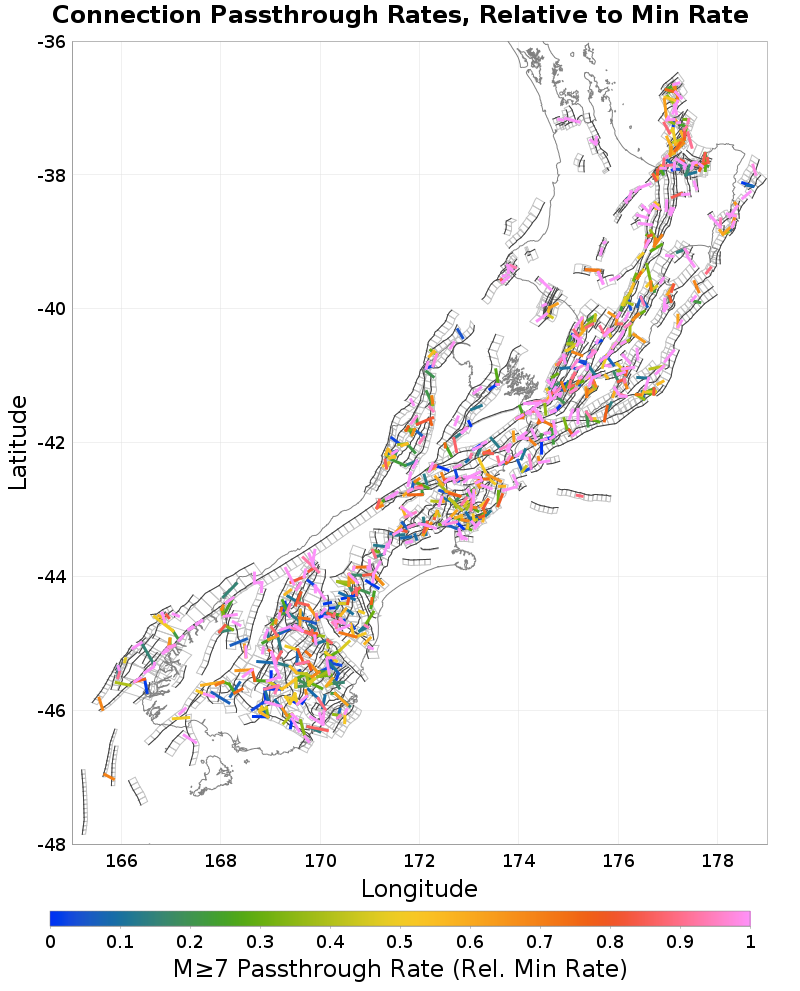
Connection Passthrough Rates
Passthrough rates refer to the ratio of the jumping rate to the rates on either side of the jump. The denominator of that ratio can be either the minimum, maximum, or average of the subsection rates on either side of the jump. Each choice of denomiator is plotted separately.
 |
|---|
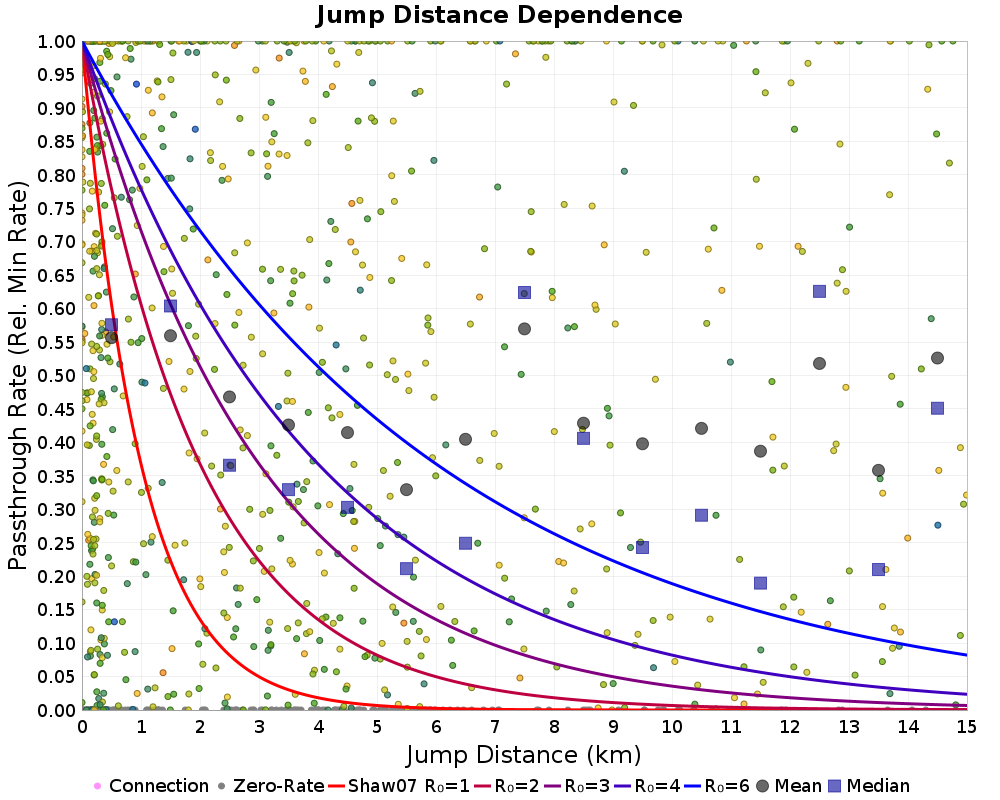
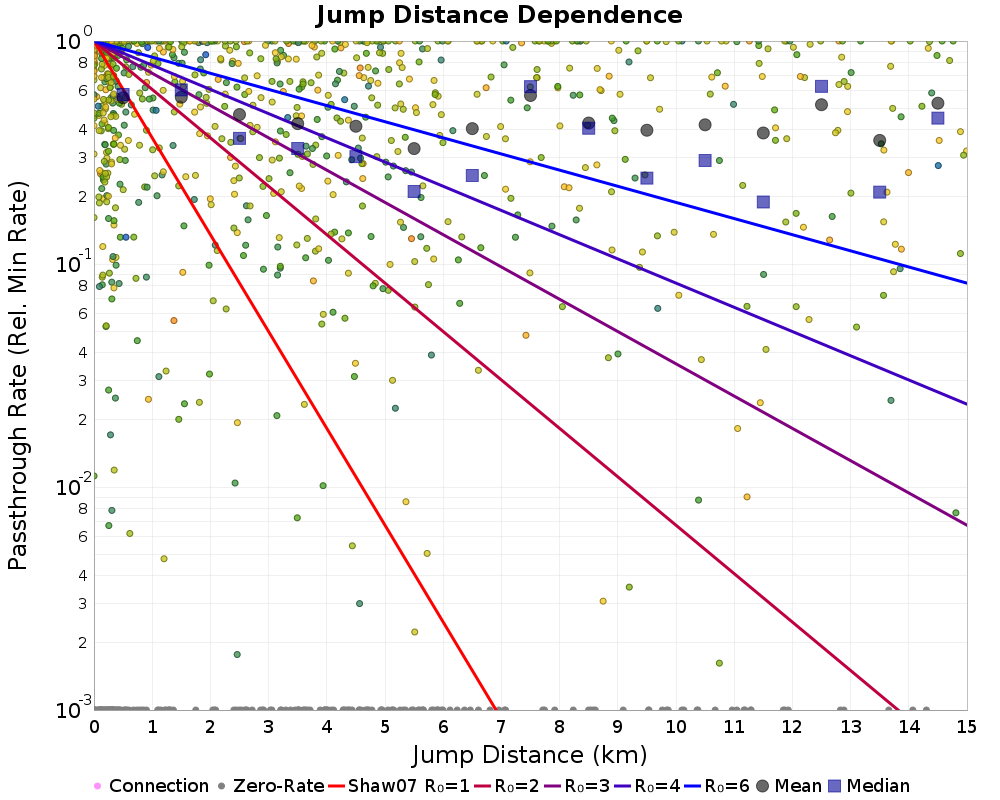
Connection Passthrough Rates vs Shaw & Dieterich (2007)
This plots passthrough rates versus various the distance relationship established in Shaw and Dieterich (2007).
| Linear | Log10 |
|---|---|
 |  |
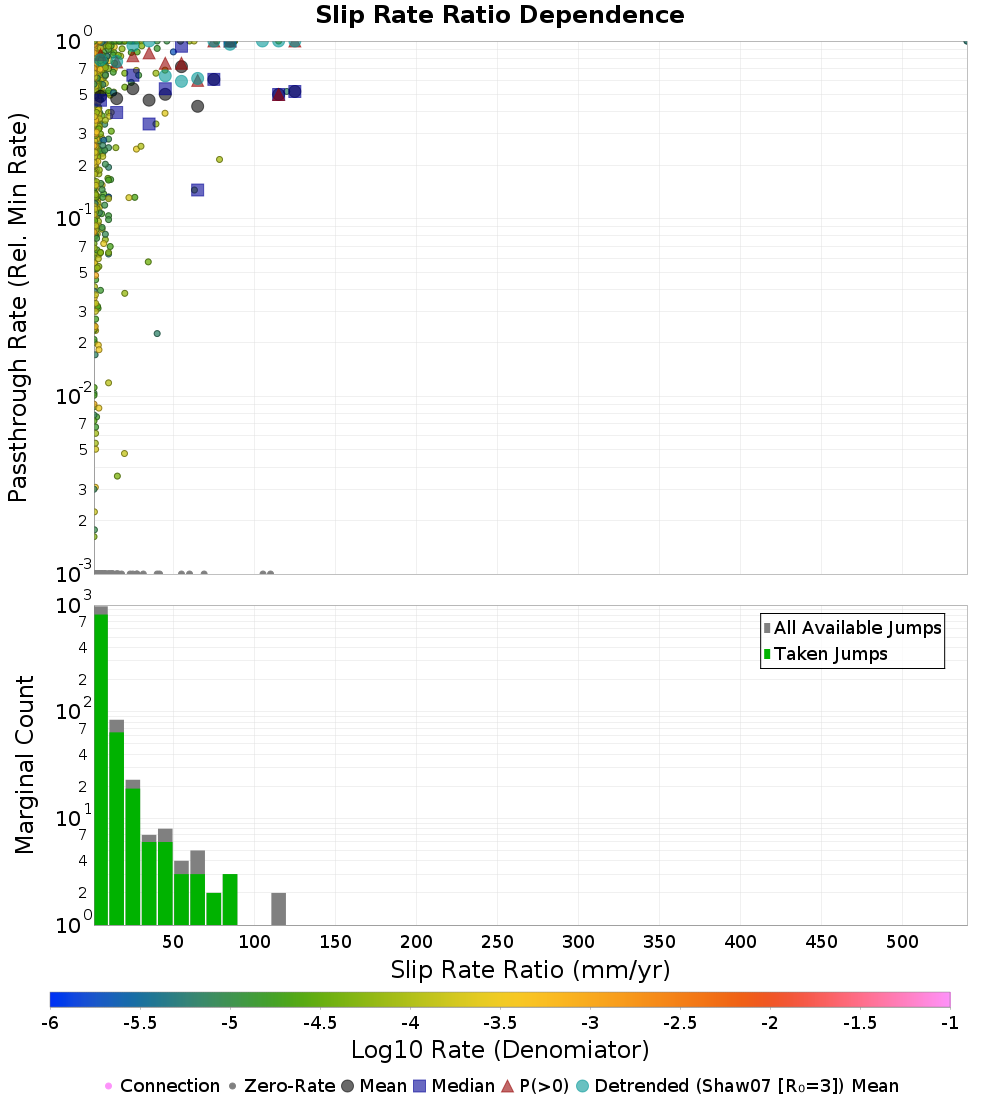
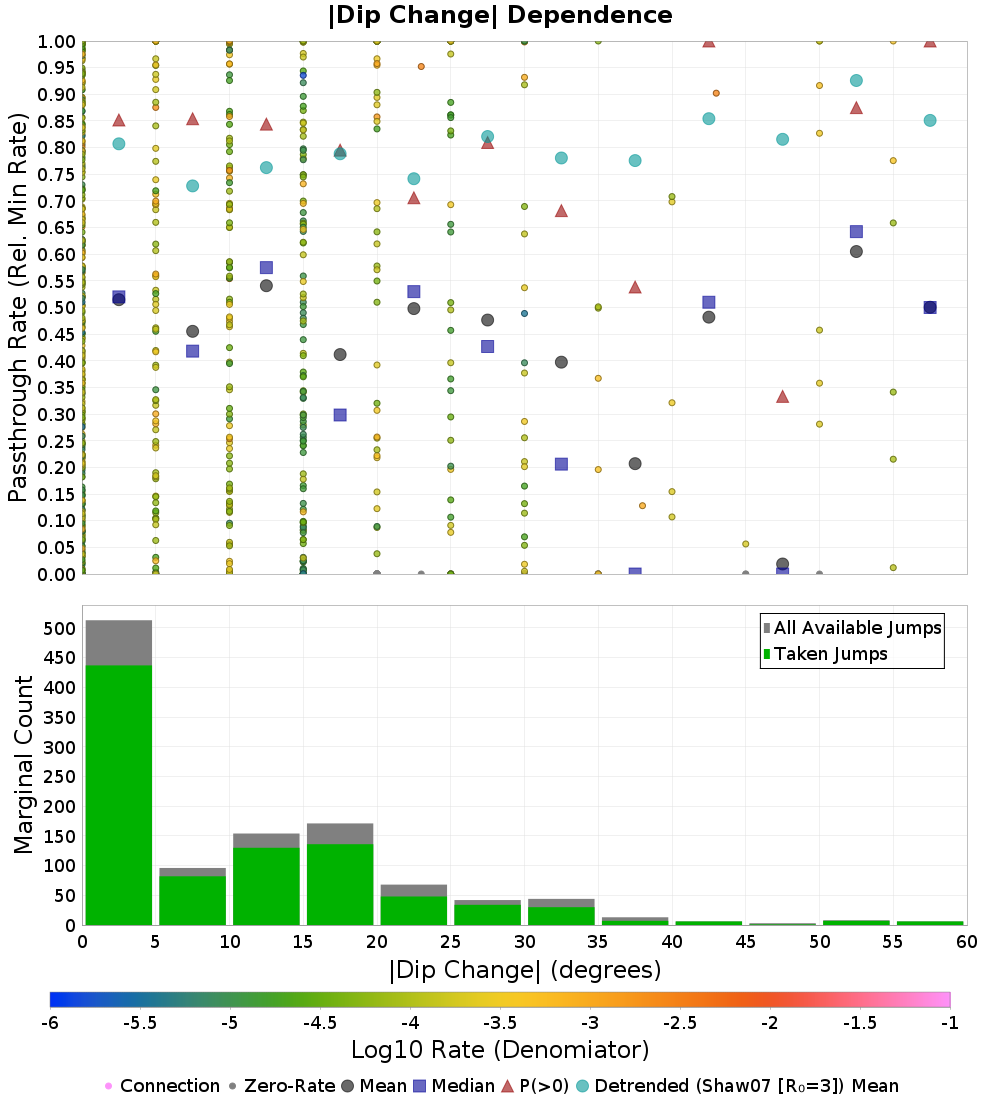
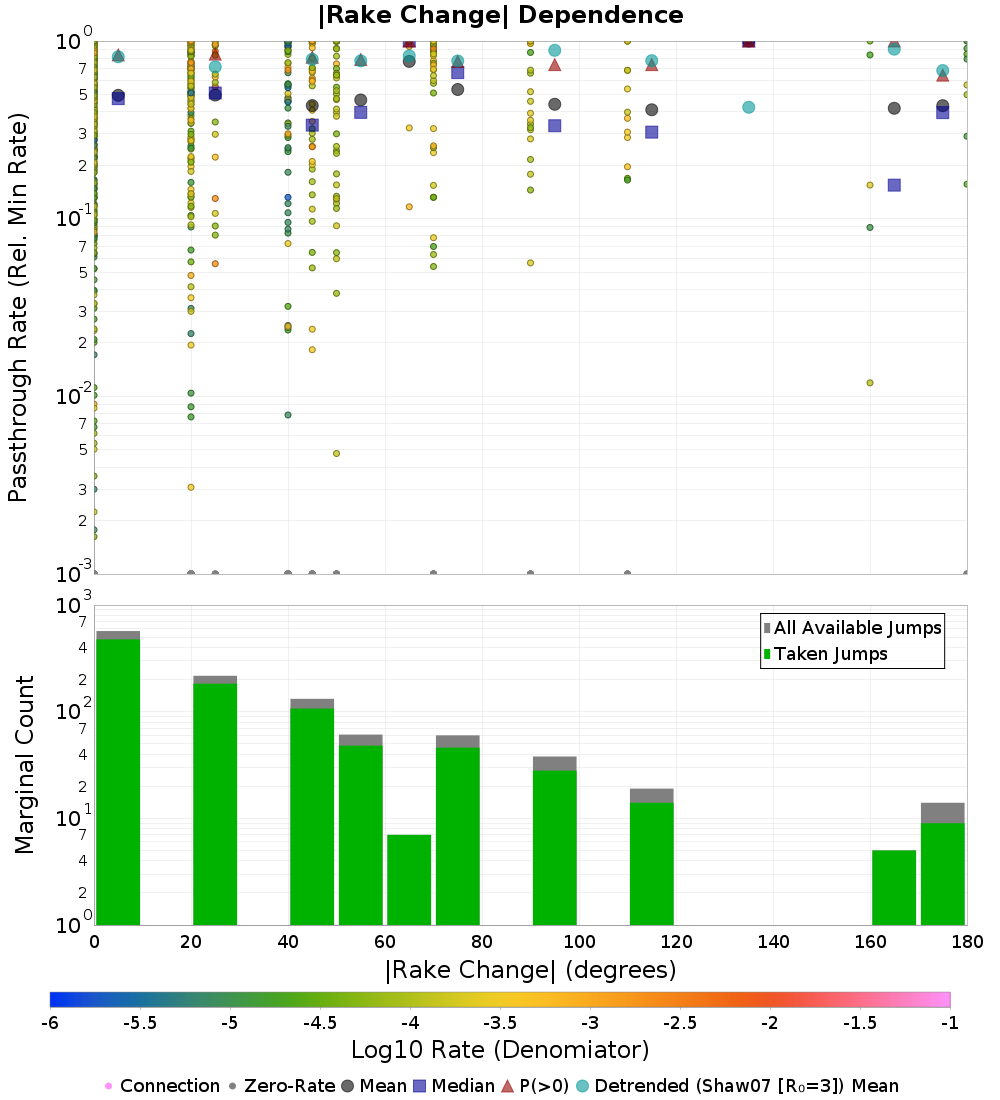
Connection Passthrough Rates vs Scalars
This plots passthrough rates versus various scalar values (for each rate combiniation type).
| Jump Distance (km) | Jump Distance (km) (Log10 Rates) |
|---|---|
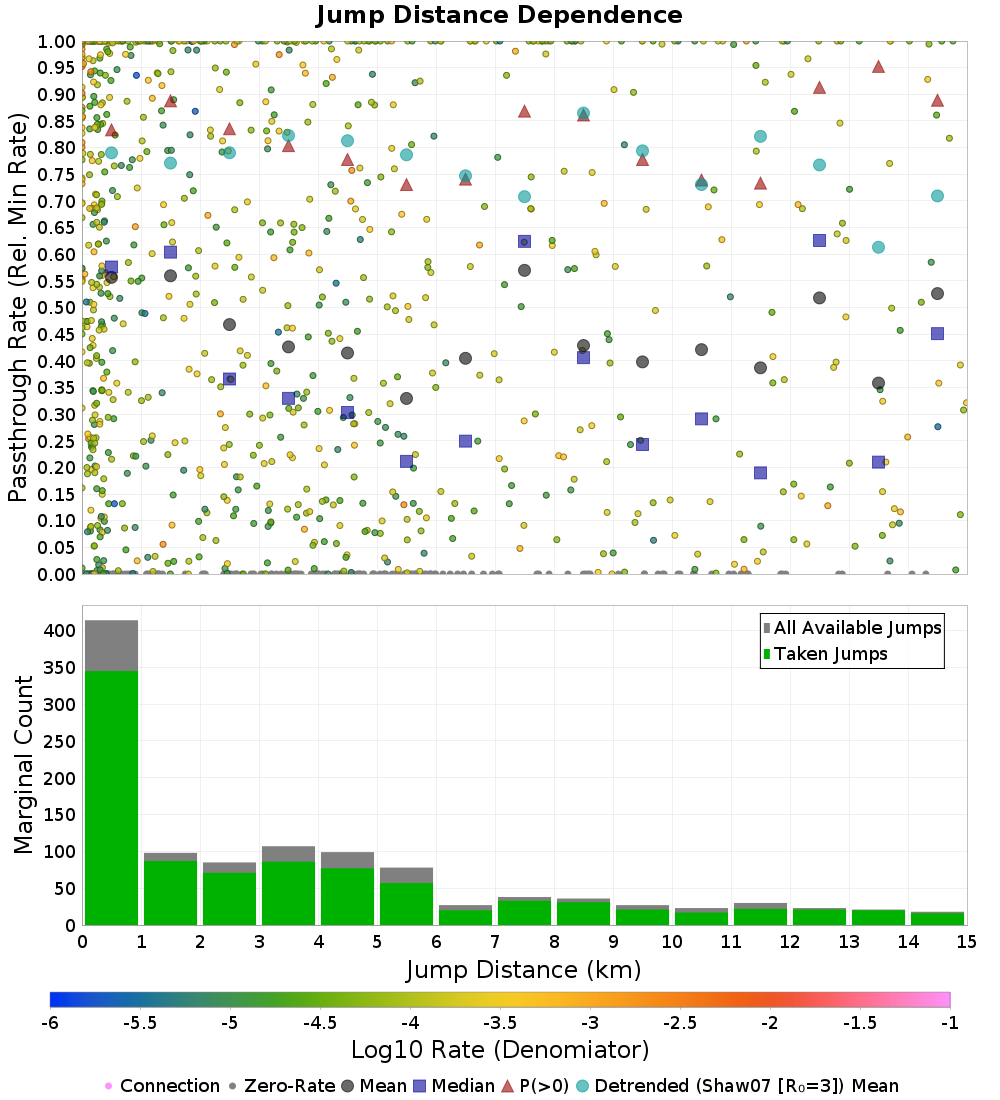 |  |
| |Slip Rate Change| (mm/yr) | |Slip Rate Change| (mm/yr) (Log10 Rates) |
|---|---|
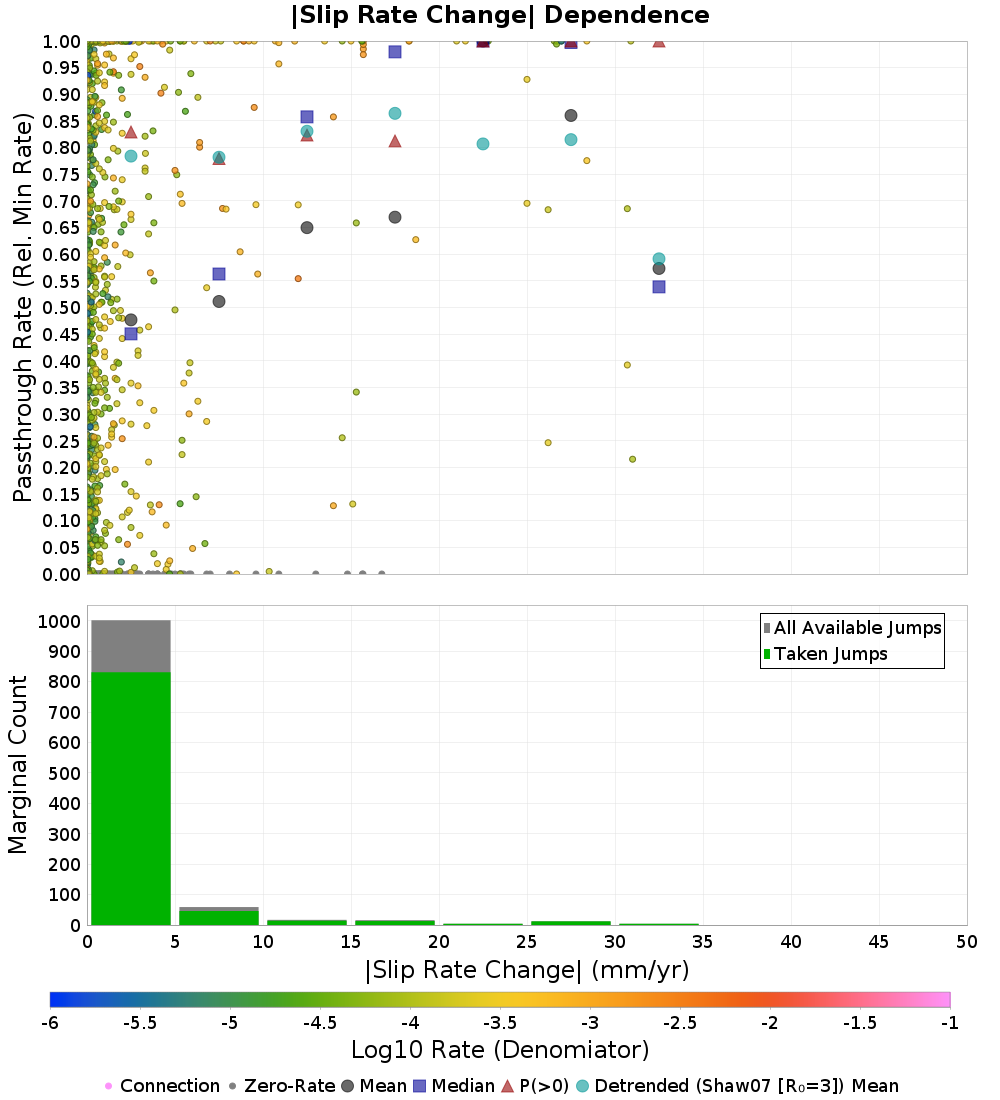 |  |
| Slip Rate Ratio (mm/yr) | Slip Rate Ratio (mm/yr) (Log10 Rates) |
|---|---|
 |  |
| |Dip Change| (degrees) | |Dip Change| (degrees) (Log10 Rates) |
|---|---|
 | 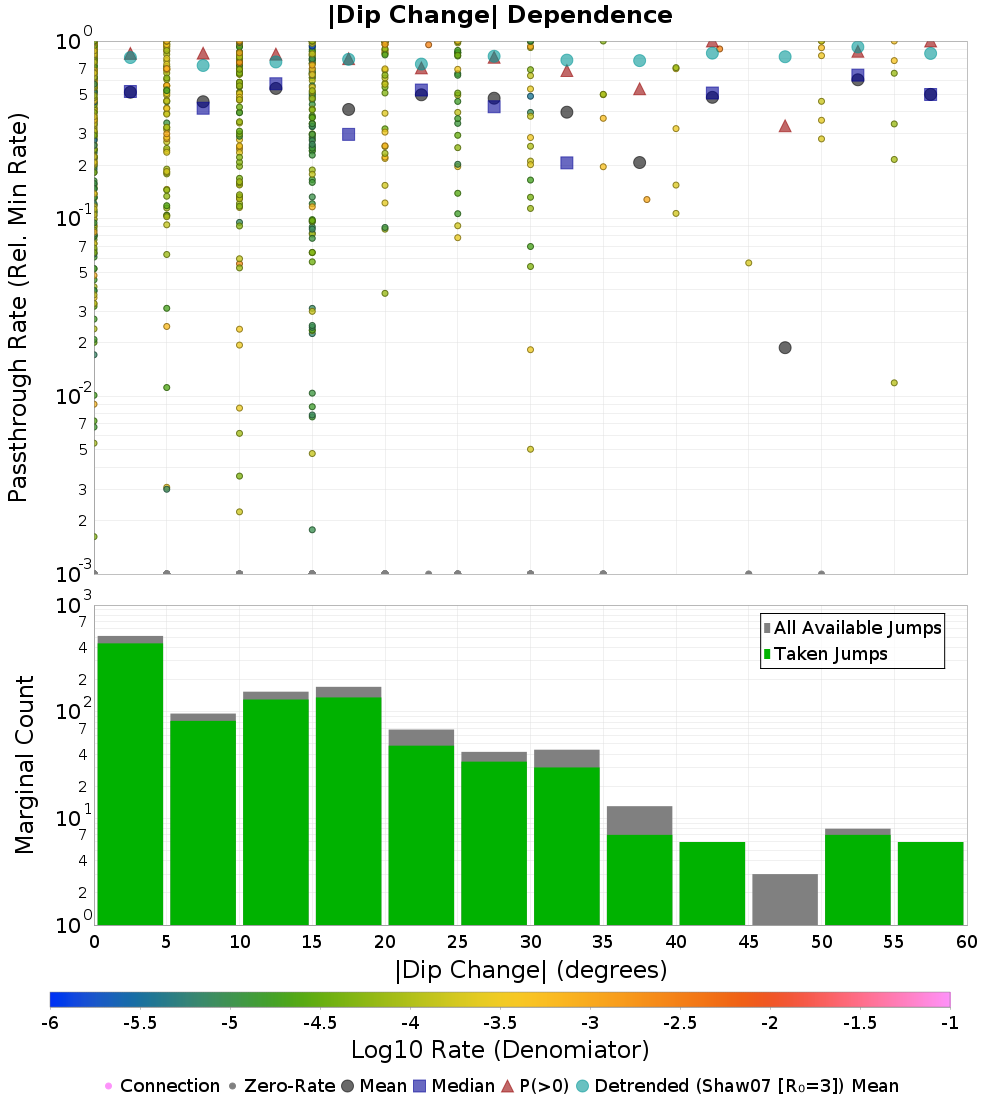 |
| |Rake Change| (degrees) | |Rake Change| (degrees) (Log10 Rates) |
|---|---|
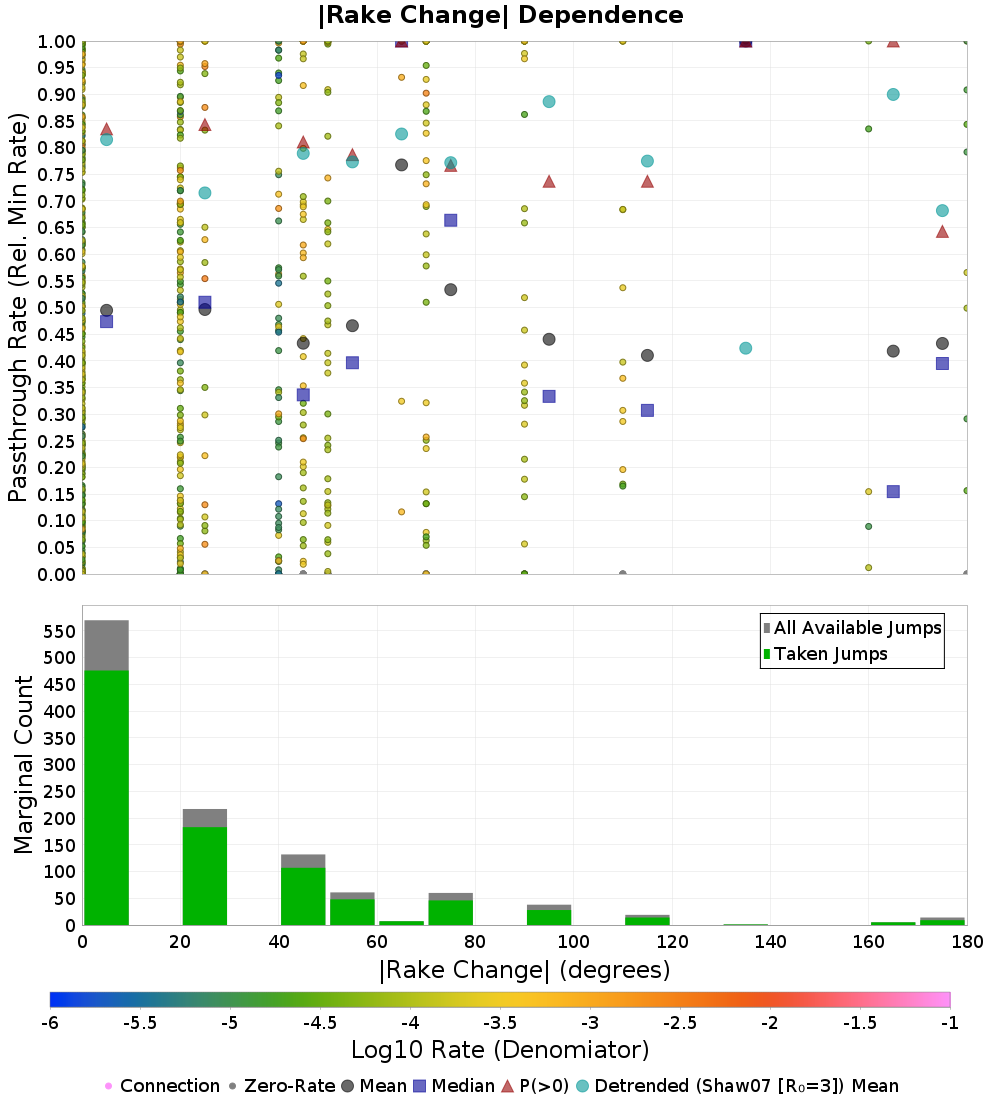 |  |
| |Azimuth Change| (degrees) | |Azimuth Change| (degrees) (Log10 Rates) |
|---|---|
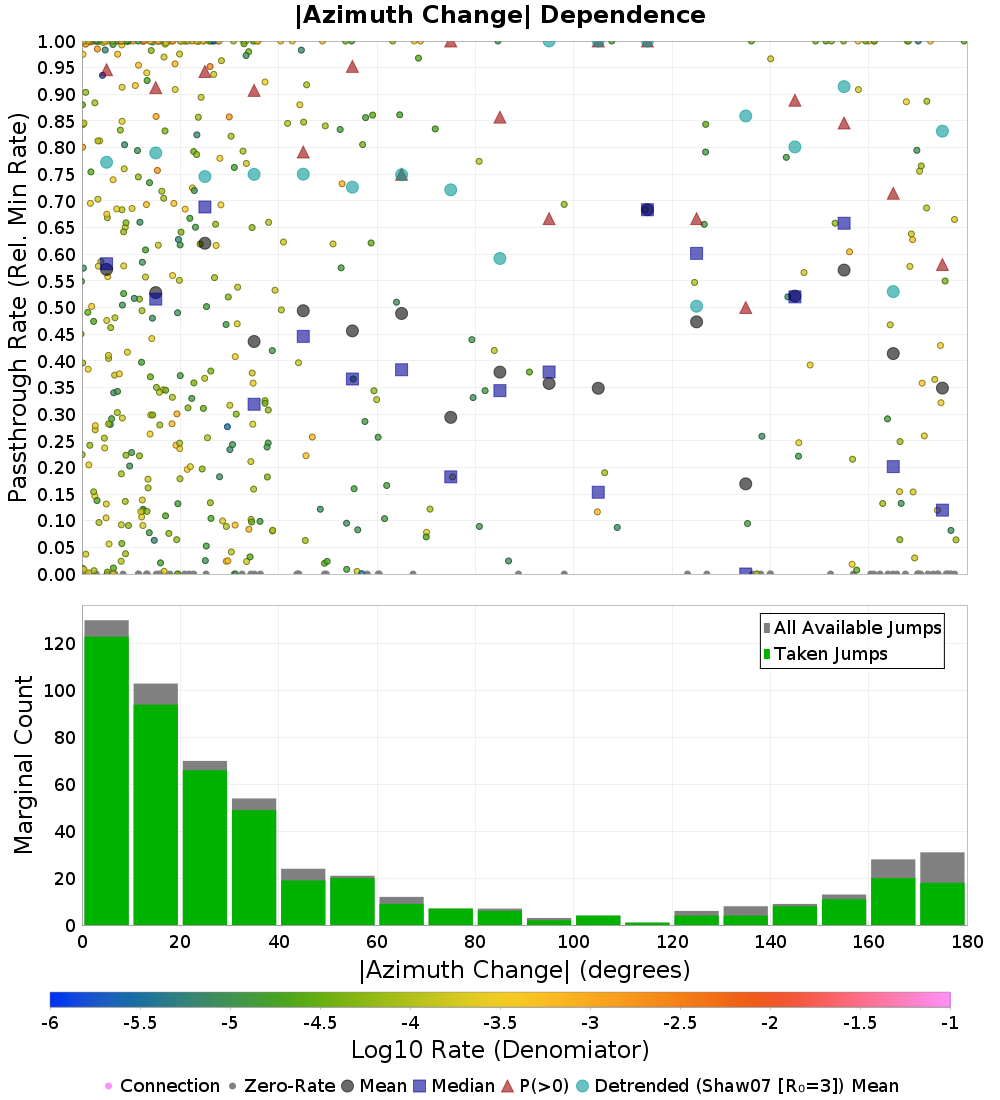 | 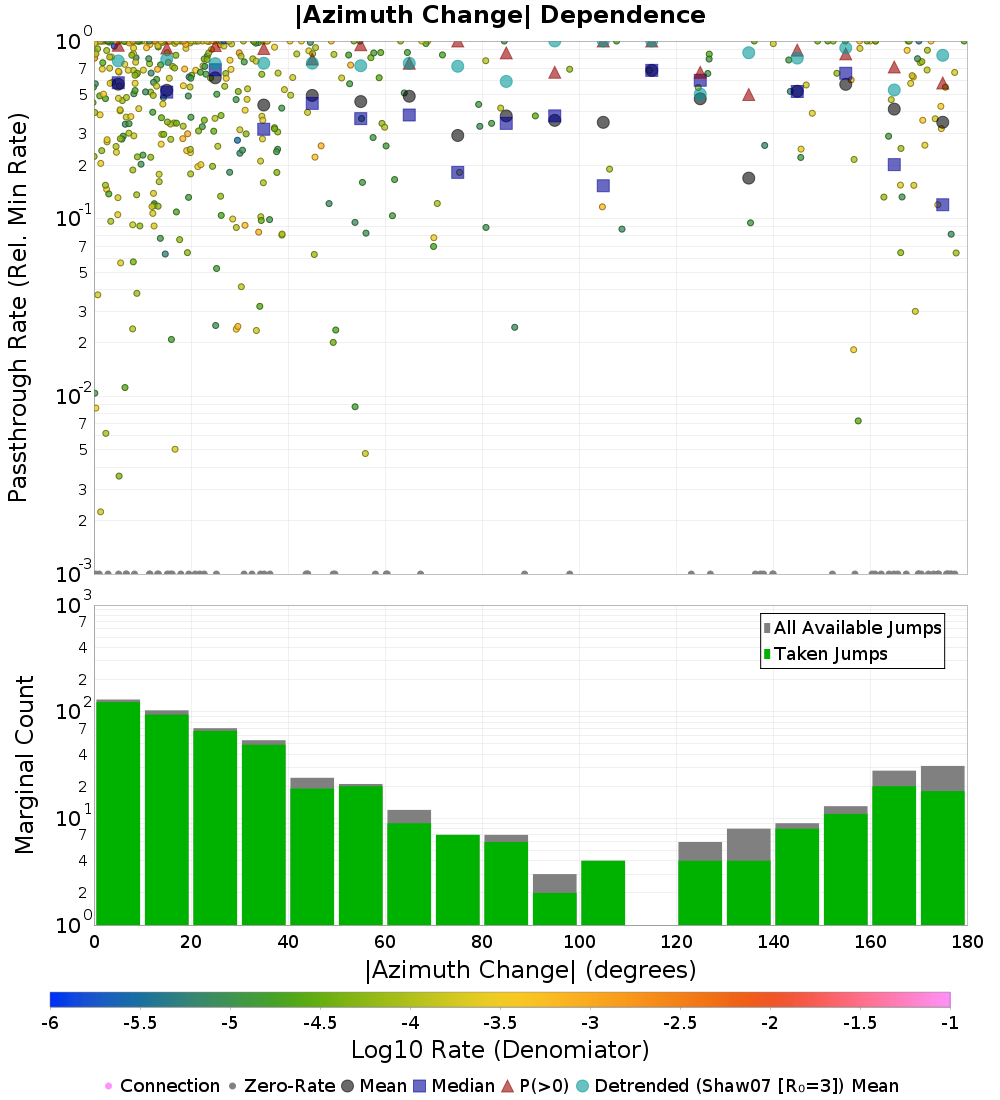 |
M≥7.0 Fault Segmentation
Connection Rates
This shows the rate at which each connection is taken.
Connection Passthrough Rates
Passthrough rates refer to the ratio of the jumping rate to the rates on either side of the jump. The denominator of that ratio can be either the minimum, maximum, or average of the subsection rates on either side of the jump. Each choice of denomiator is plotted separately.
 |
|---|
Connection Passthrough Rates vs Shaw & Dieterich (2007)
This plots passthrough rates versus various the distance relationship established in Shaw and Dieterich (2007).
| Linear | Log10 |
|---|---|
 |  |
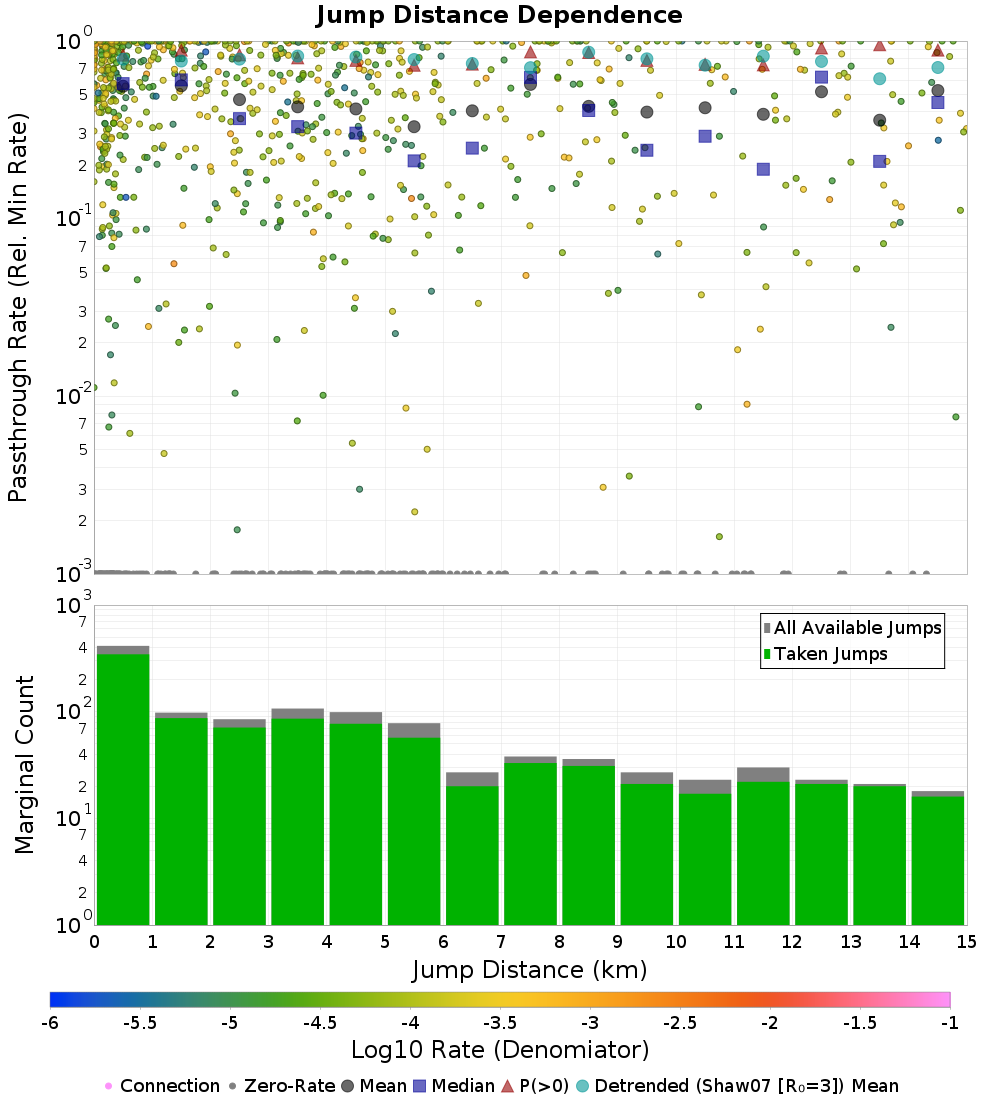
Connection Passthrough Rates vs Scalars
This plots passthrough rates versus various scalar values (for each rate combiniation type).
| Jump Distance (km) | Jump Distance (km) (Log10 Rates) |
|---|---|
 |  |
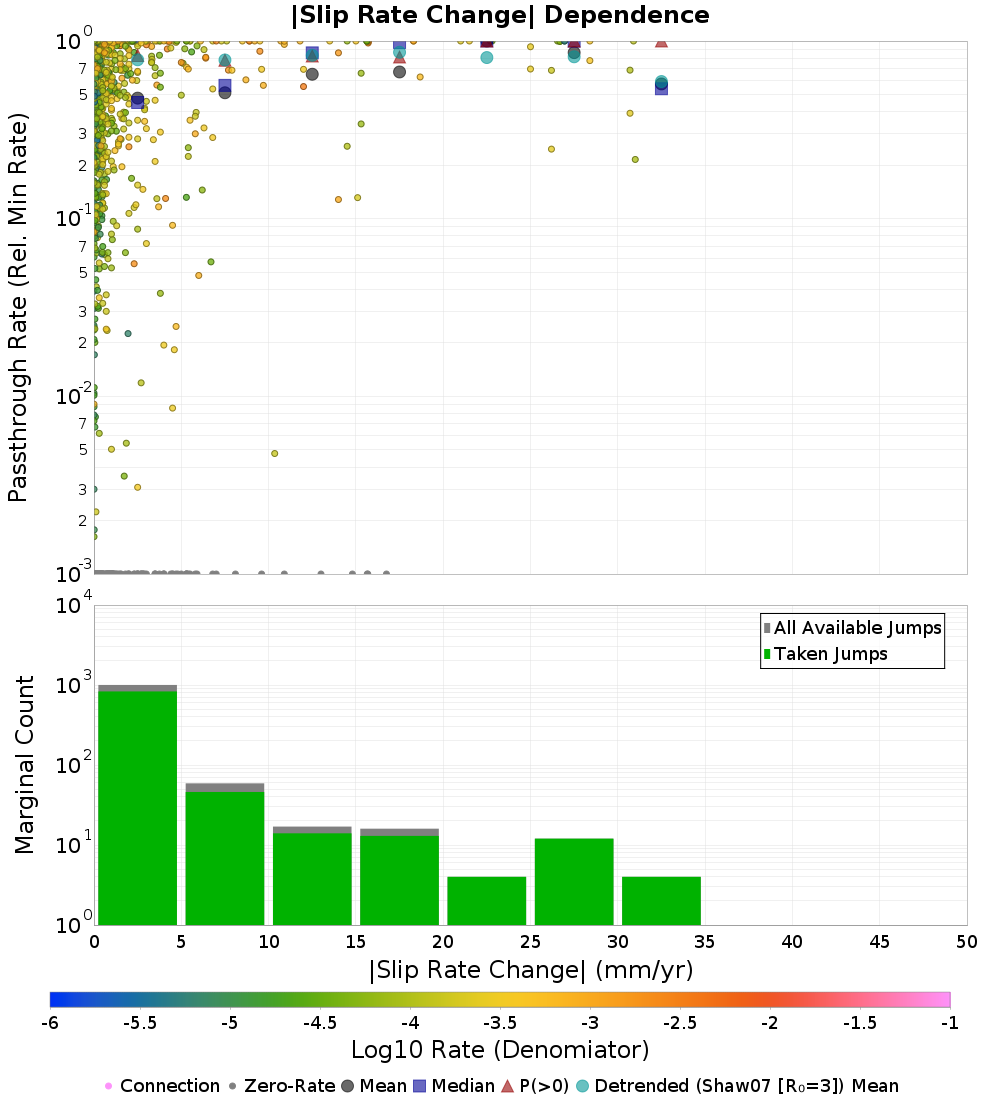
| |Slip Rate Change| (mm/yr) | |Slip Rate Change| (mm/yr) (Log10 Rates) |
|---|---|
 |  |
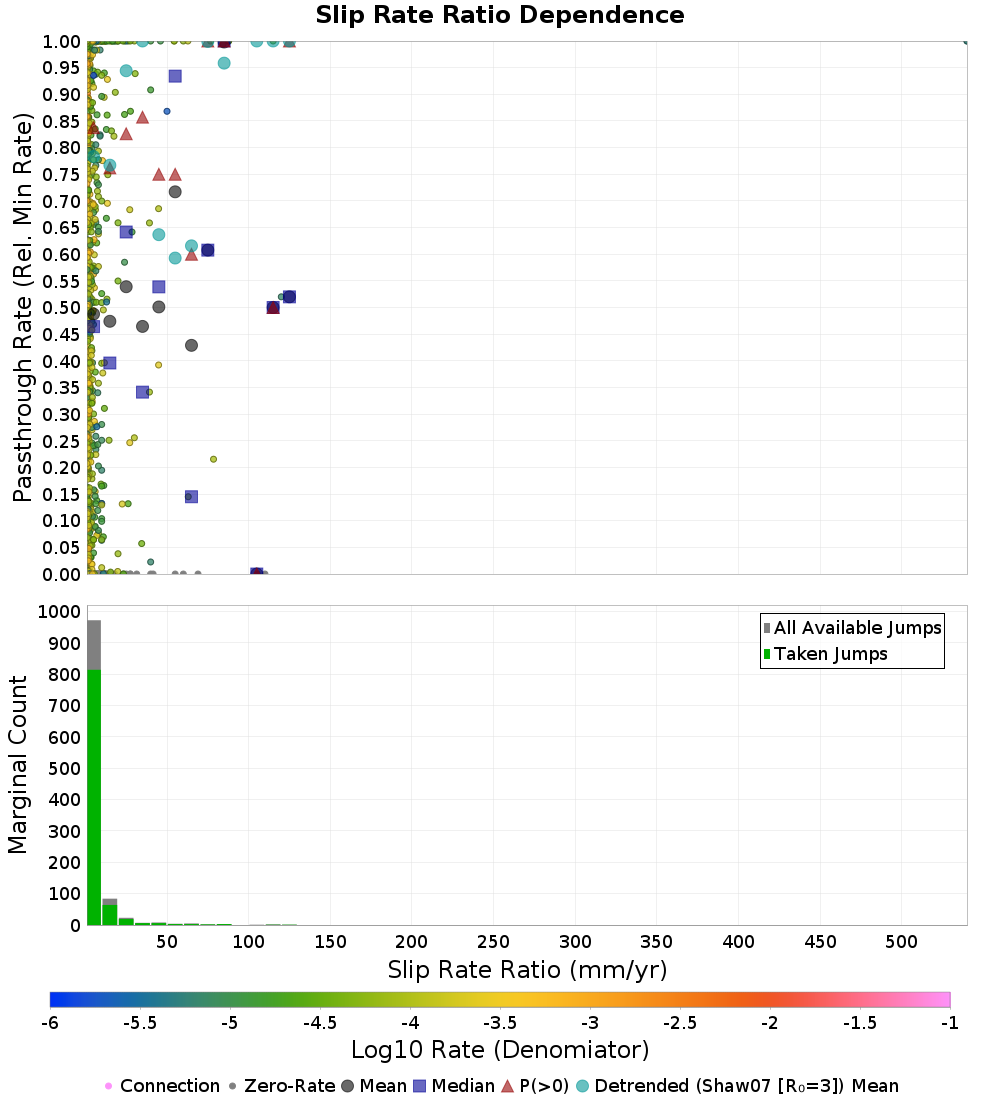
| Slip Rate Ratio (mm/yr) | Slip Rate Ratio (mm/yr) (Log10 Rates) |
|---|---|
 |  |
| |Dip Change| (degrees) | |Dip Change| (degrees) (Log10 Rates) |
|---|---|
 |  |
| |Rake Change| (degrees) | |Rake Change| (degrees) (Log10 Rates) |
|---|---|
 |  |
| |Azimuth Change| (degrees) | |Azimuth Change| (degrees) (Log10 Rates) |
|---|---|
 |  |
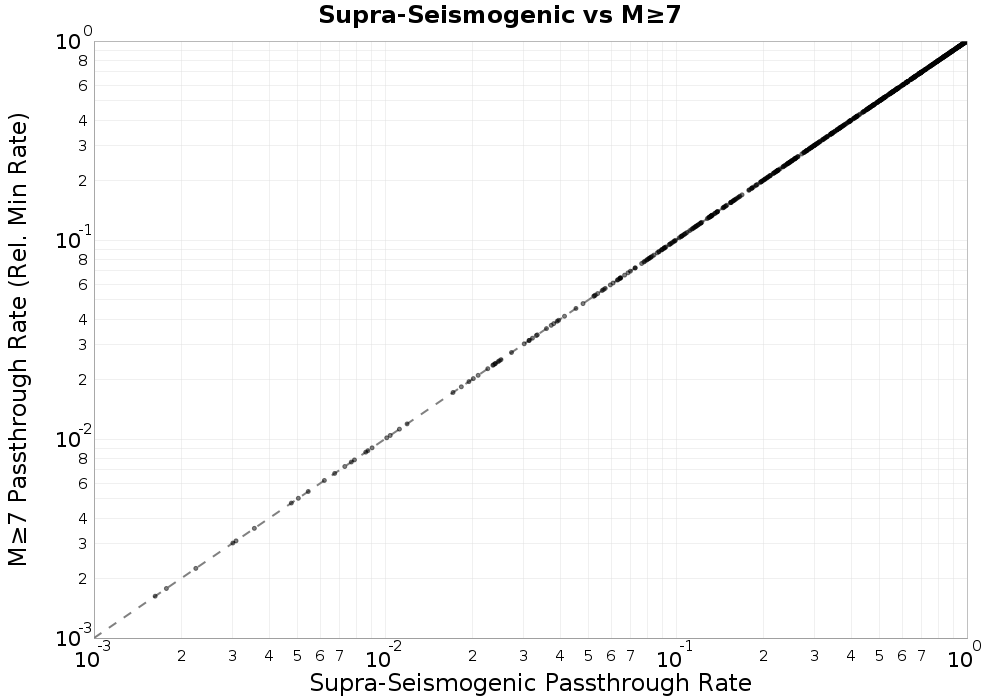
Magnitude Connection Rate Comparisons
This comapres Solution Diagnostics: SW52ZXJzaW9uU29sdXRpb246MjA3OTYuMEhVekhG passthrough rates across magniutdes (and also for each rate combiniation type). Linear on the left, log10 on the right.
| Linear Passthrough Rates | Log10 Passthrough Rates |
|---|---|
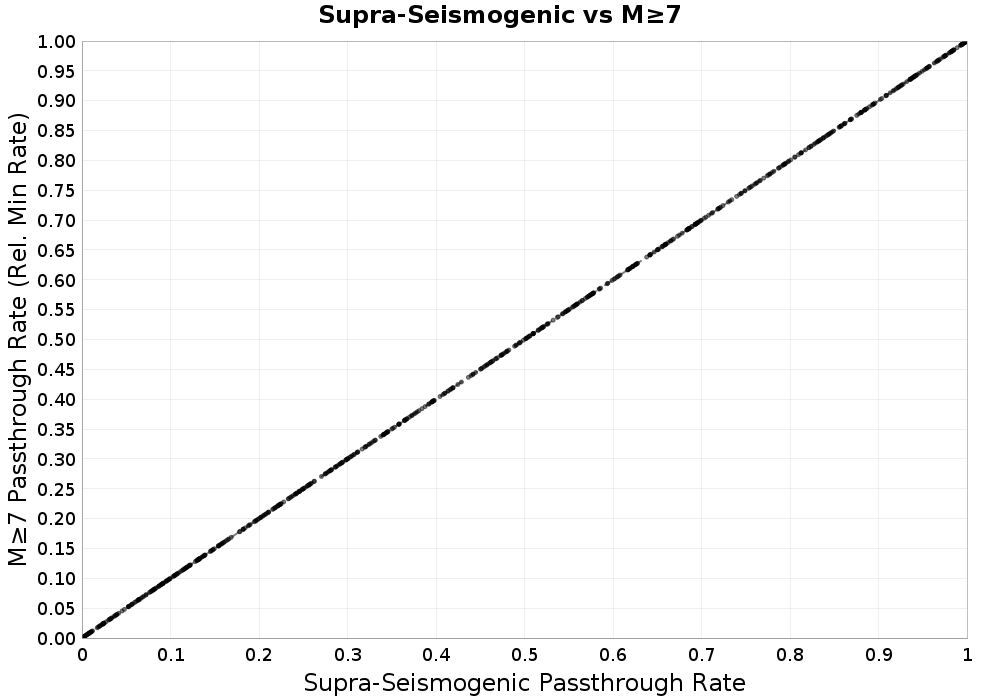 |  |