Solution Report: Solution Diagnostics: SW52ZXJzaW9uU29sdXRpb246MjQxMjAuMHFYQ2Zl
| Num Ruptures | 329,921 |
|---|
| Num Single-Stranded Ruptures | 329,921 (100.00%) |
| Total Supra-Seis Rupture Rate | 0.058769763 |
| Total Supra-Seis Recurrence Interval | 17.02 yrs |
| Total Moment Rate | 2.7570017e19 N-m/yr |
| Deformation Model Total Moment Rate | 3.070185e19 N-m/yr |
| Magnitude Range | [5.93,8.63] |
| Length Range | [1.86,1204.33] km |
| Rupture Section Count Range | [2,124] |
Table Of Contents
Logic Tree Branch
(top)
| Level | Choice |
|---|
| Fault Model | (N/A) |
| Fault Regime | Fault Regime |
| NZSHM22_SpatialSeisPDF | NZSHM22_1346 |
| Slip Along Rupture Model (Dsr) | Uniform |
| Inversion Model | Characteristic (Constrained) |
| NZSHM22_ScalingRelationship | NZSHM22_ScalingRelationship |
| NZSHM22_DeformationModel | FAULT_MODEL |
Solution MFDs
(top)
Total Target MFDs
(top)
| Incremental MFDs | Cumulative MFDs |
|---|
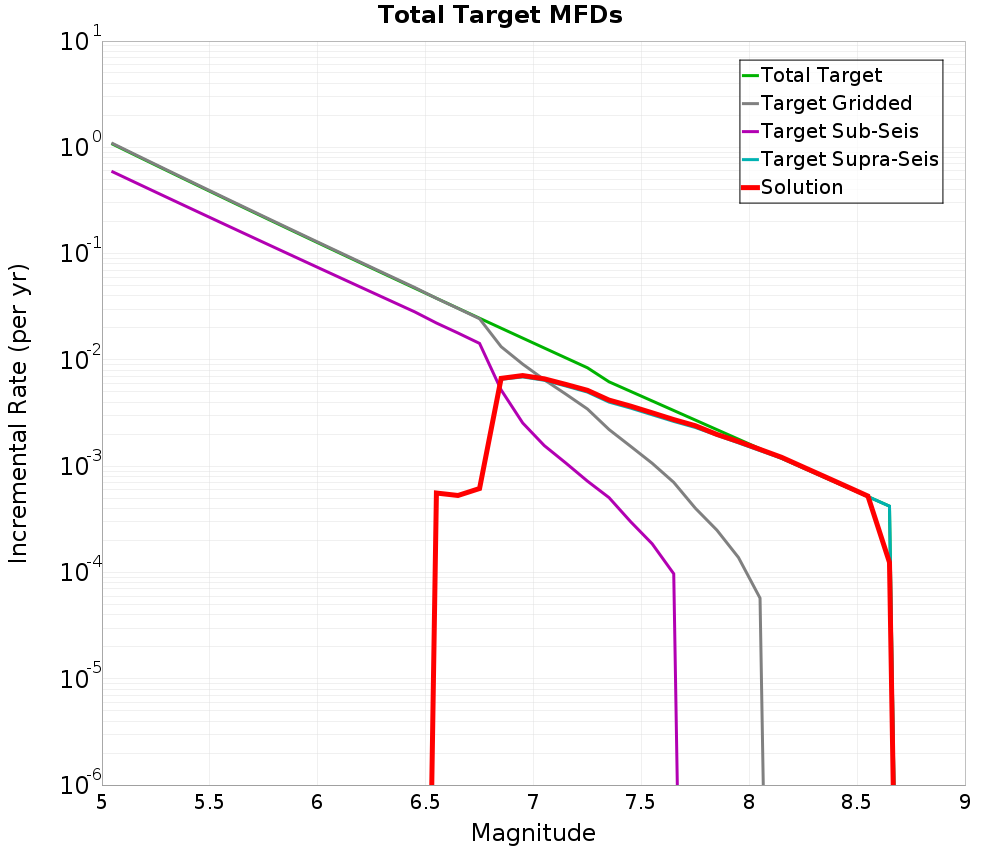 | 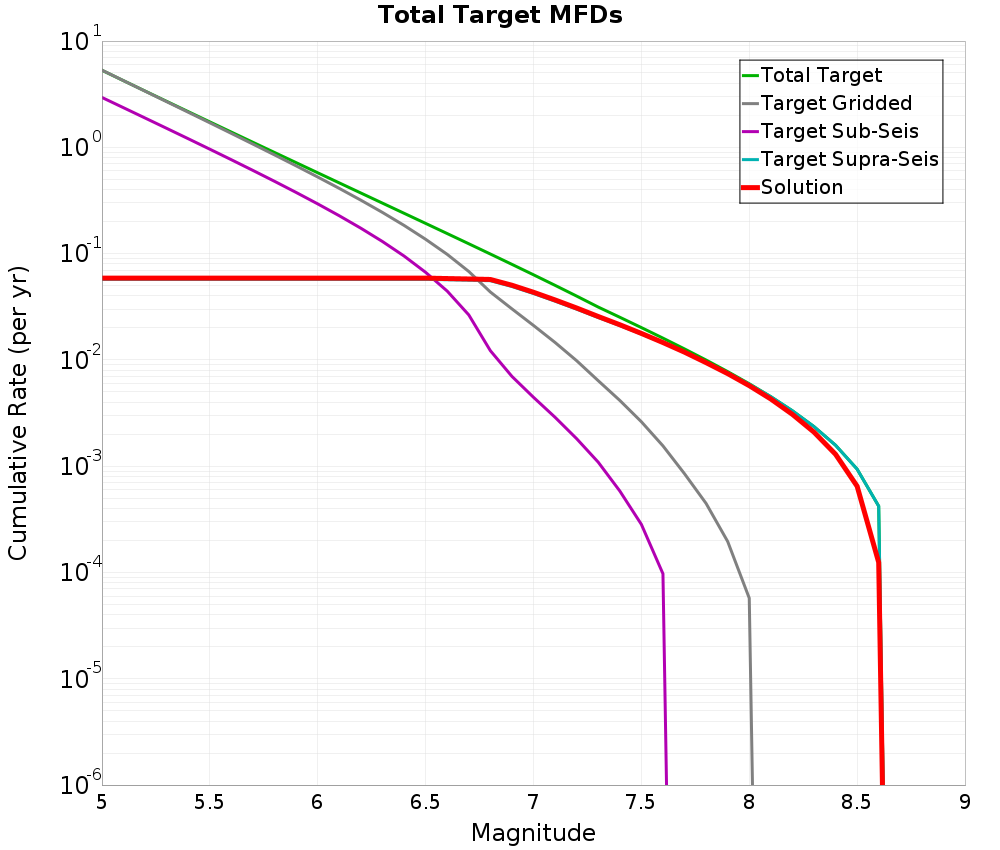 |
NZ RECTANGLE SANS TVZ Gridded Region
(top)
| Incremental MFDs | Cumulative MFDs |
|---|
 |  |
NZ TVZ Gridded Region
(top)
| Incremental MFDs | Cumulative MFDs |
|---|
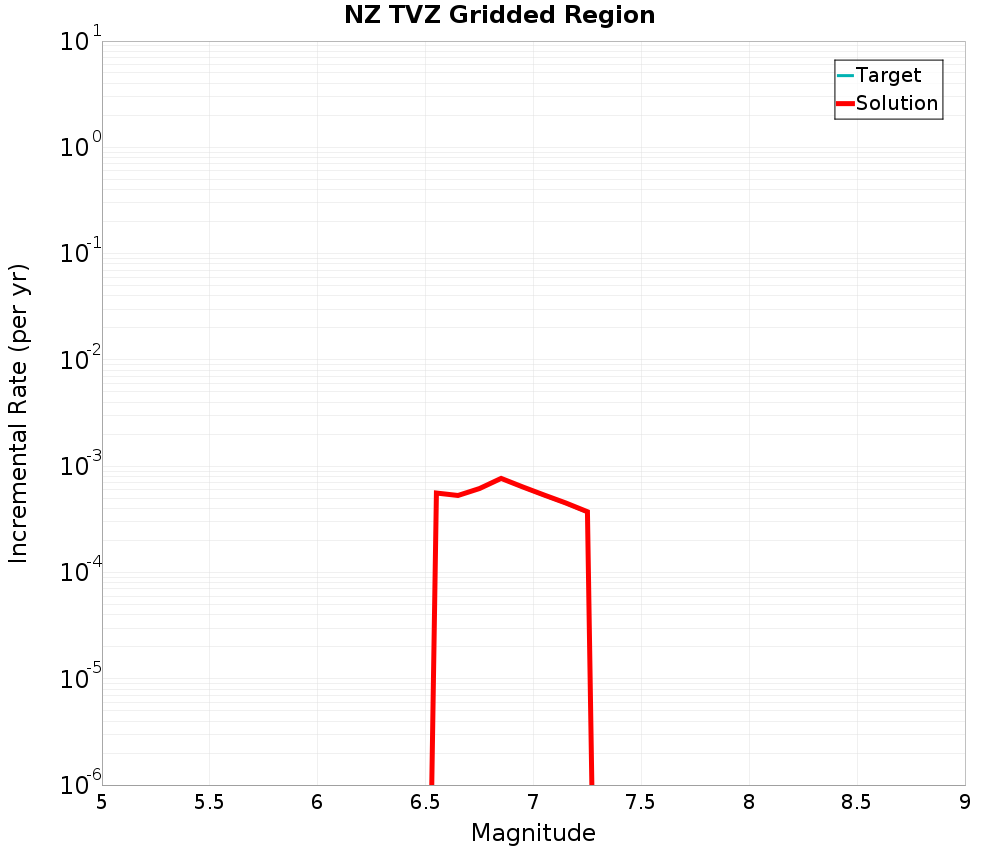 | 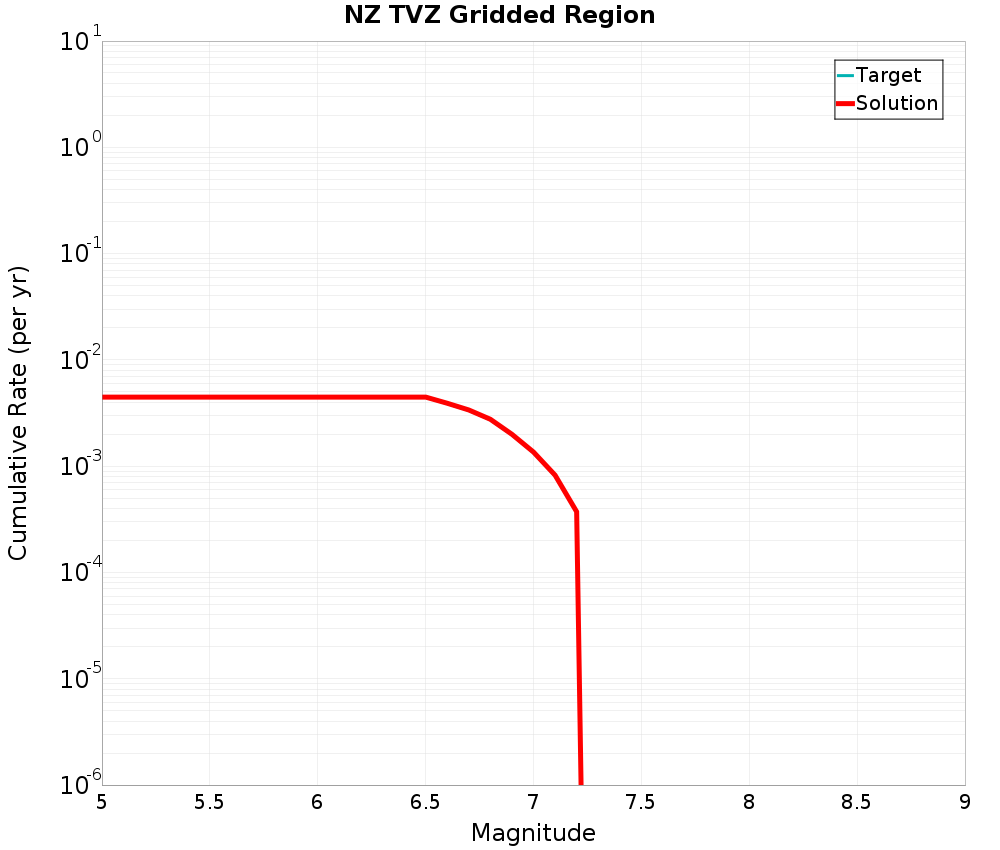 |
Simulated Annealing Energy
(top)
| Iterations | 946,470,444 |
|---|
| Time | 2 hours 0.2 mins |
| Iterations Per Sec. | 131,241 |
| Perturbations | 11,554,786 |
| # Worse Pertubations Kept | 6 |
| Iterations Per Perturb. | 81.91 |
| Total Energy | 9.3124844E9 |
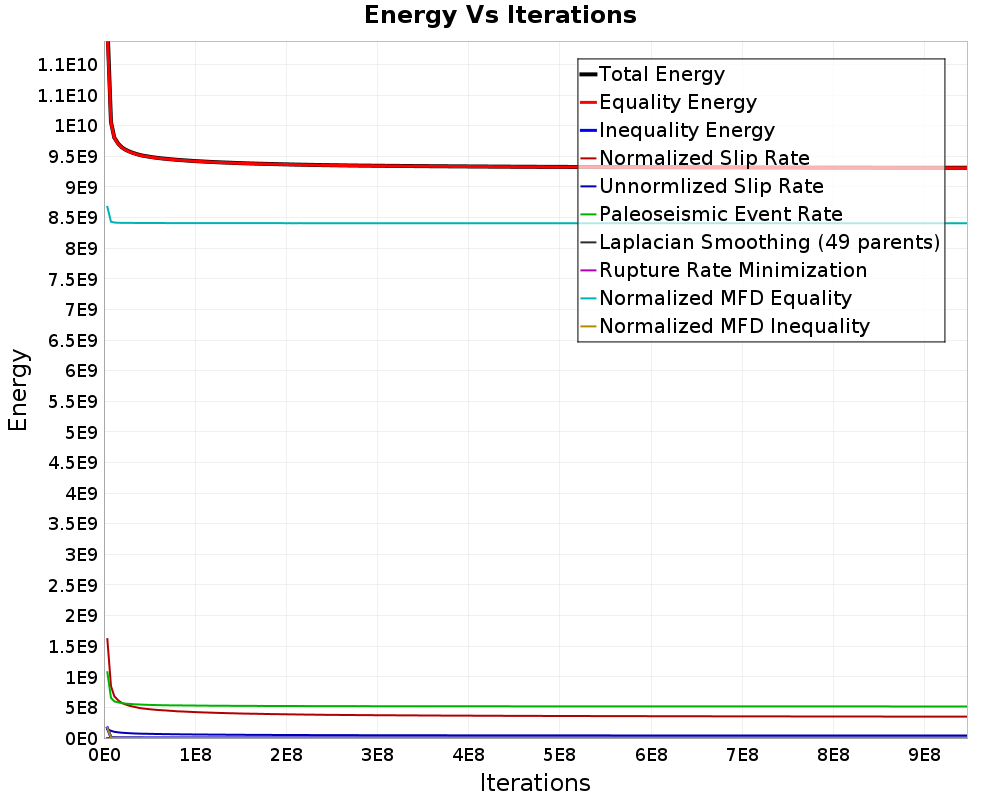
Final Energies
(top)
| Energy Type | Final Energy (2 hours 0.2 mins) | % of Total | After 30 mins | 1 hour | 1 hour 30 mins |
|---|
| Total Energy | 9.3124844E9 | | 9.3580964E9 | 9.328811E9 | 9.3182167E9 |
| Equality Energy | 9.3111122E9 | 99.99% | 9.3562368E9 | 9.3272945E9 | 9.3167759E9 |
| Entropy Energy | 0.0 | 0.00% | 0.0 | 0.0 | 0.0 |
| Inequality Energy | 1372452.8 | 0.01% | 1859944.4 | 1516938.1 | 1441033.1 |
| Normalized Slip Rate | 3.48865152E8 | 3.75% | 3.80157408E8 | 3.60544896E8 | 3.53150656E8 |
| Unnormlized Slip Rate | 4.053146E7 | 0.44% | 4.7573904E7 | 4.2421876E7 | 4.1158312E7 |
| Paleoseismic Event Rate | 5.15332192E8 | 5.53% | 5.20716448E8 | 5.1736192E8 | 5.15892416E8 |
| Laplacian Smoothing (49 parents) | 3932.461 | 0.00% | 2990.4812 | 3370.5588 | 3682.7485 |
| Rupture Rate Minimization | 0.0 | 0.00% | 0.0 | 0.0 | 0.0 |
| Normalized MFD Equality | 8.406379E9 | 90.27% | 8.4077865E9 | 8.4069622E9 | 8.406571E9 |
| Normalized MFD Inequality | 1372452.8 | 0.01% | 1859944.4 | 1516938.1 | 1441033.1 |
Energy Progress
(top)

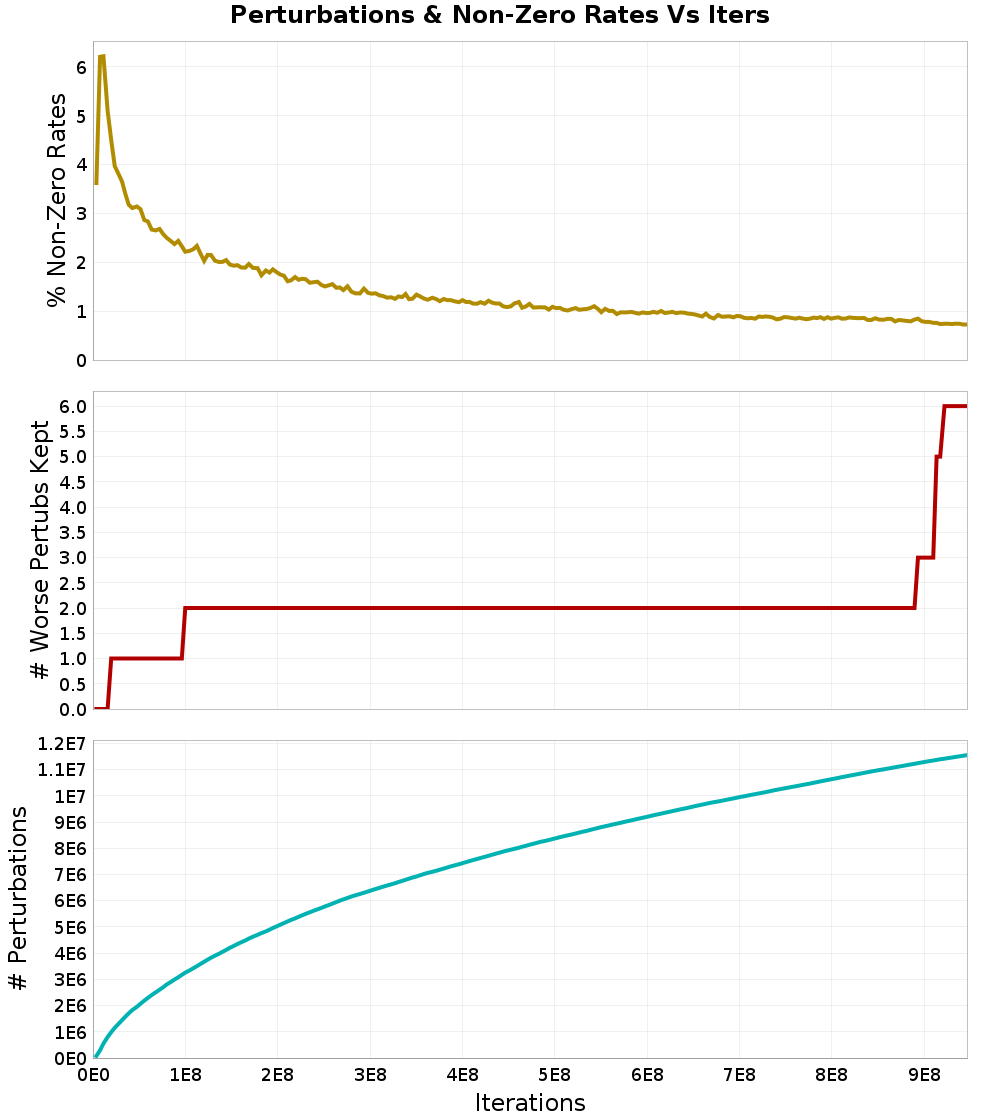
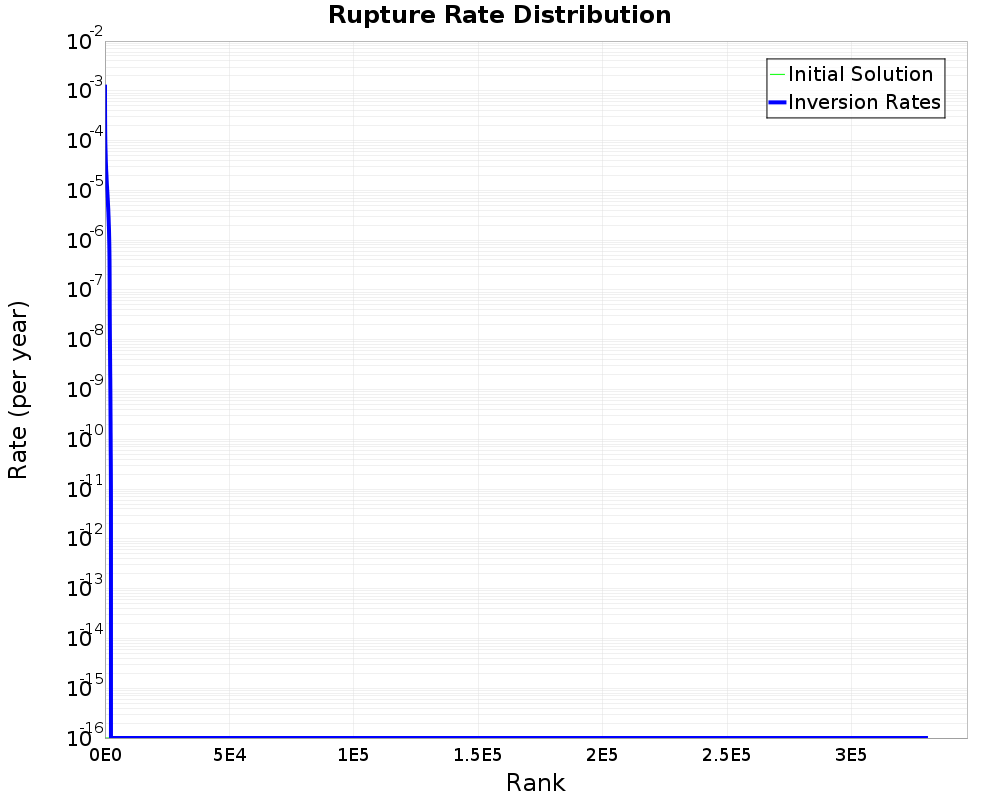
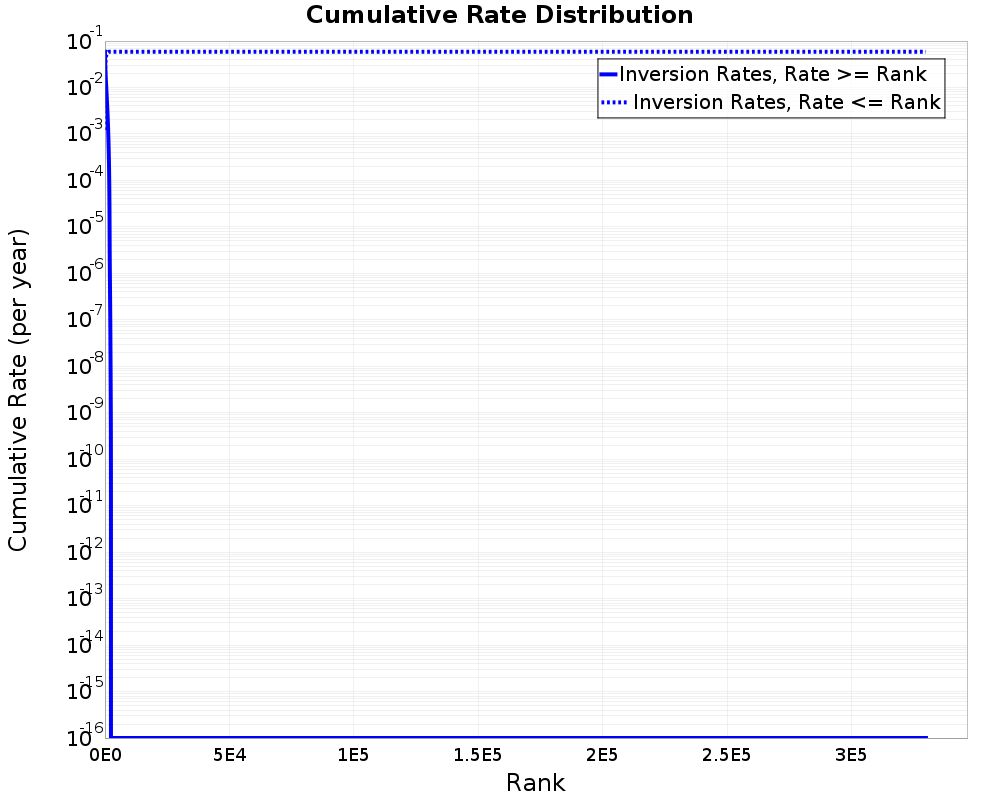
Rupture Rate Distribution
(top)
| Non-zero ruptures | 2,394 (0.73%) |
|---|
| Avg. # perturbations per rupture | 35.02289 |
| Avg. # perturbations per non-zero rupture | 4826.5605 |
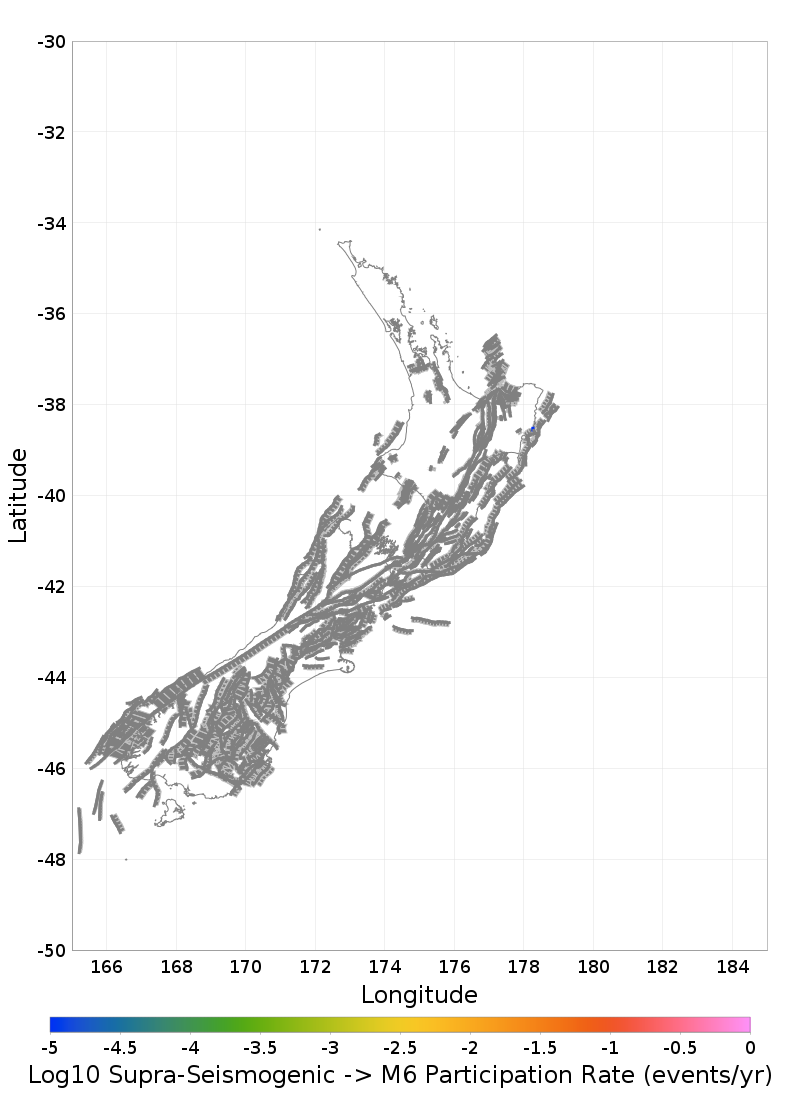
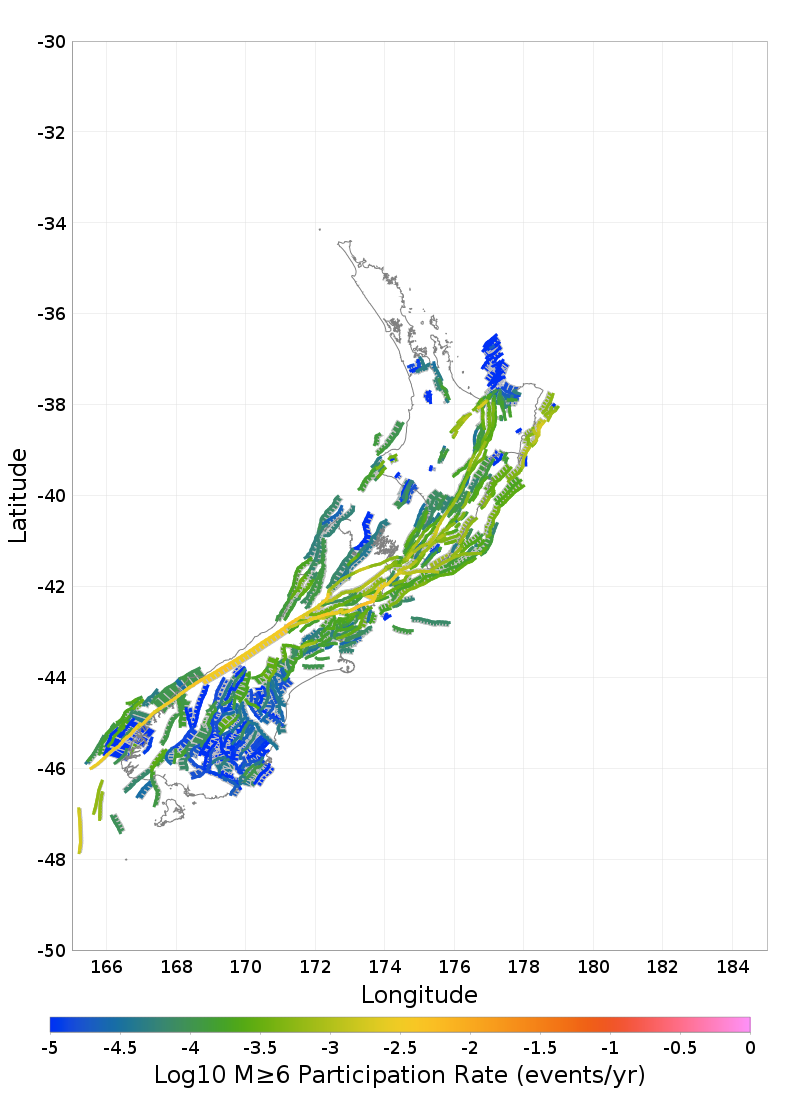
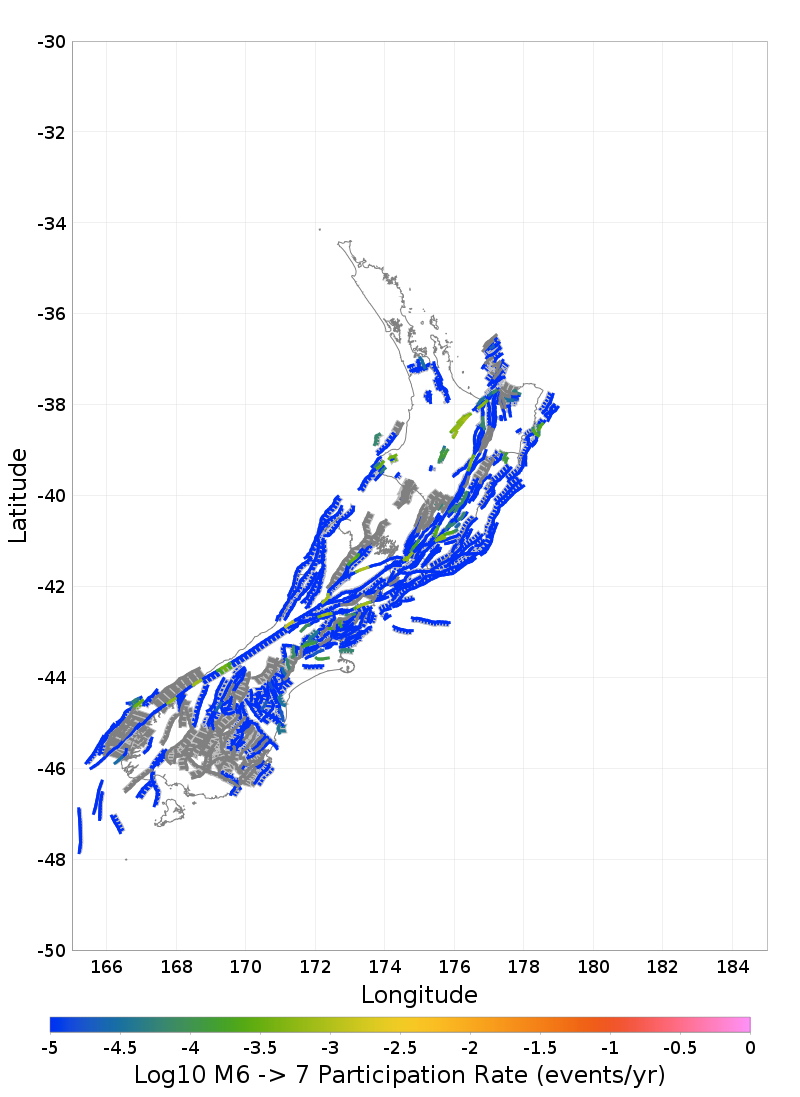
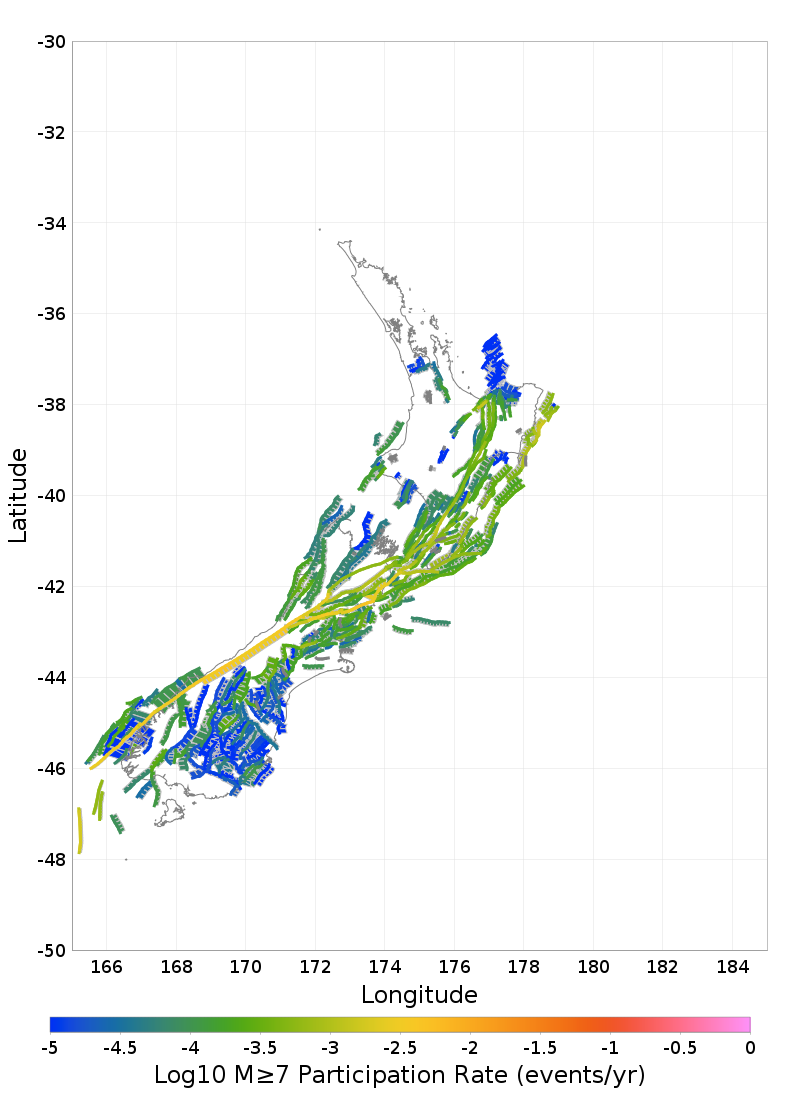
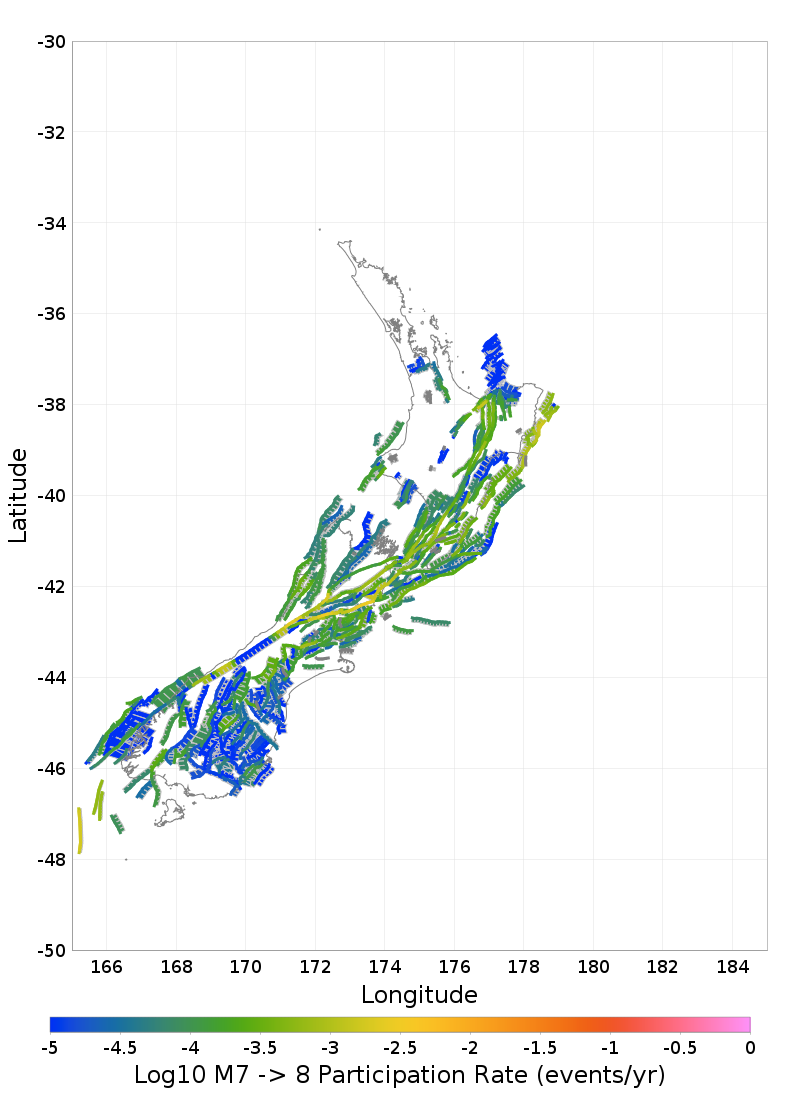
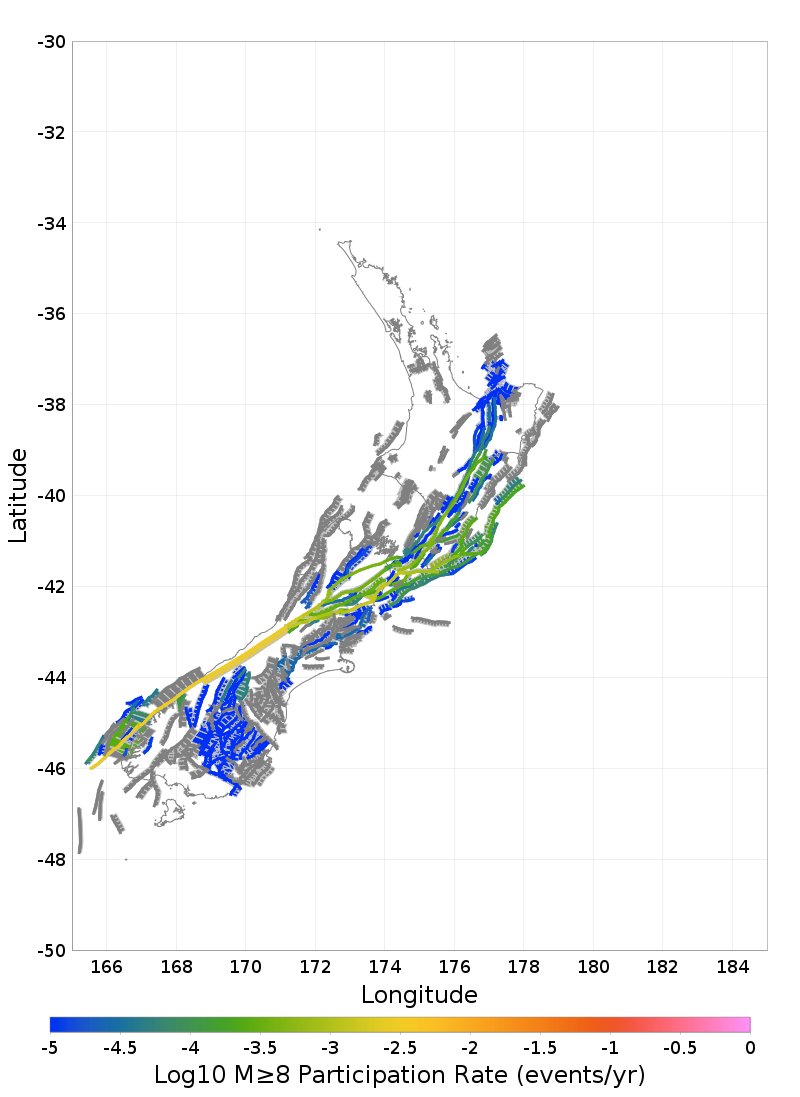
Participation Rates
(top)
Section b-values
(top)
Subsection b-values
(top)
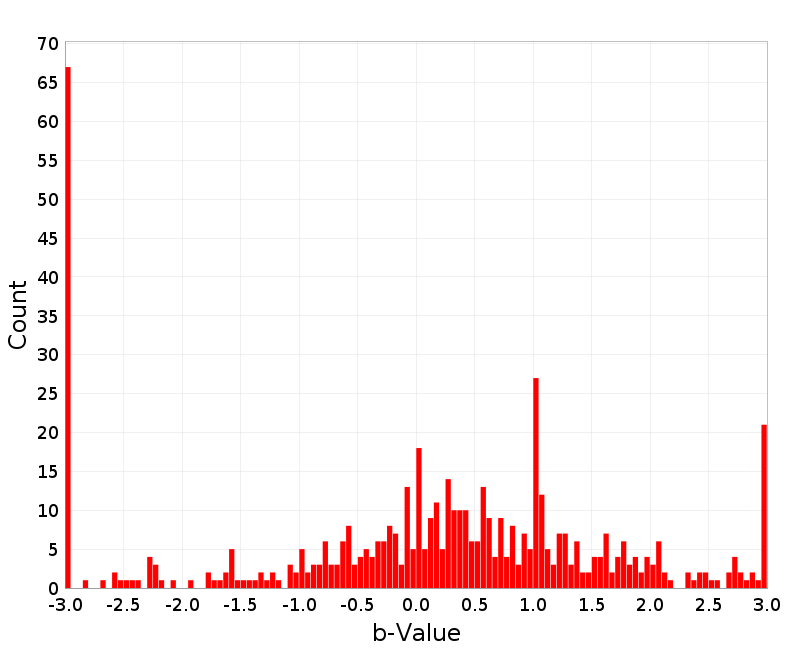
These plots estimate a Gutenberg-Richter b-value for each subsection and parent section nucleation MFD. This is a rough approximation, and is intended primarily for model comparisons.
Download b-value CSV file: sect_b_values.csv

| b-Value Distribution | b-Value Rate-Dependence |
|---|
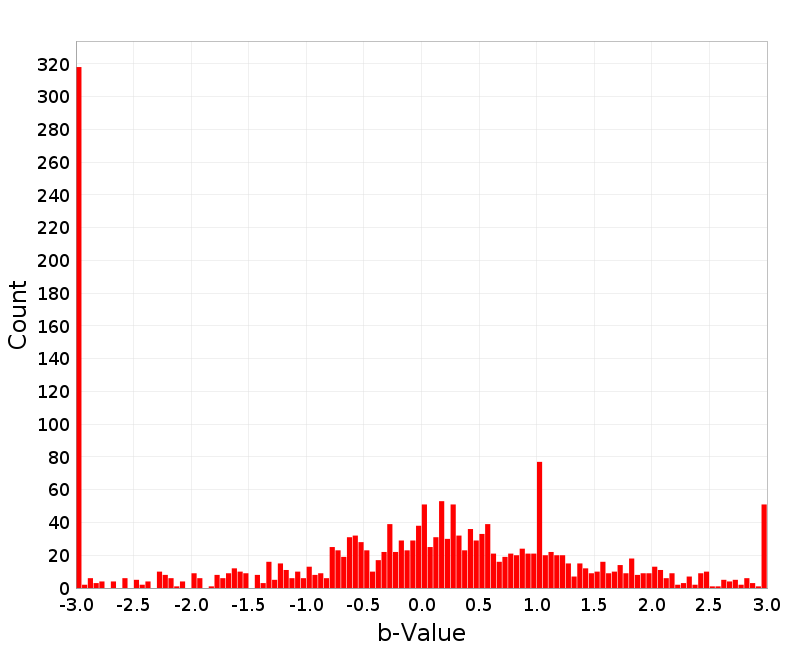 | 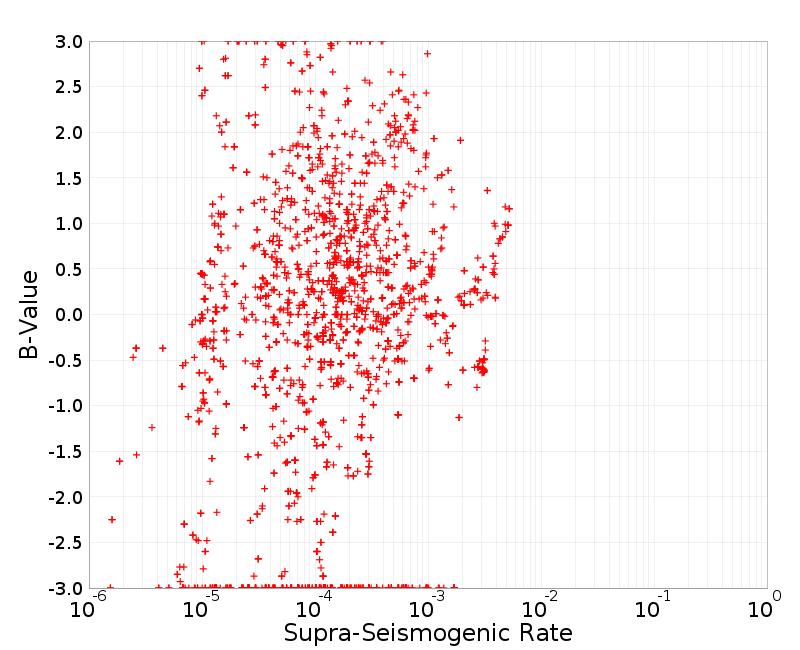 |
Parent Section b-values
(top)
Download b-value CSV file: parent_sect_b_values.csv
| b-Value Distribution | b-Value Rate-Dependence |
|---|
 |  |
Rupture Scalar Histograms
(top)
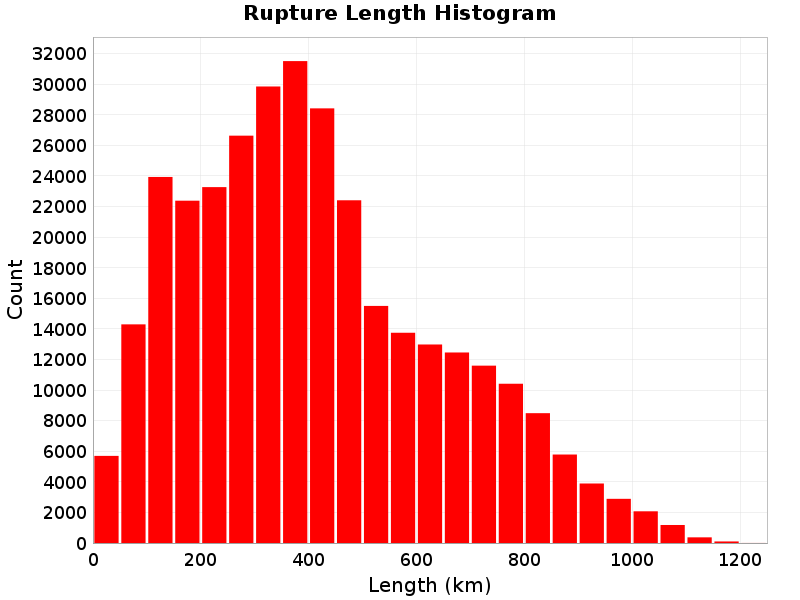
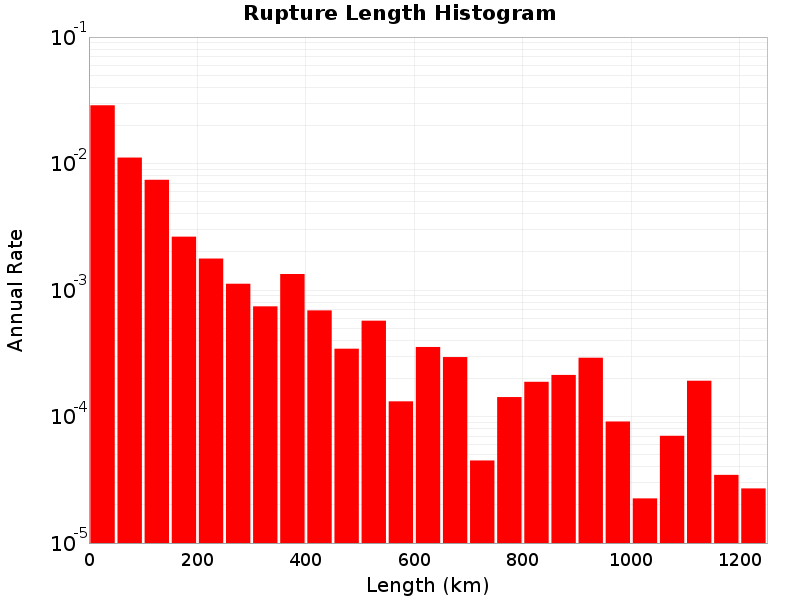
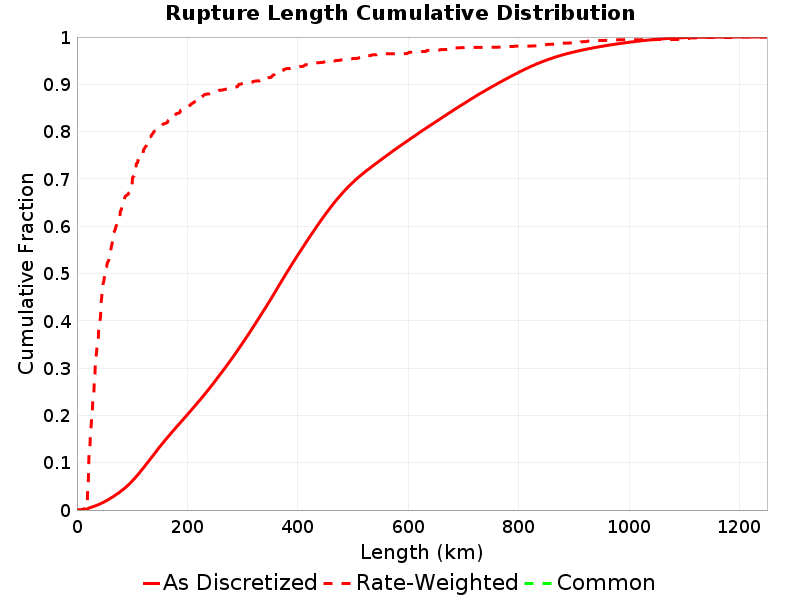
Rupture Length
(top)
Total length (km) of the rupture, not including jumps or gaps.
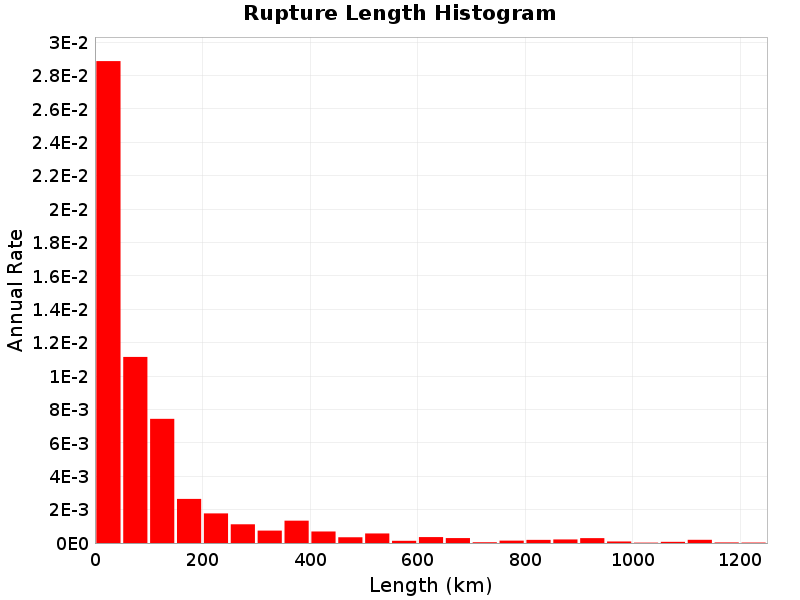
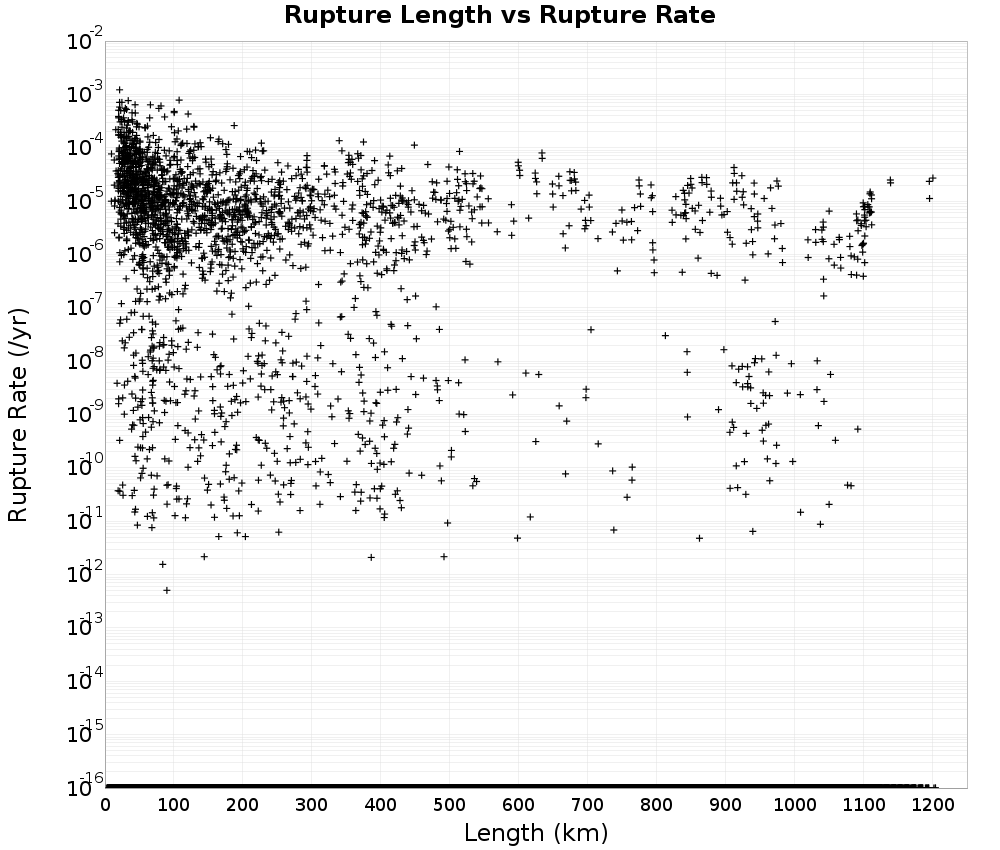
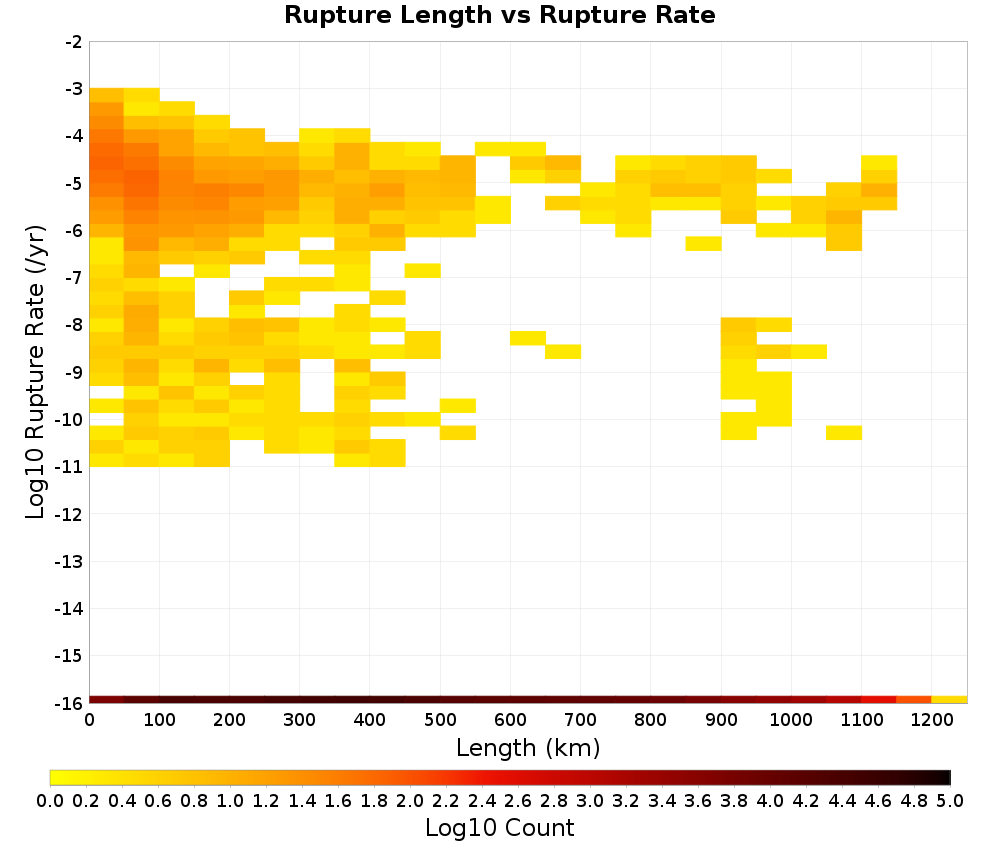
Rupture Length vs Rupture Rate
(top)
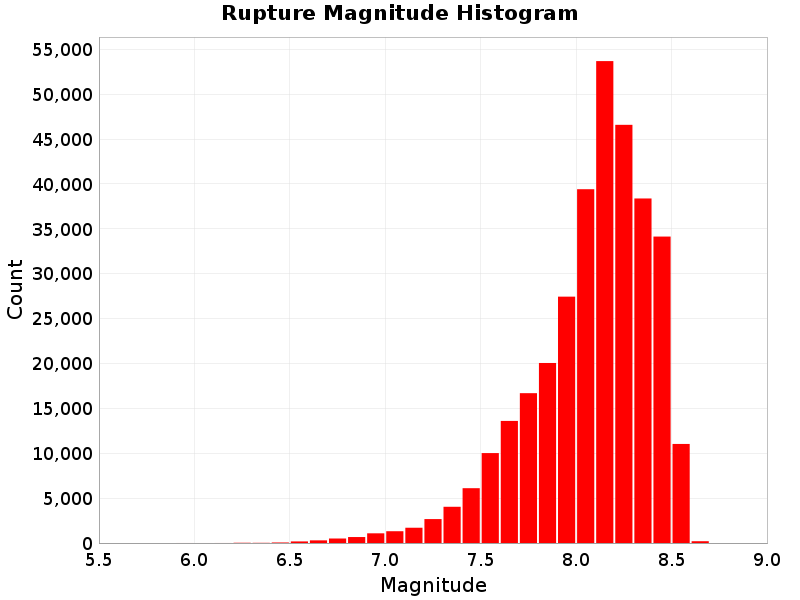
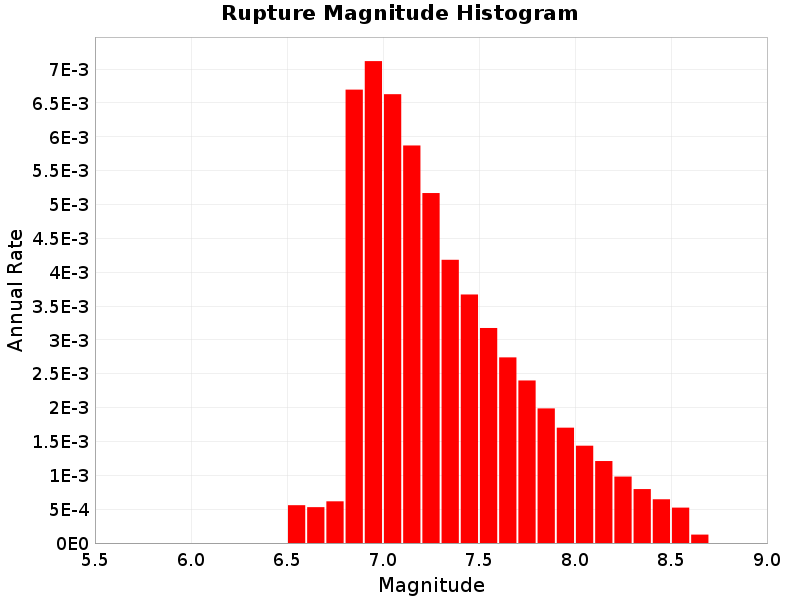
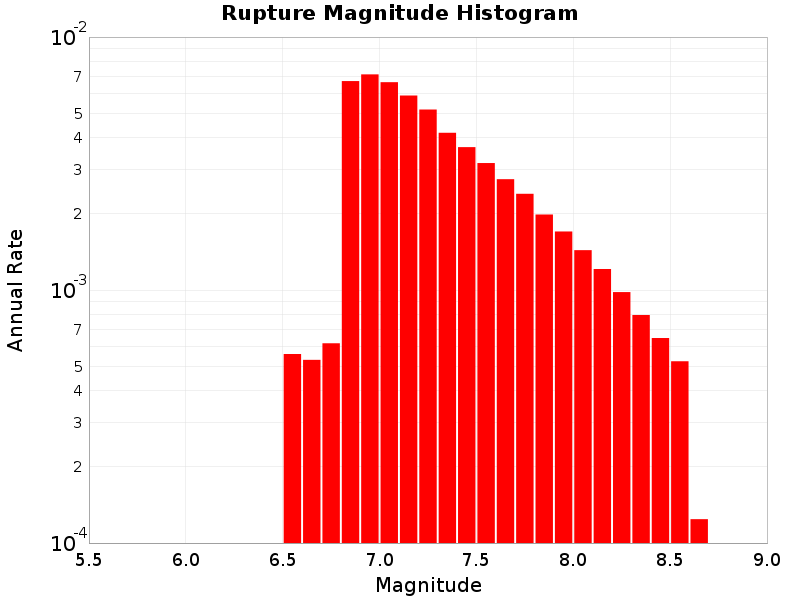
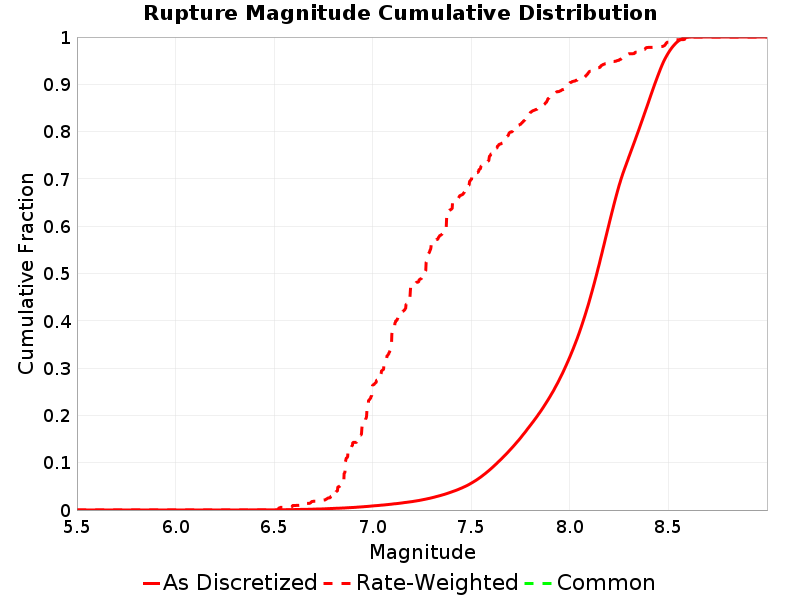
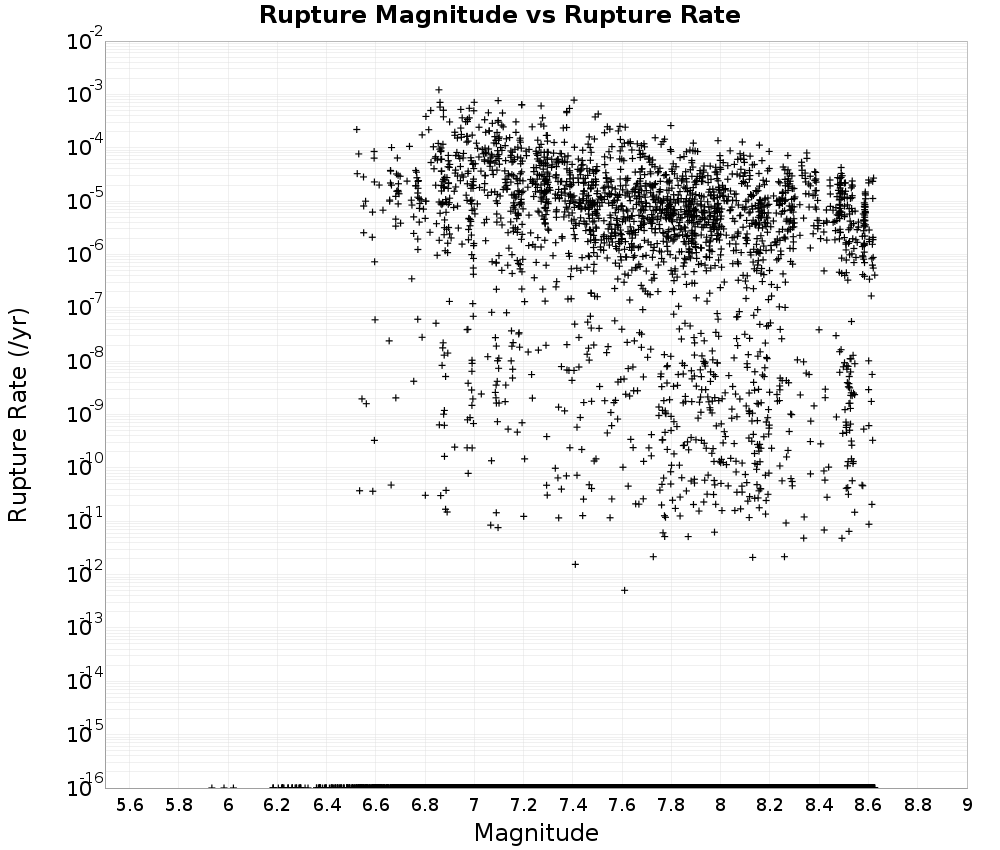
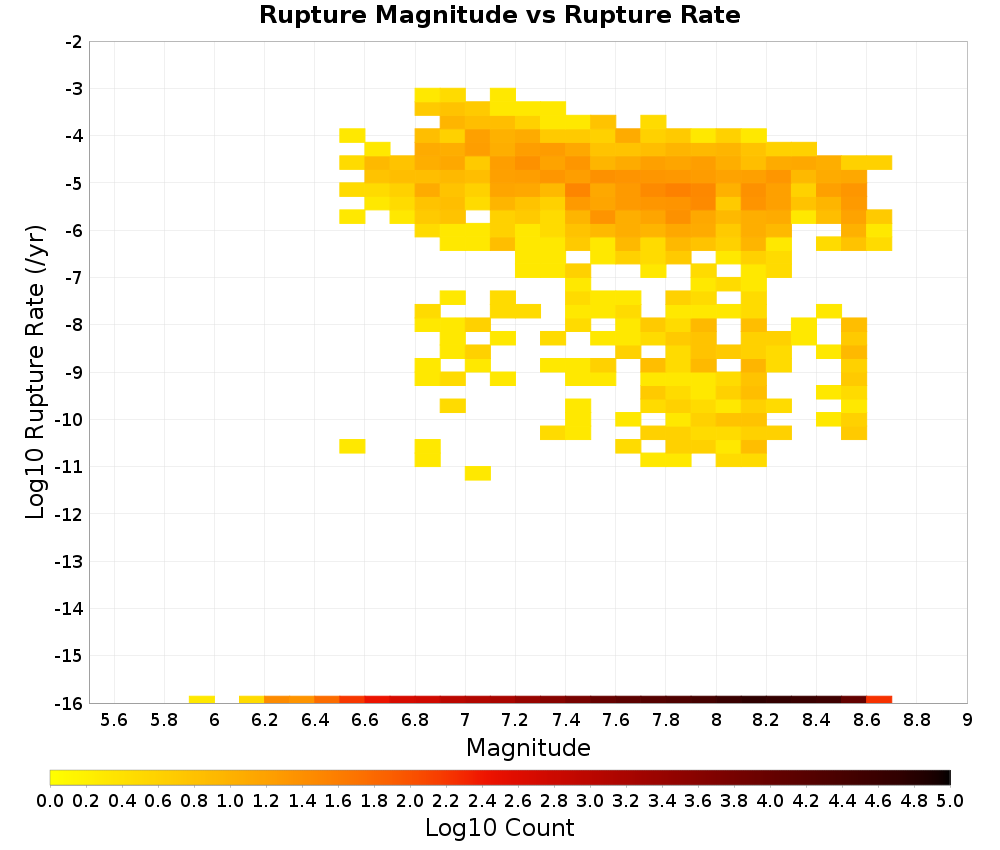
Rupture Magnitude
(top)
Magnitude of the rupture.
Rupture Magnitude vs Rupture Rate
(top)
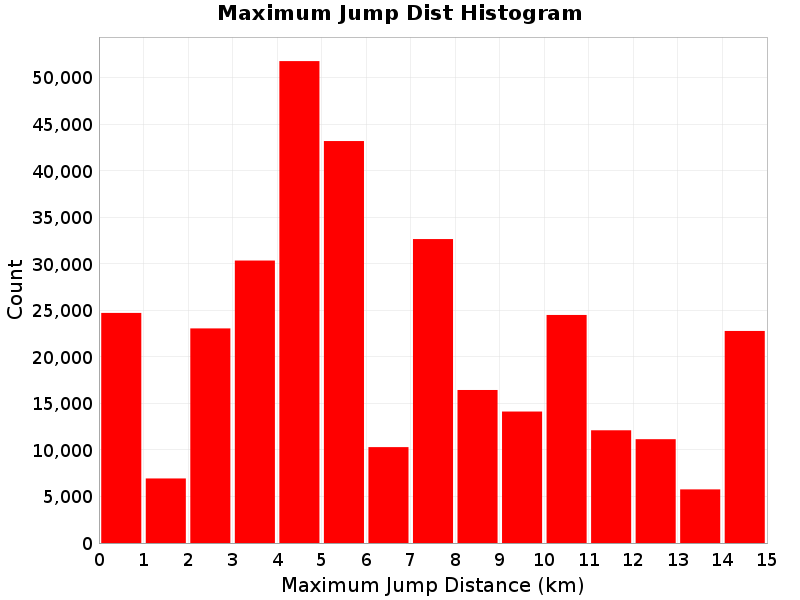
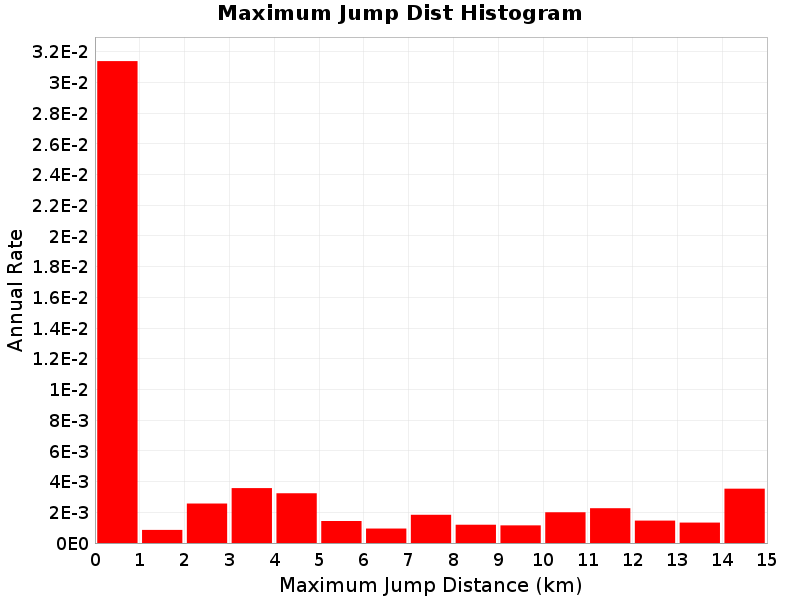
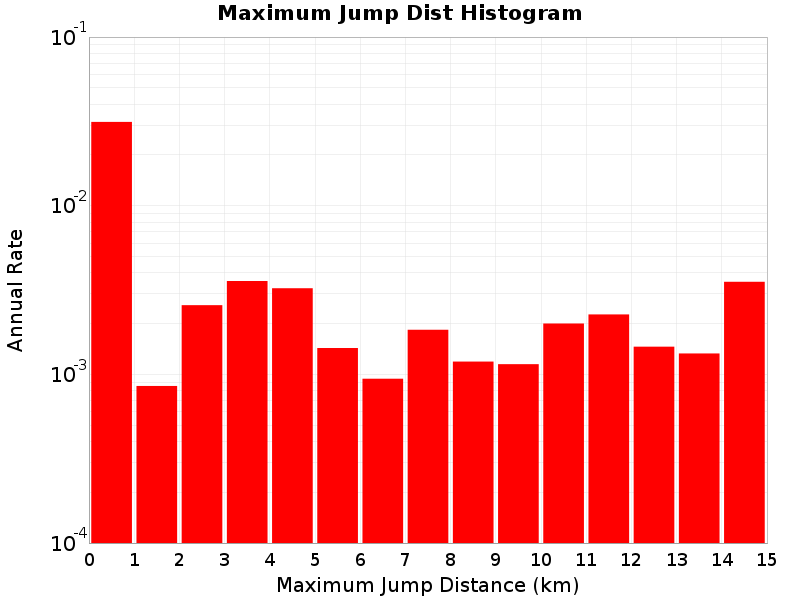
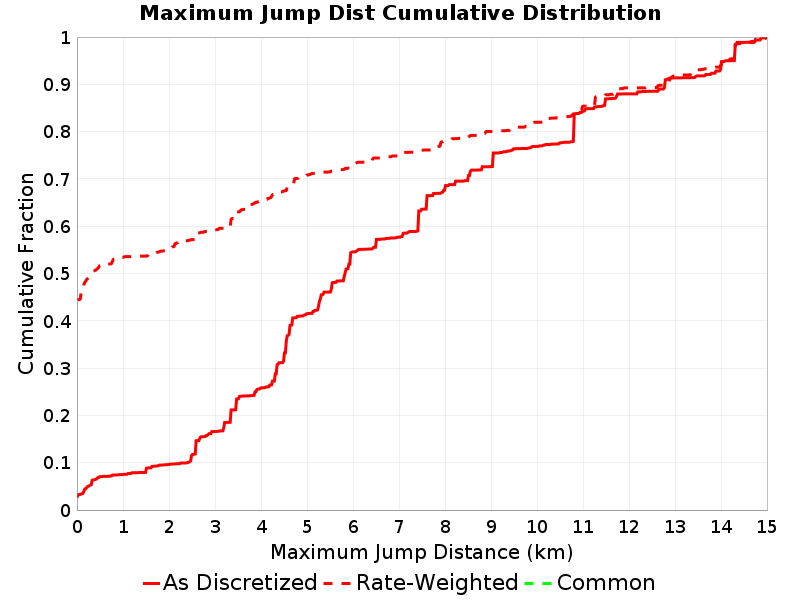
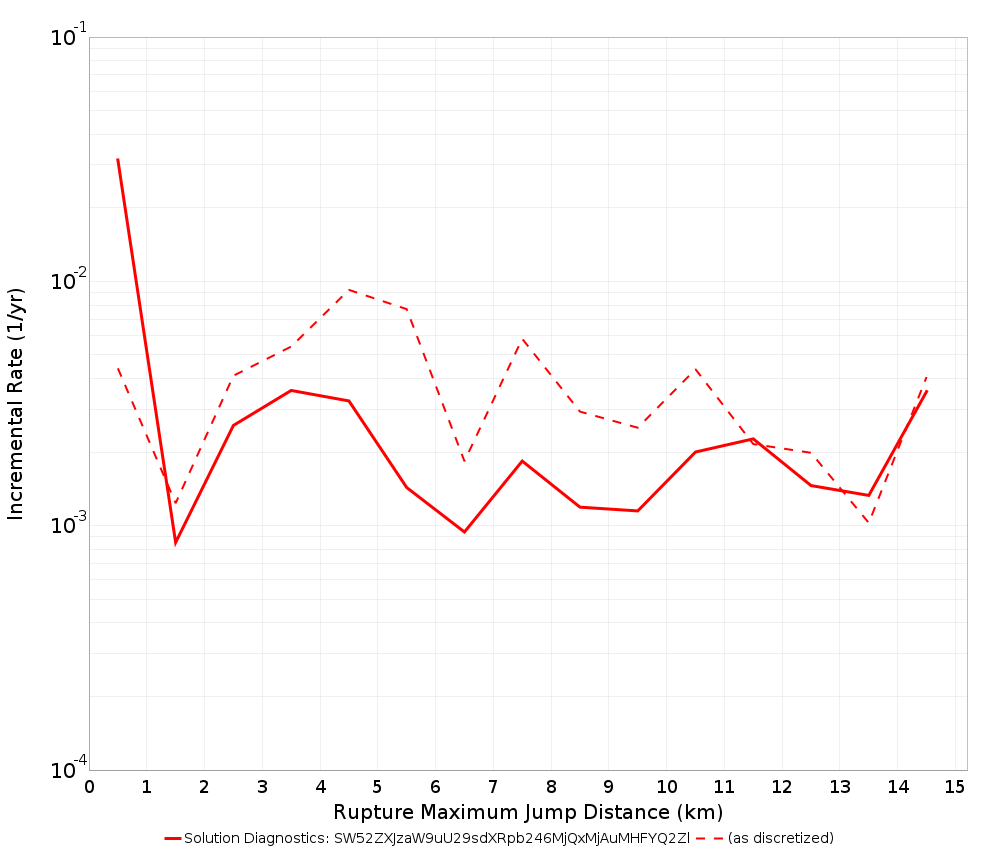
Maximum Jump Dist
(top)
The maximum jump distance in the rupture.
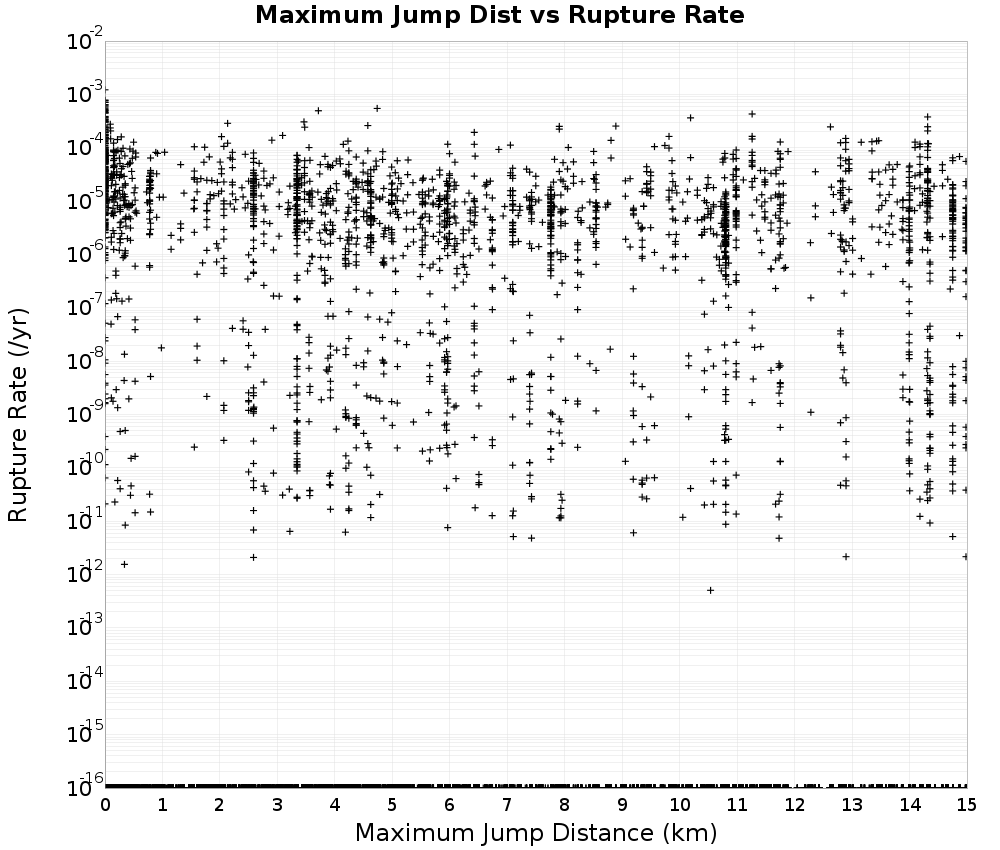
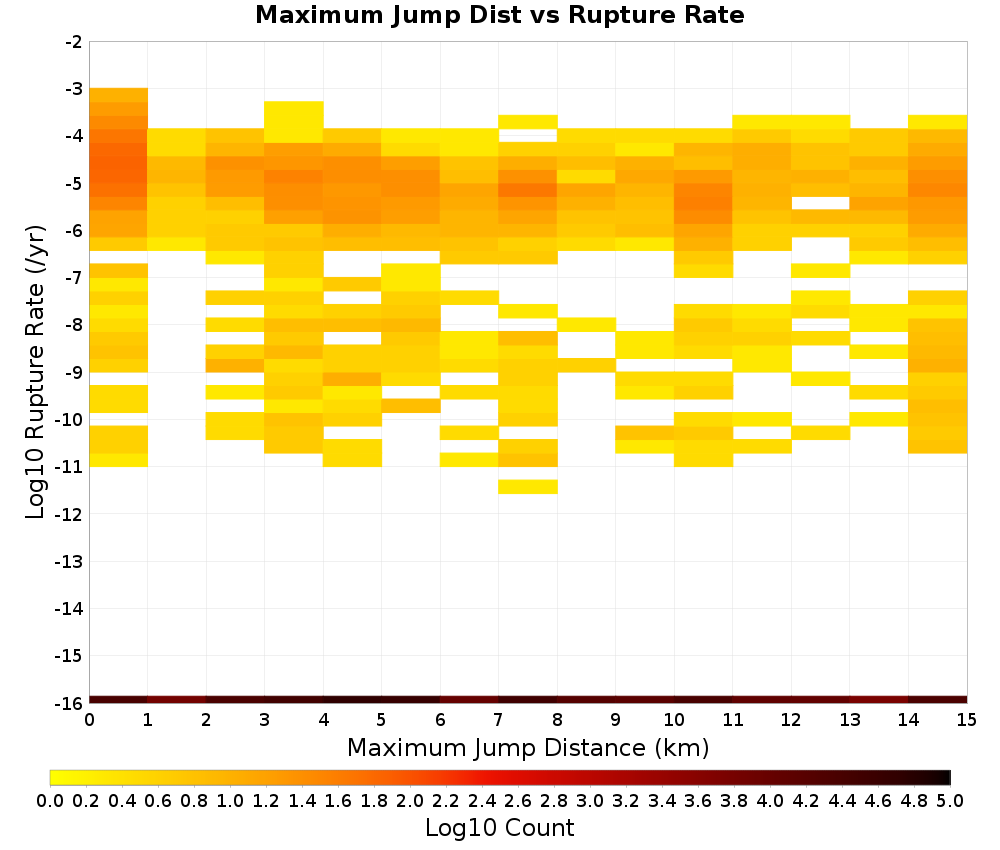
Maximum Jump Dist vs Rupture Rate
(top)
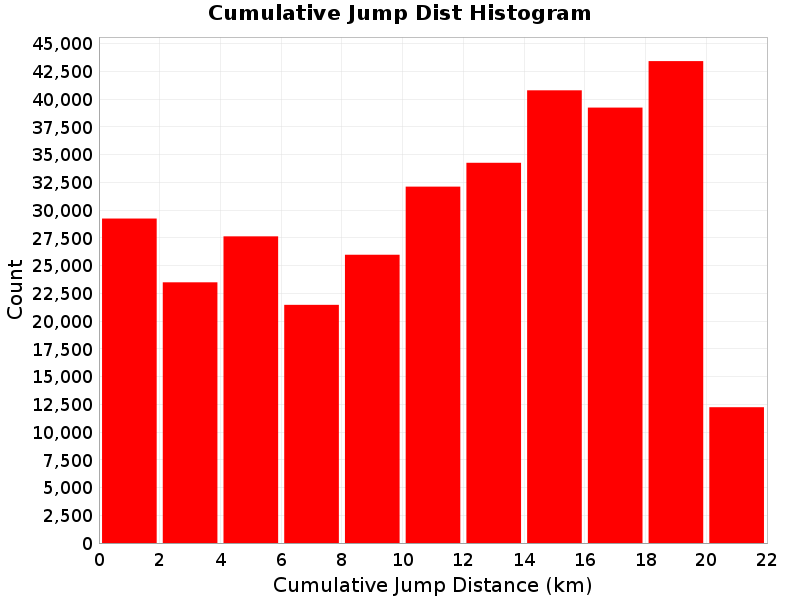
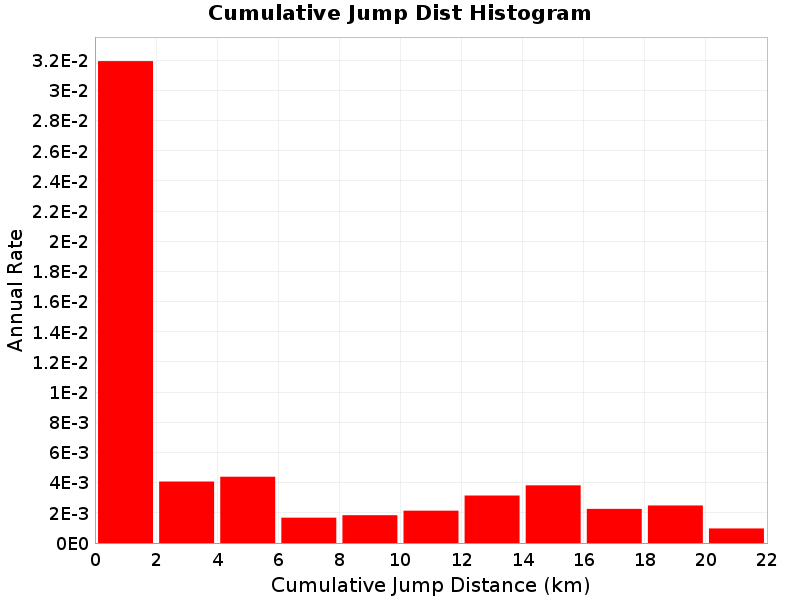
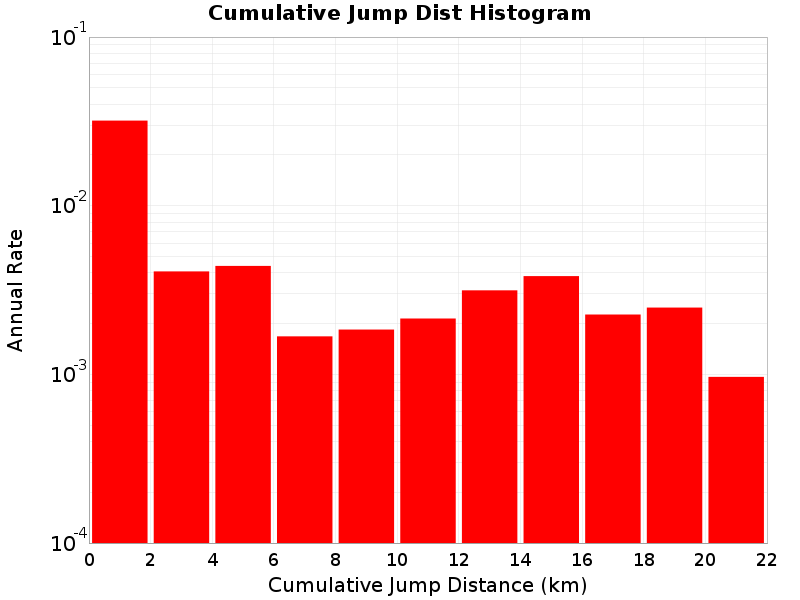
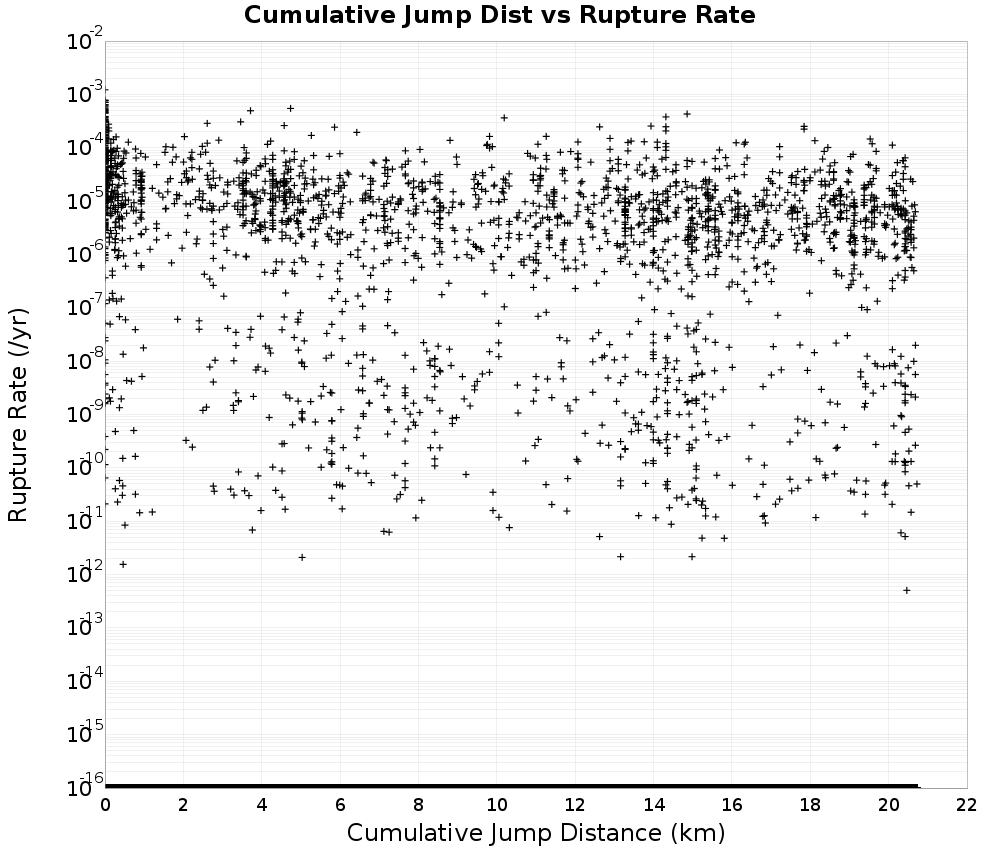
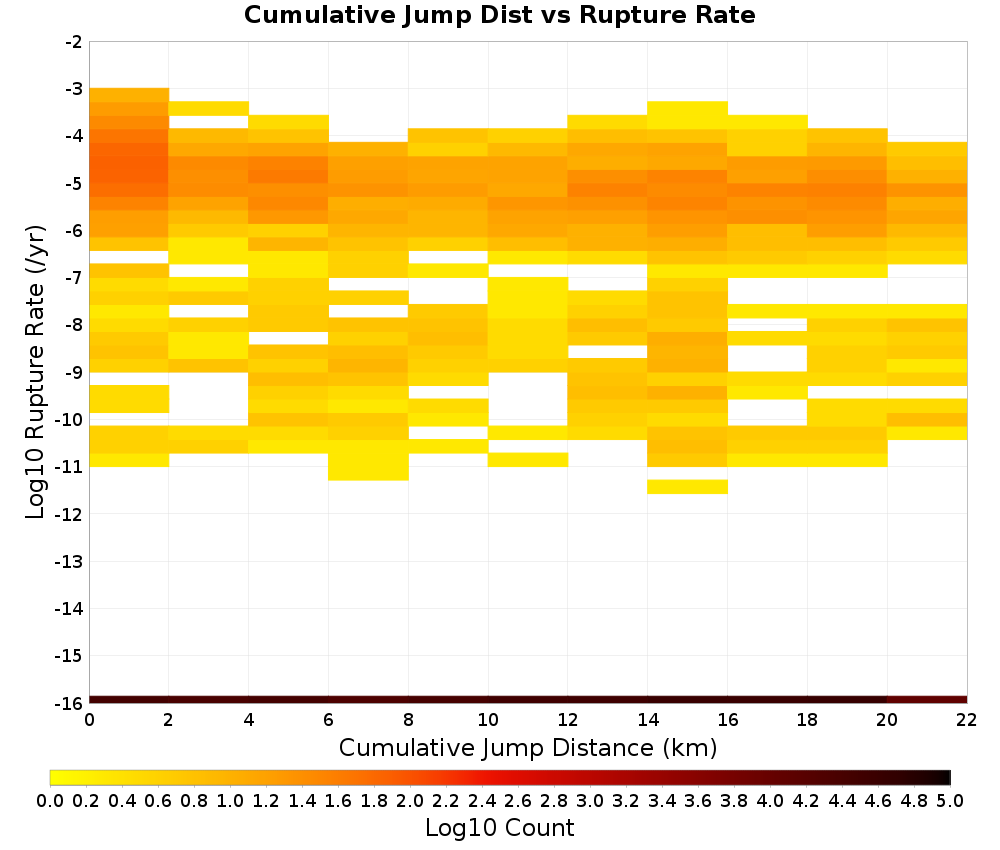
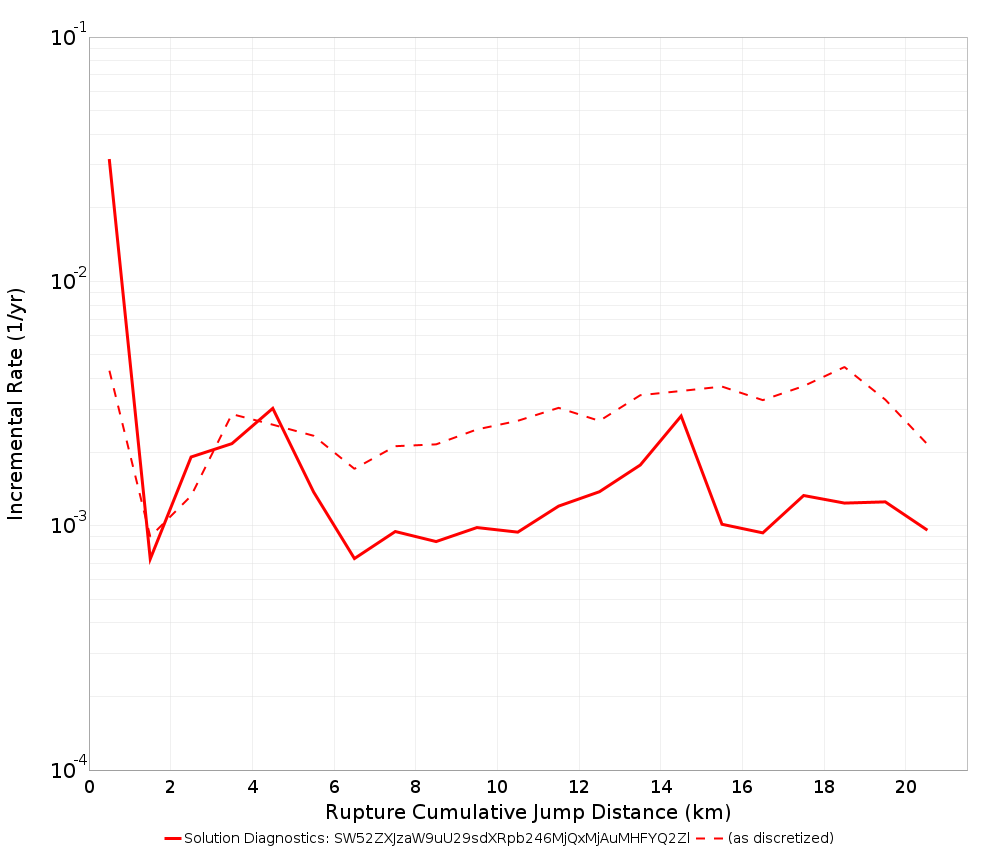
Cumulative Jump Dist
(top)
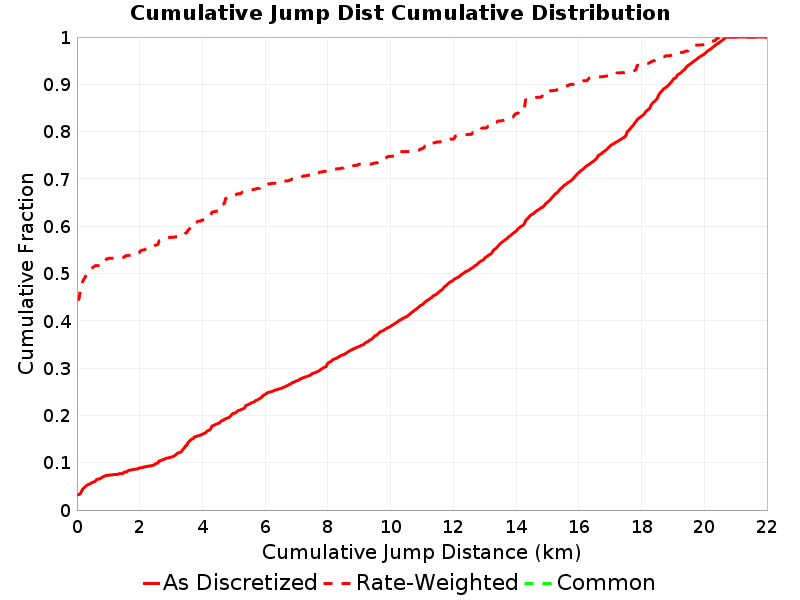
The total cumulative jump distance summed over all jumps in the rupture.
Cumulative Jump Dist vs Rupture Rate
(top)
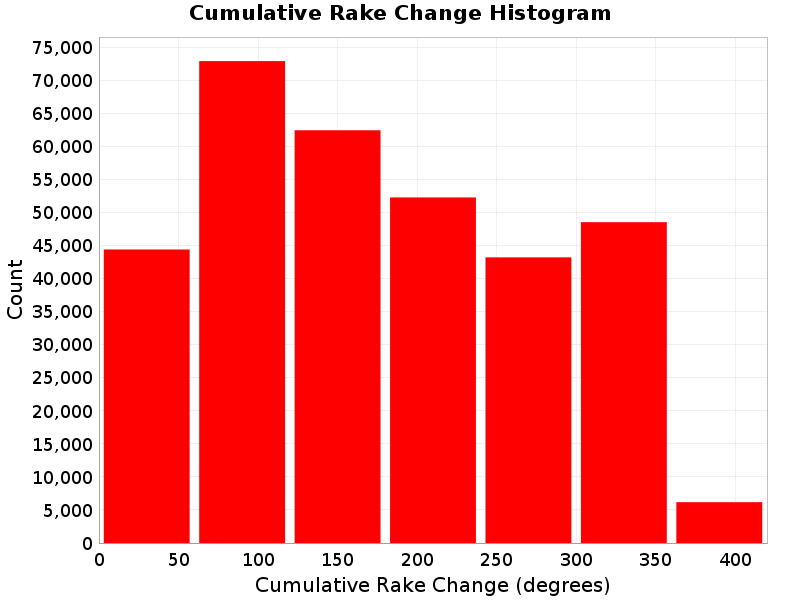
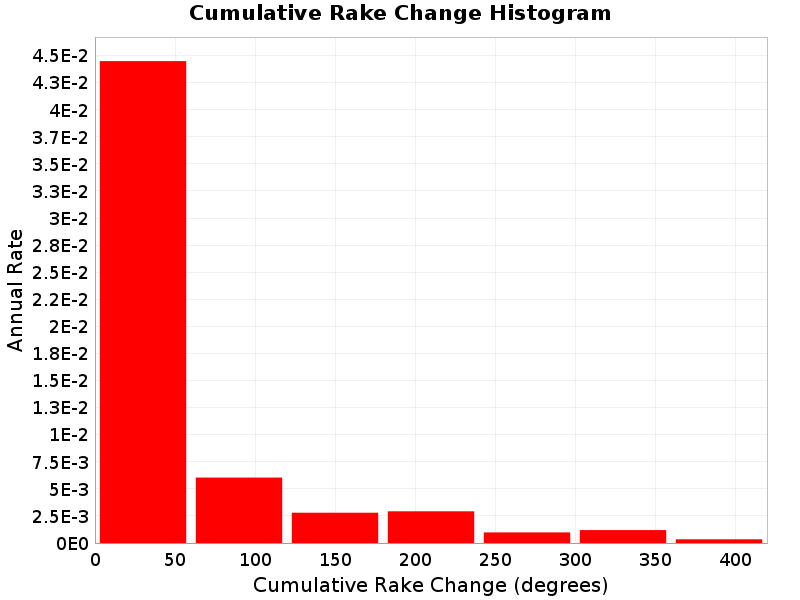
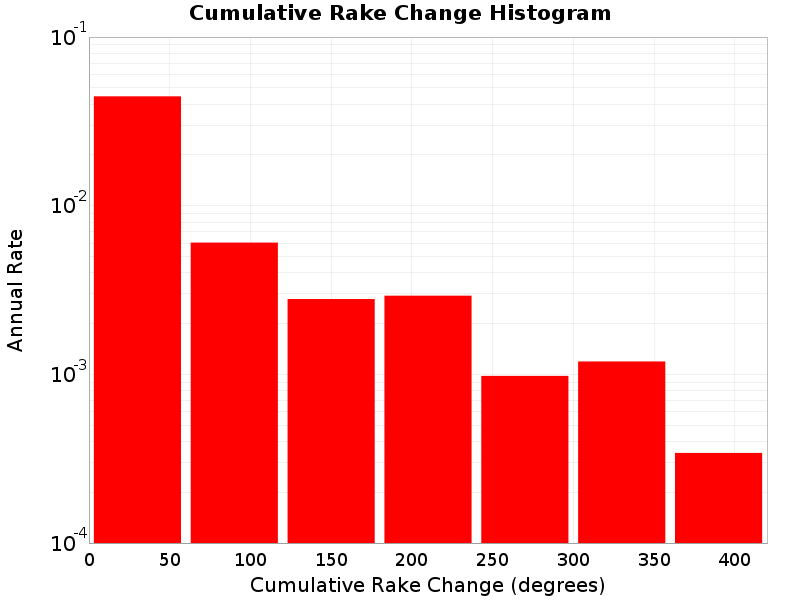
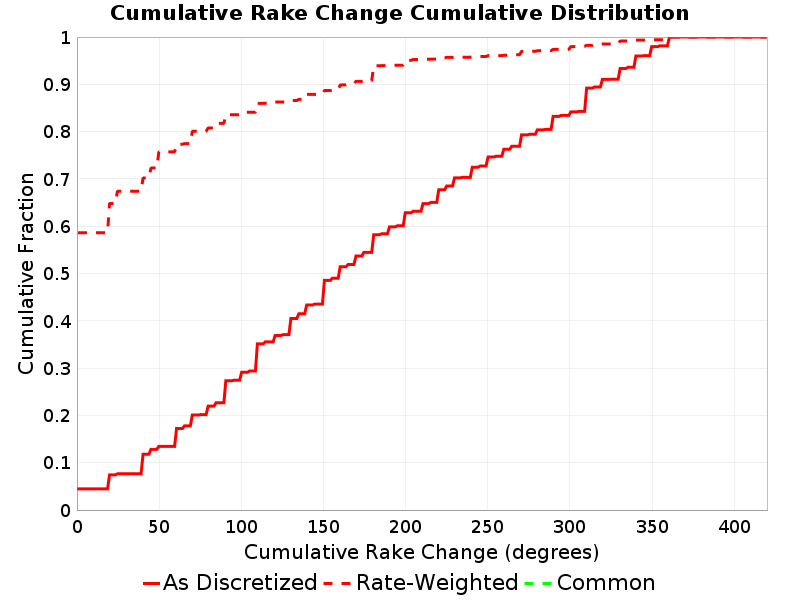
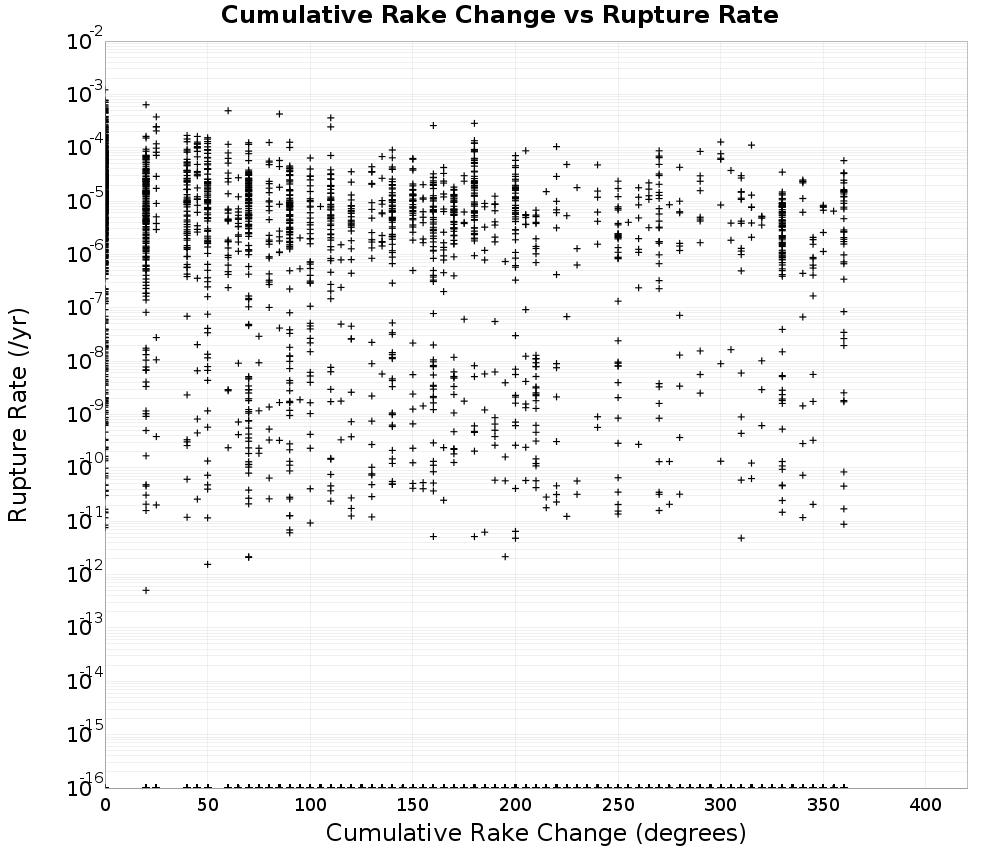
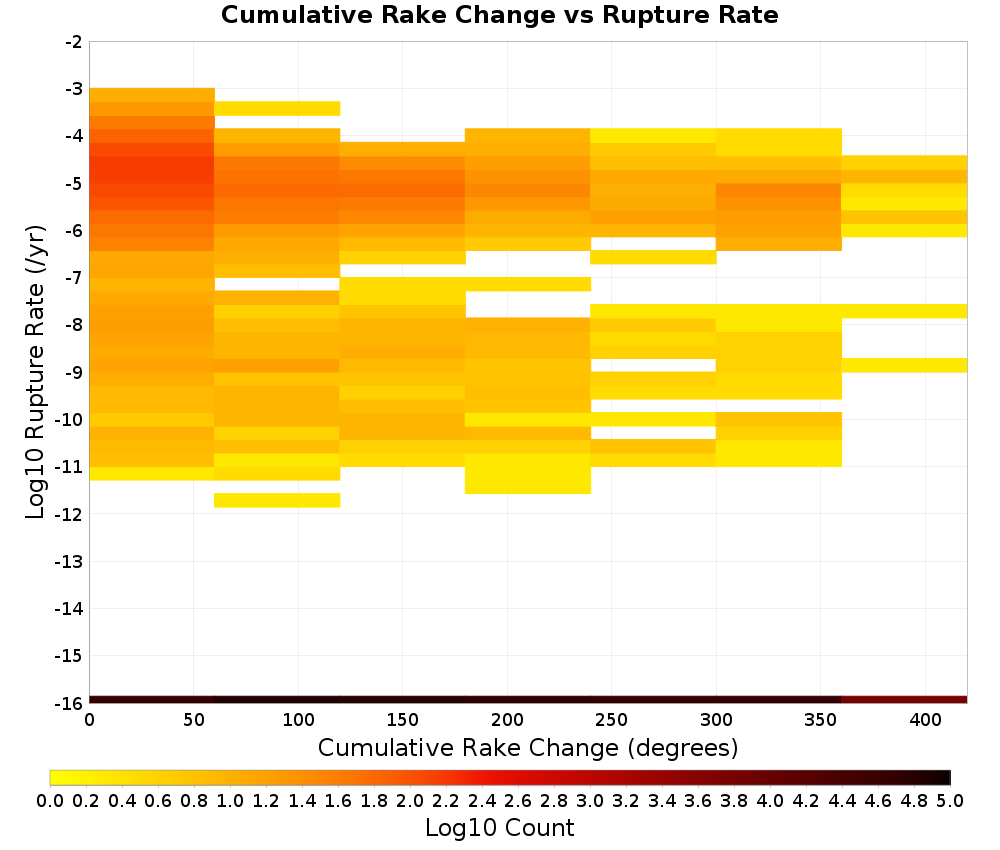
Cumulative Rake Change
(top)
Cumulative rake change for this rupture.
Cumulative Rake Change vs Rupture Rate
(top)
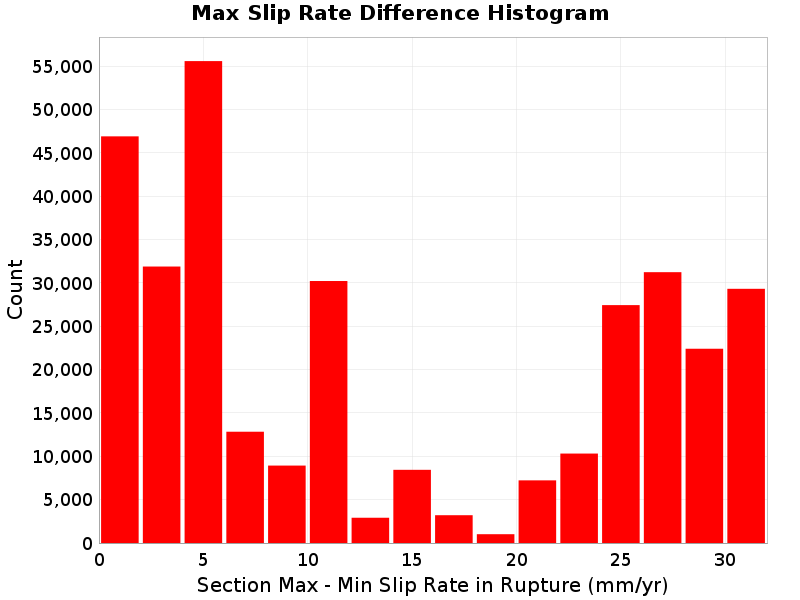
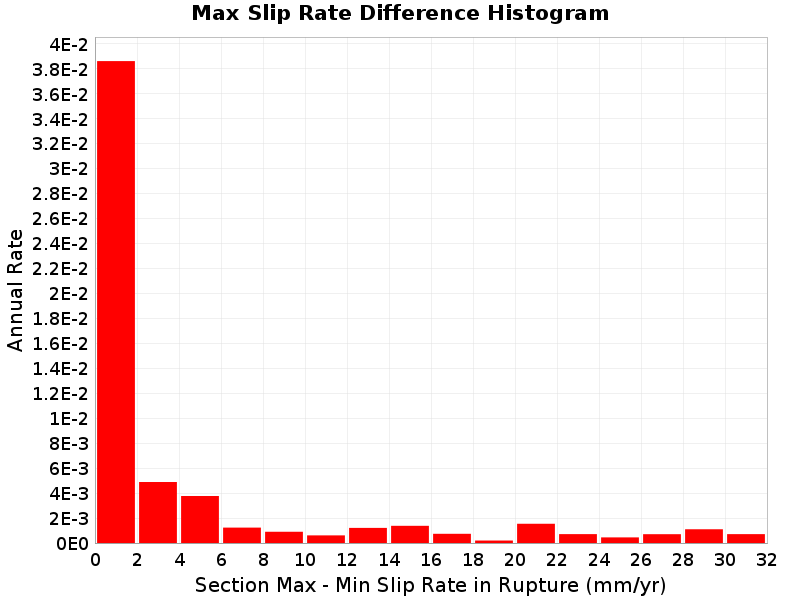
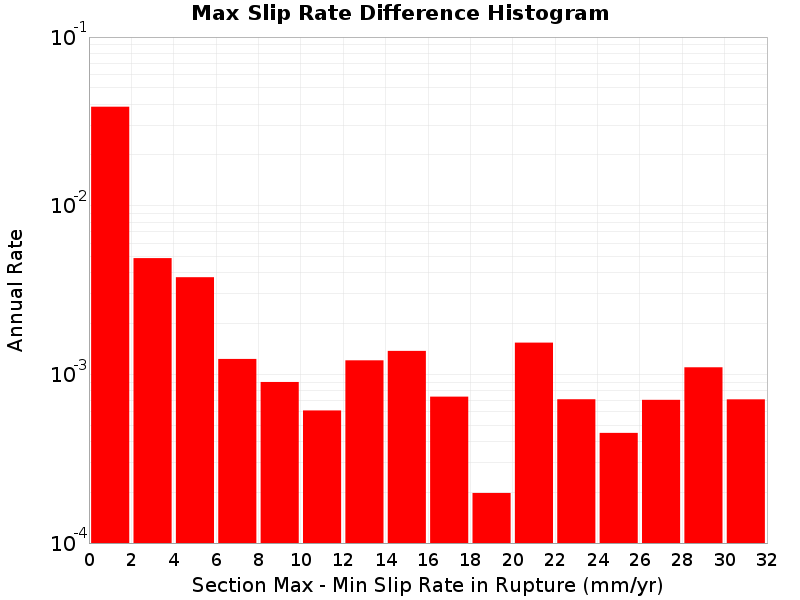
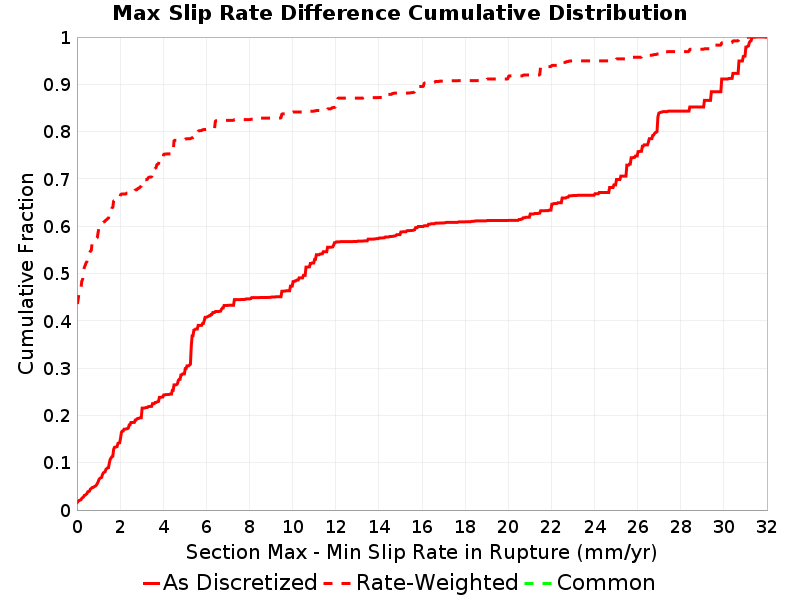
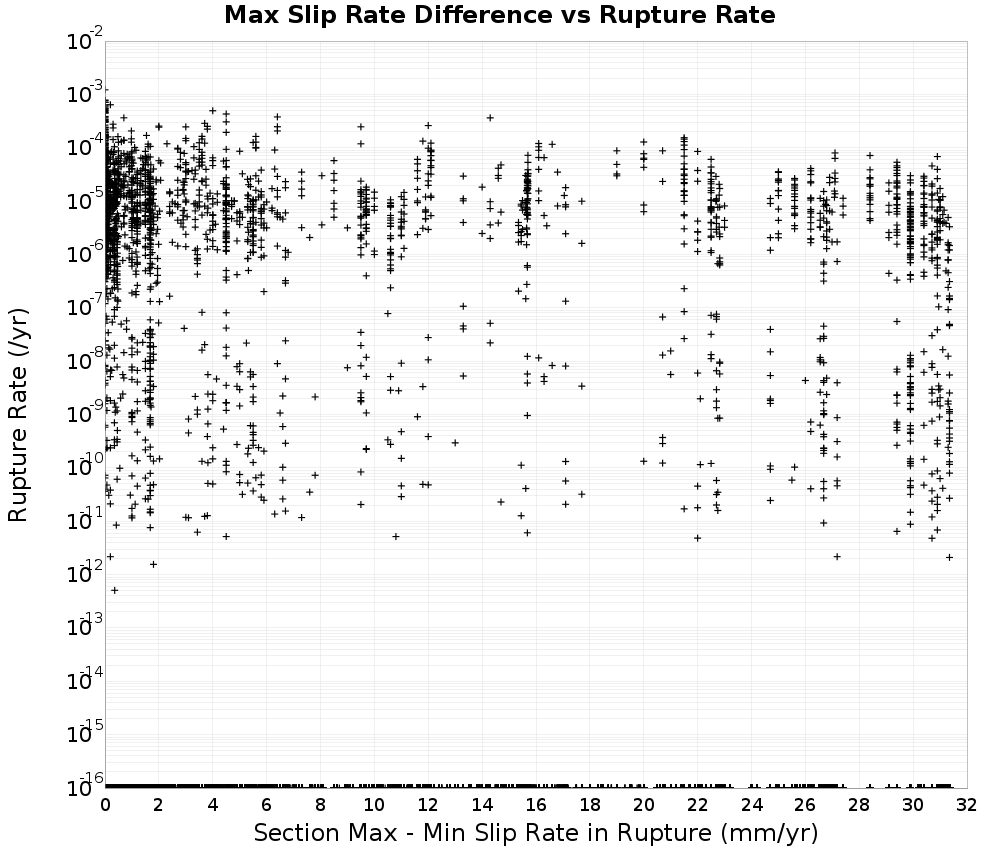
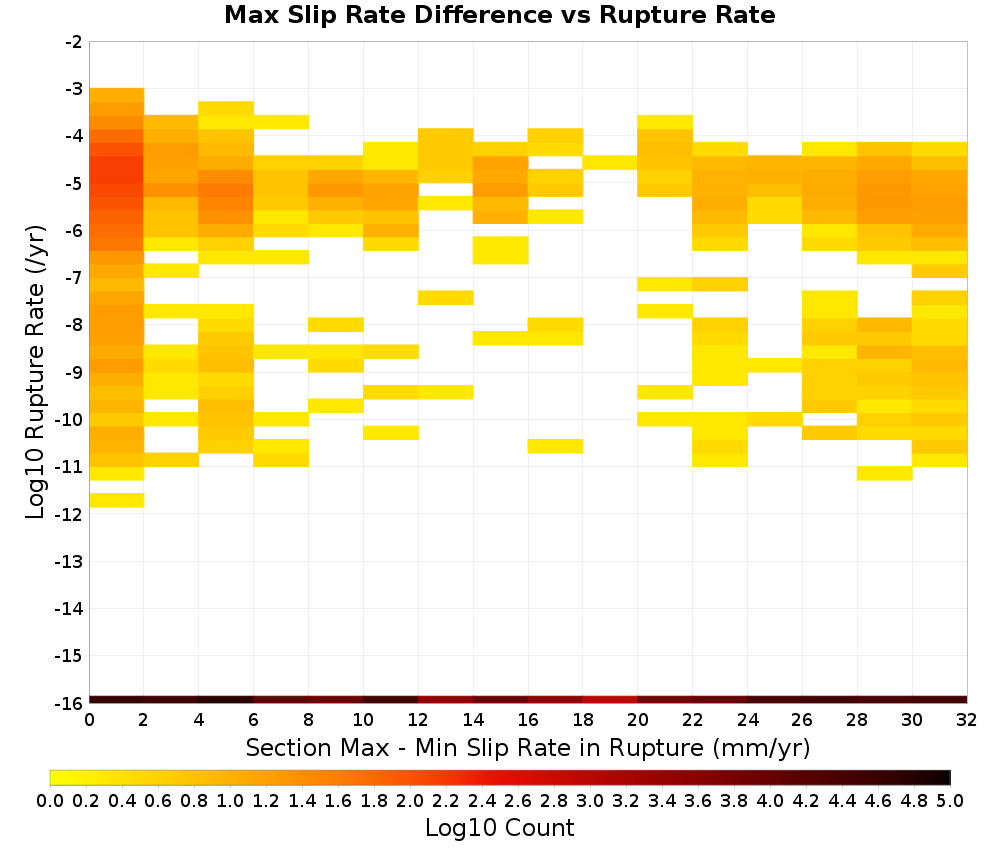
Max Slip Rate Difference
(top)
The difference between the slip rate of the sections with the highest and lowest slip rate in the rupture.
Max Slip Rate Difference vs Rupture Rate
(top)
Attached Modules
(top)
List of all modules that have been attached to this Solution.
Note: Modules classes in the standard modules package, org.opensha.sha.earthquake.faultSysSolution.modules, have been shortened to omit the package name.
Rupture Set Modules
(top)
| Name | Implementing Class |
|---|
| Single-Strand Cluster Ruptures | ClusterRuptures$SingleStranded |
| Section Distance-Azimuth Calculator | org.opensha.sha.earthquake.faultSysSolution.ruptures.util.SectionDistanceAzimuthCalculator |
| Logic Tree Branch | nz.cri.gns.NZSHM22.opensha.enumTreeBranches.NZSHM22_LogicTreeBranch |
| Polygon Fault Grid Associations | PolygonFaultGridAssociations$Precomputed |
| Rupture Connection Search | org.opensha.sha.earthquake.faultSysSolution.ruptures.util.RuptureConnectionSearch |
| Section Slip Rates | SectSlipRates$Precomputed |
| Section Areas | SectAreas$Default |
| Inversion Target MFDs | InversionTargetMFDs$Precomputed |
| Precomputed Average Slips | AveSlipModule$Precomputed |
| Modified Section Minimum Magnitudes | ModSectMinMags$Precomputed |
| NZSHM22_TvzSections | nz.cri.gns.NZSHM22.opensha.inversion.NZSHM22_TvzSections |
| OpenSHA Build Information | BuildInfoModule |
| Uniform Slip Along Rupture | SlipAlongRuptureModel$Uniform |
Solution Modules
(top)
| Name | Implementing Class |
|---|
| Annealing Progress | org.opensha.sha.earthquake.faultSysSolution.inversion.sa.completion.AnnealingProgress |
| OpenSHA Build Information | BuildInfoModule |
| Sub-Seismogenic On-Fault MFDs | SubSeismoOnFaultMFDs |
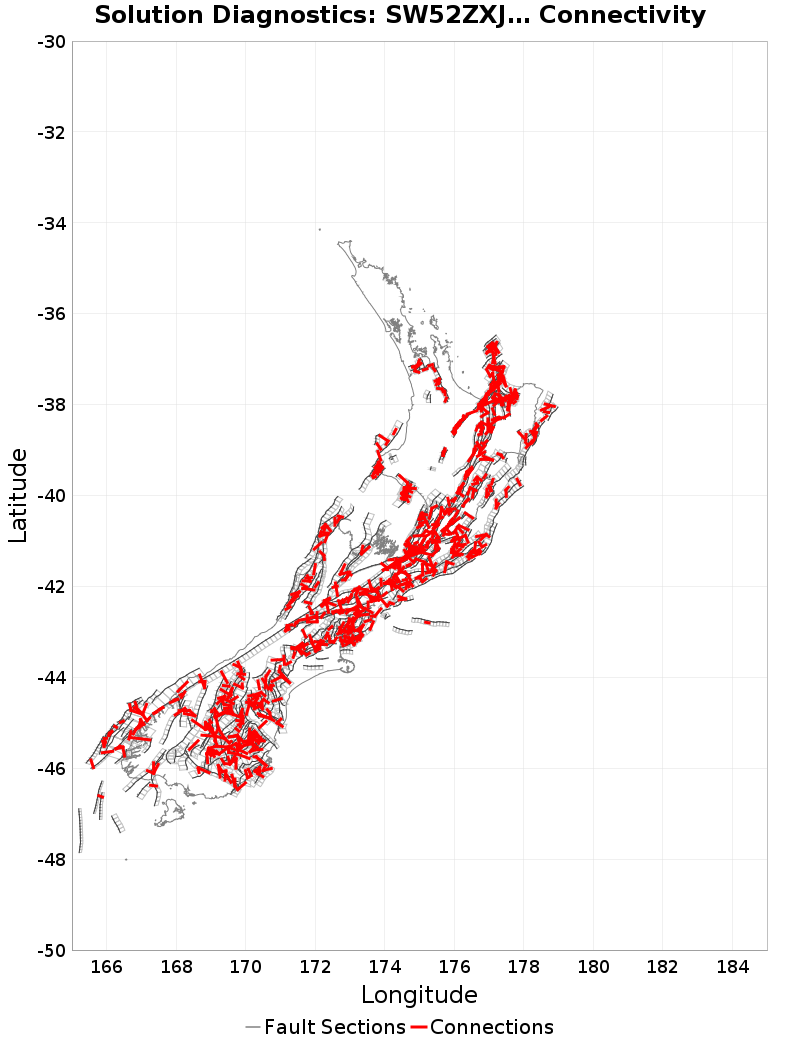
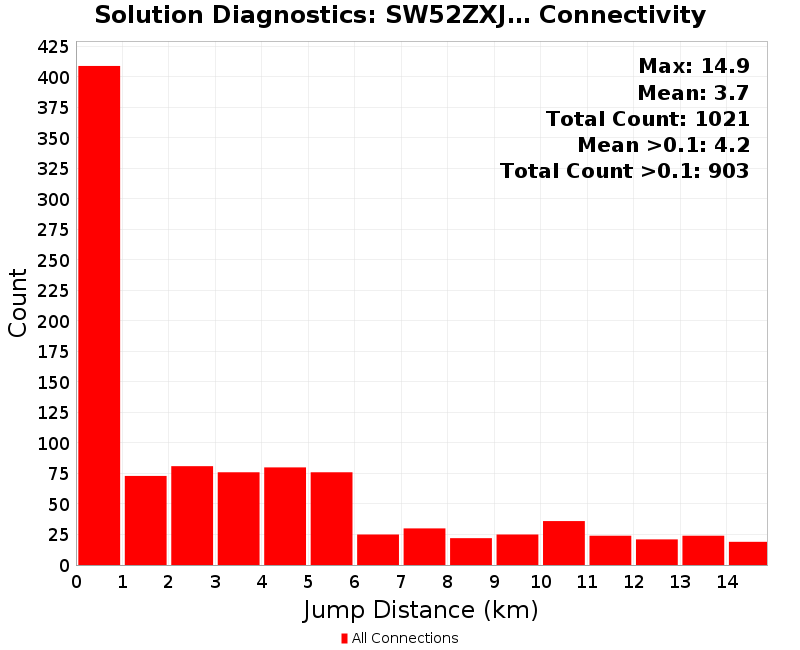
Fault Section Connections
(top)
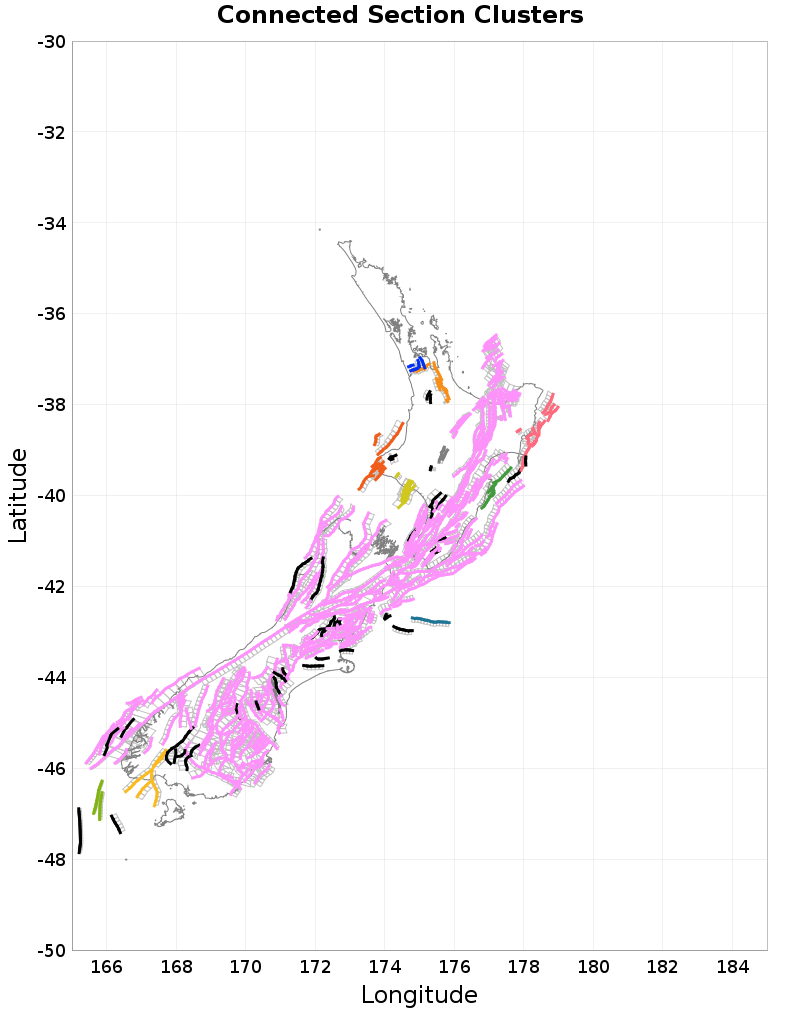
Connected Clusters
(top)
Connected clusters of fault sections, where all sections plotted in a given color connect with all other sections of the same color through ruptures. There may not be any single rupture that connects all such sections, but rather, chains of ruptures connect the sections. Only the first 10 clusters are plotted, with smaller clusters plotted in gray, and fully isolated faults plotted in black.
| Rank | Sections | Parent Sections | Ruptures |
|---|
| 1 | 1,674 (80.71%) | 443 (79.53%) | 327,822 (99.36%) |
| 2 | 48 (2.31%) | 13 (2.33%) | 314 (0.10%) |
| 3 | 39 (1.88%) | 15 (2.69%) | 691 (0.21%) |
| 4 | 27 (1.30%) | 10 (1.80%) | 174 (0.05%) |
| 5 | 26 (1.25%) | 5 (0.90%) | 134 (0.04%) |
| 6 | 26 (1.25%) | 9 (1.62%) | 107 (0.03%) |
| 7 | 21 (1.01%) | 2 (0.36%) | 104 (0.03%) |
| 8 | 19 (0.92%) | 6 (1.08%) | 112 (0.03%) |
| 9 | 12 (0.58%) | 2 (0.36%) | 55 (0.02%) |
| 10 | 12 (0.58%) | 5 (0.90%) | 20 (0.01%) |
| 11->13 | 18 (0.87%) | 5 (0.90%) | 50 (0.02%) |
| 42 isolated | 152 (7.33%) | 42 (7.54%) | 338 (0.10%) |
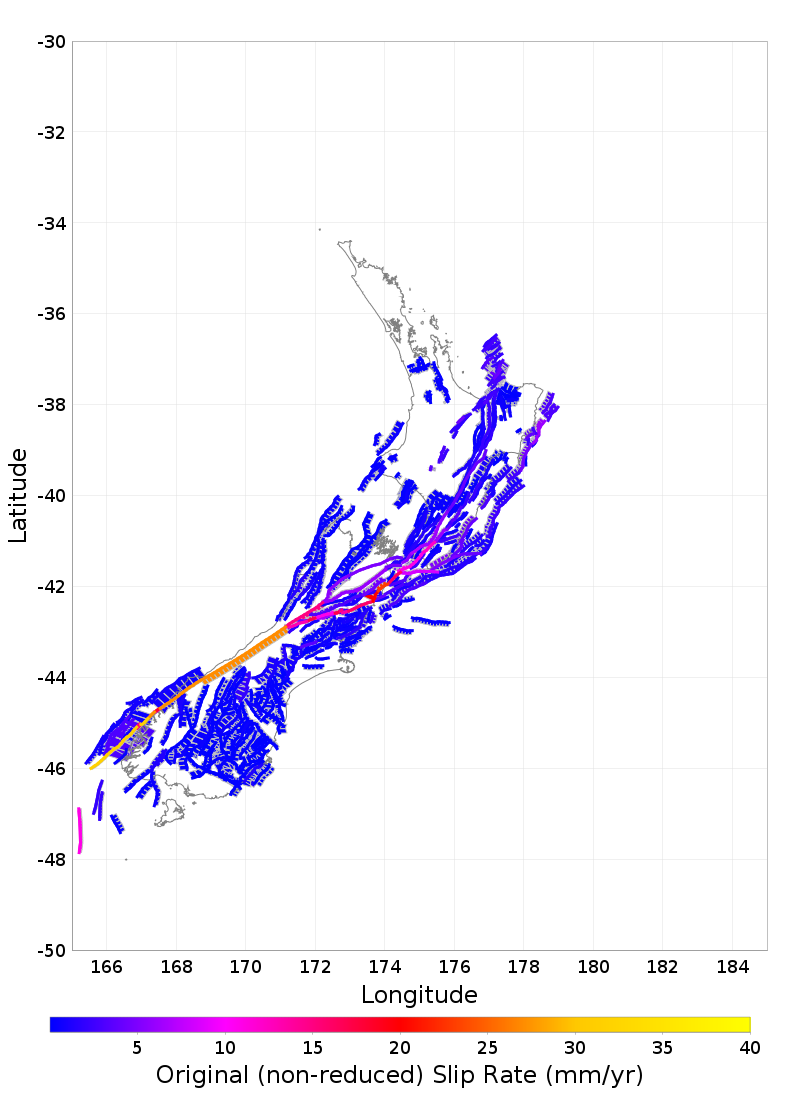
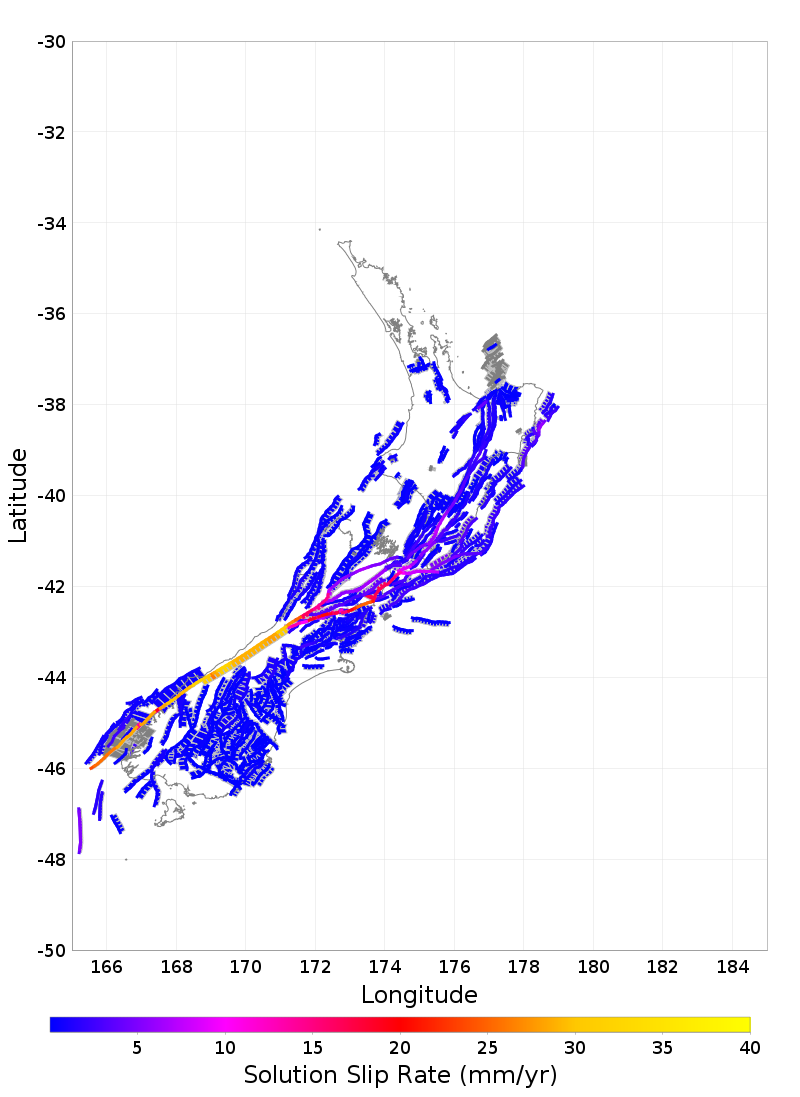
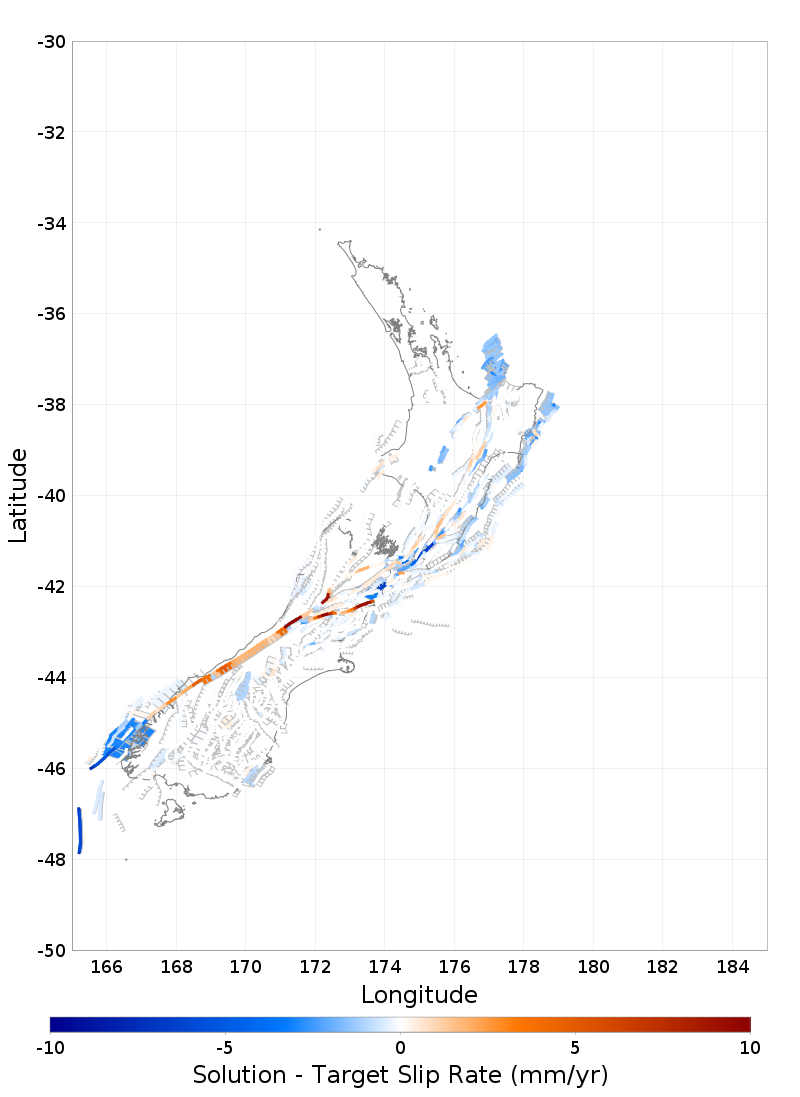
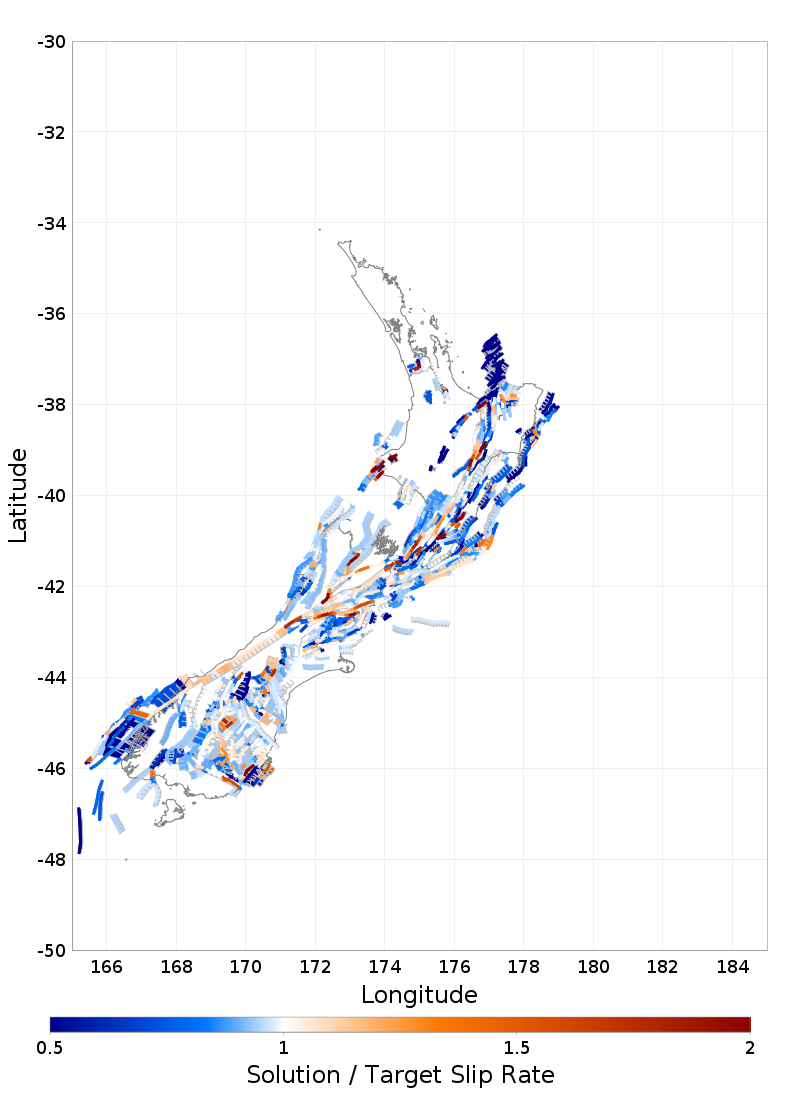
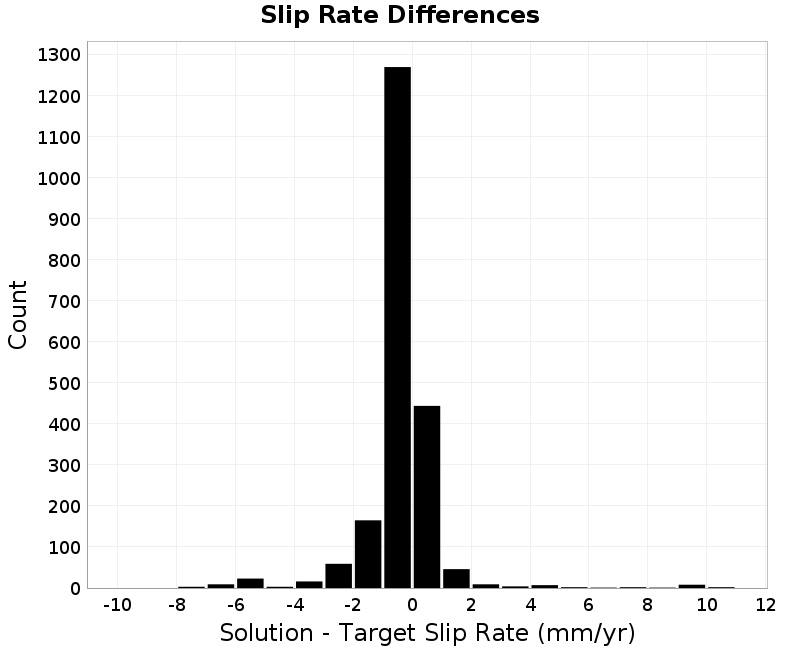
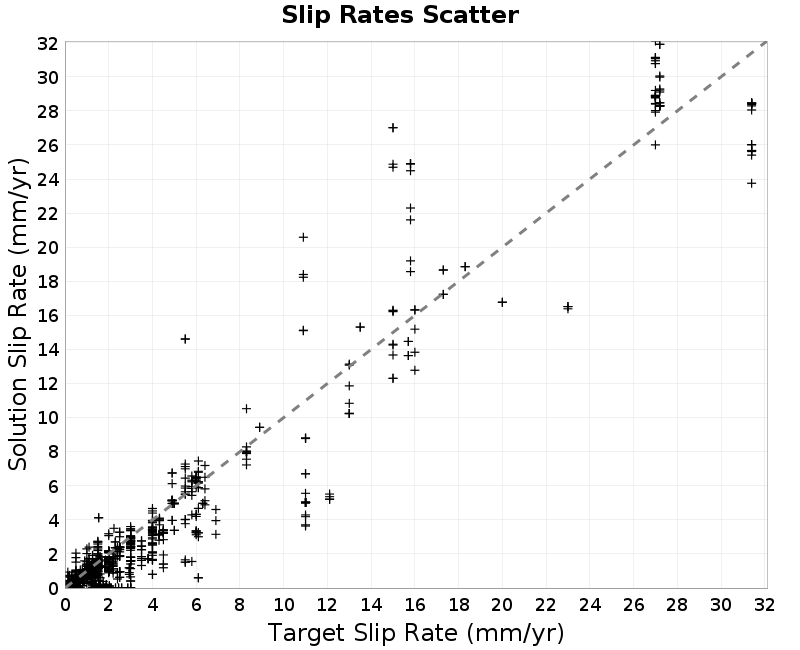
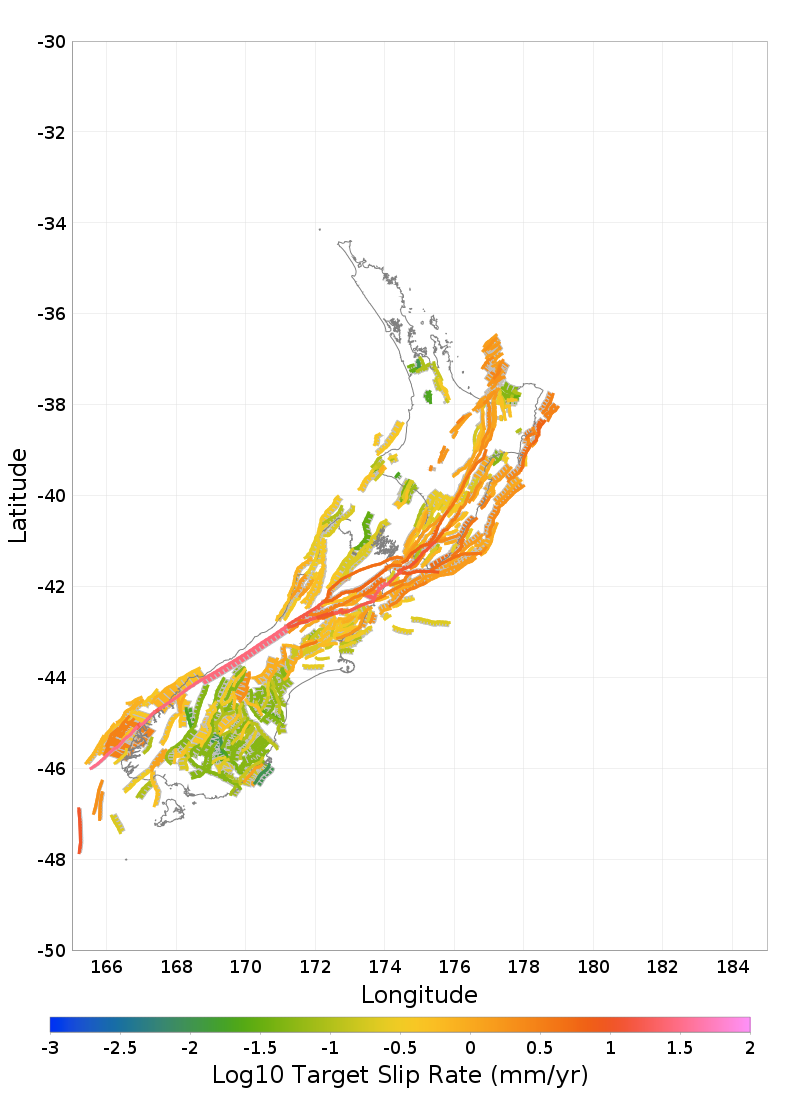
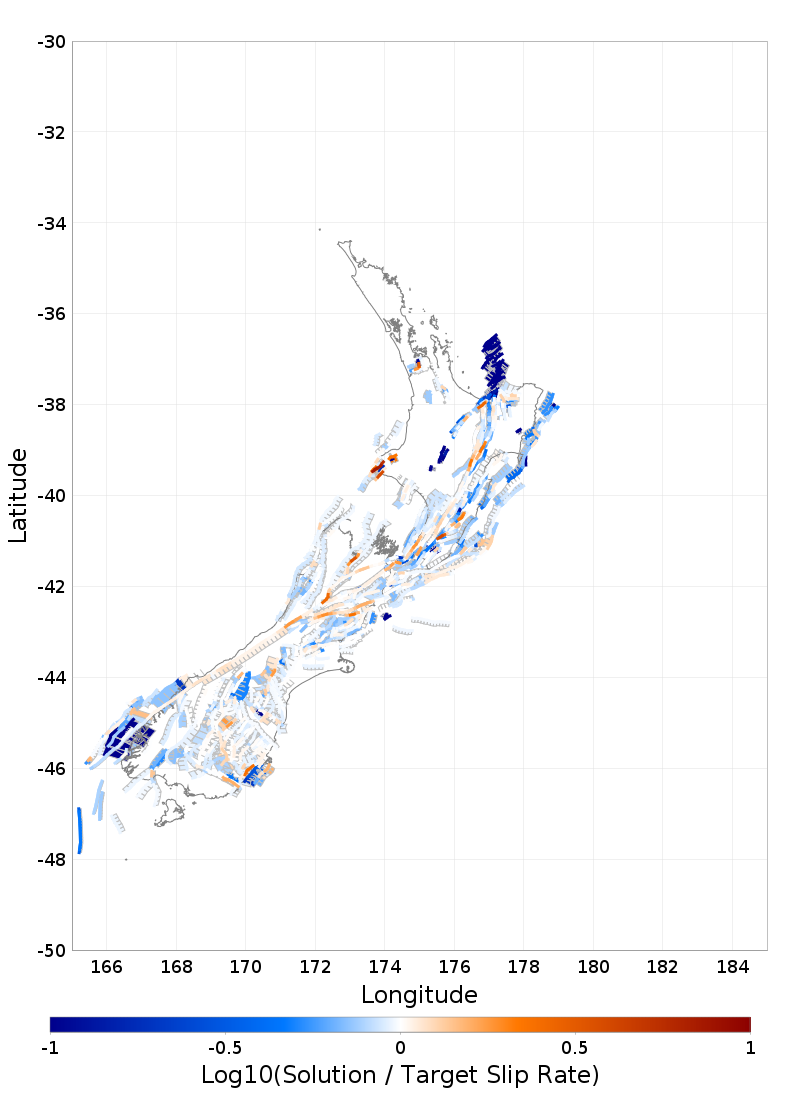
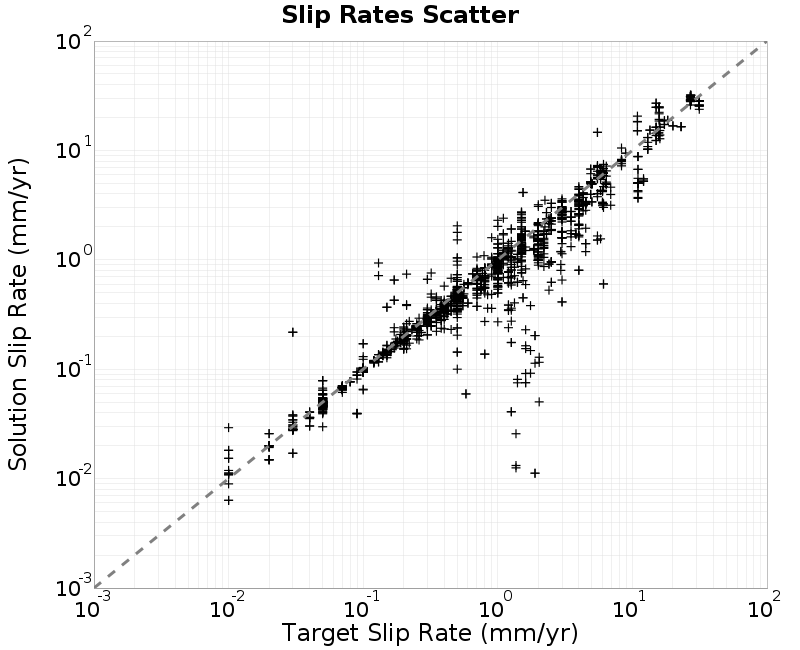
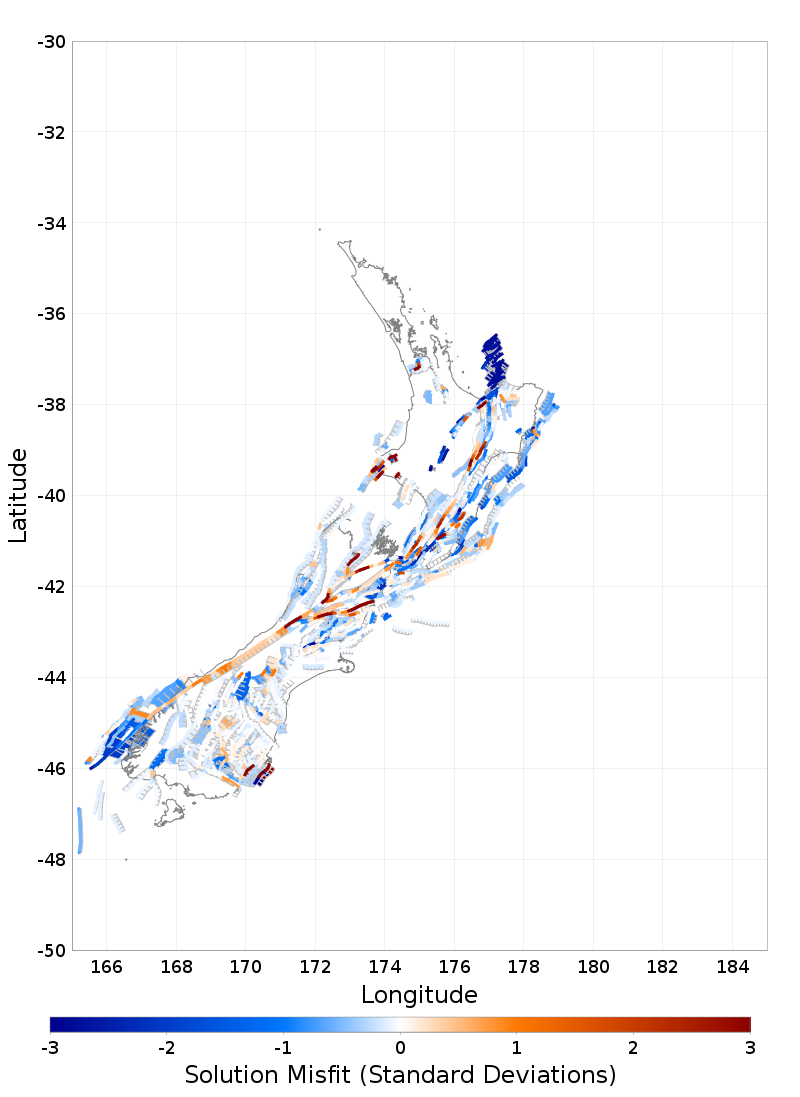
Slip Rates
(top)
Linear Slip Rate Plots
(top)
Log10 Slip Rate Plots
(top)
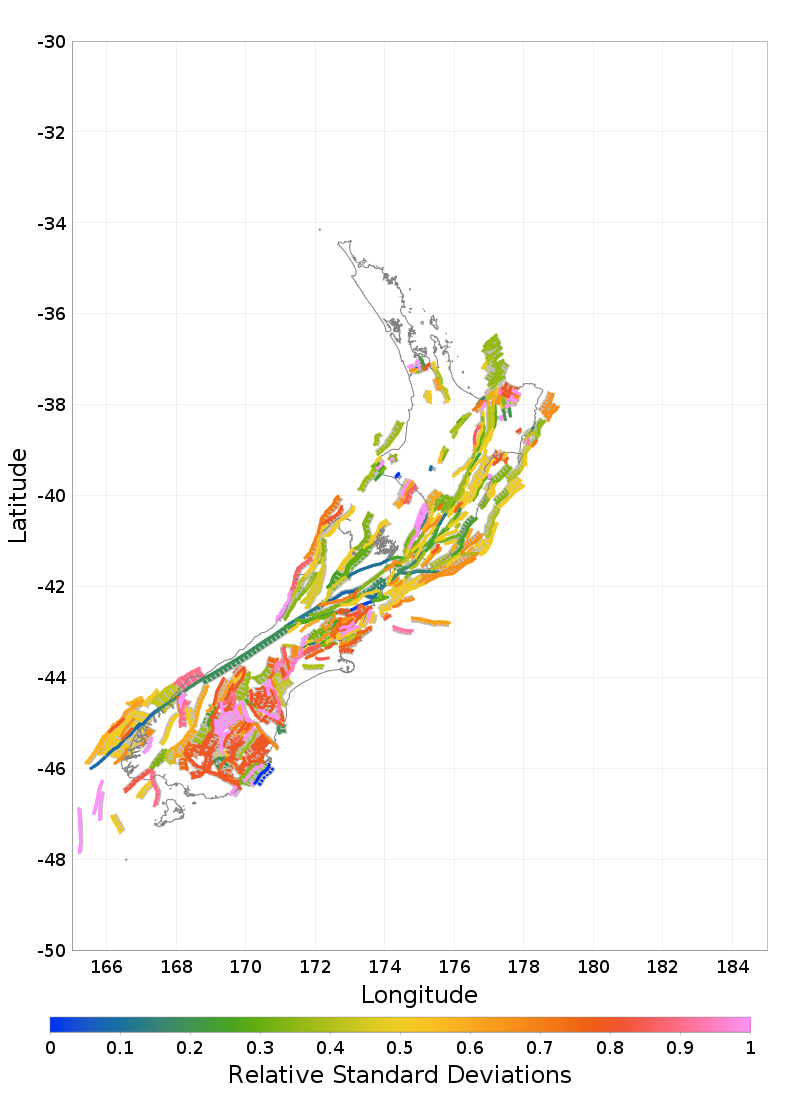
Slip Rate Std Dev Plots
(top)
Jump Counts Over Distance
(top)
Supra-seismogenic Jump Counts
(top)
| As Discretized | Rate Weighted |
|---|
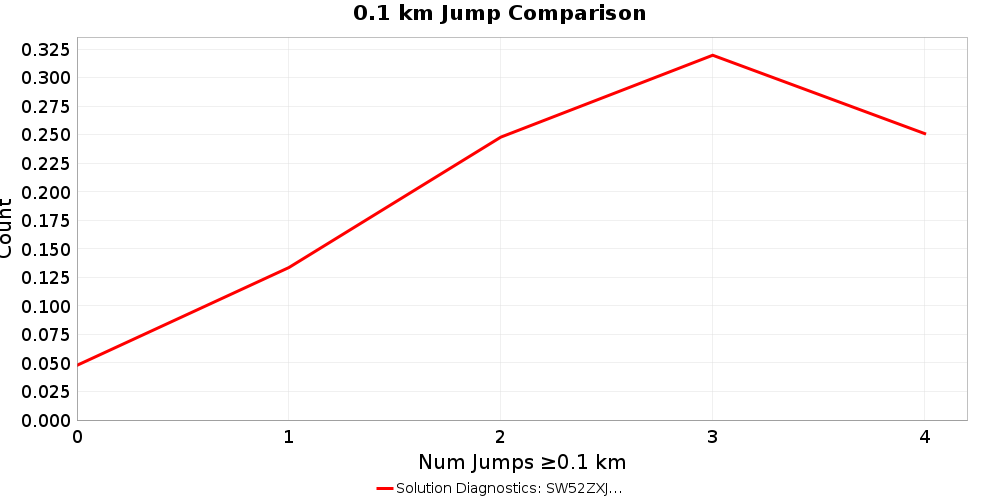 | 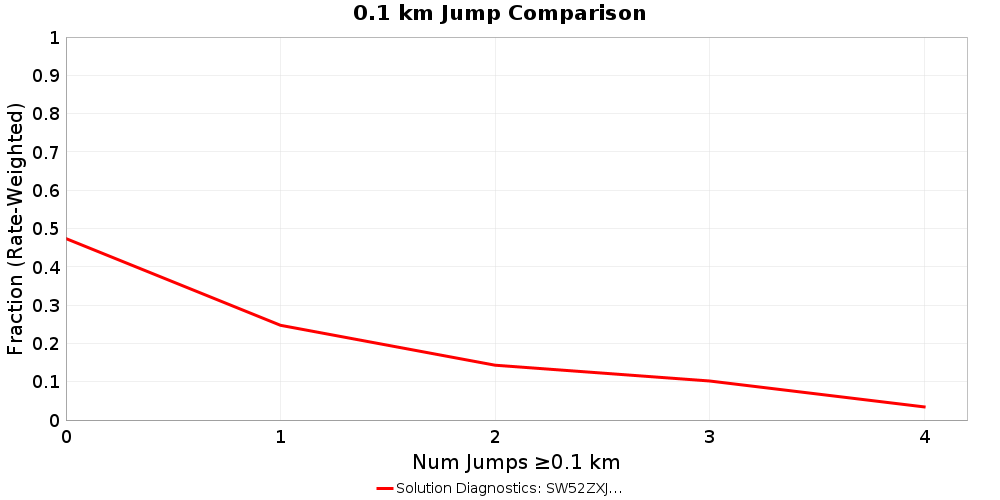 |
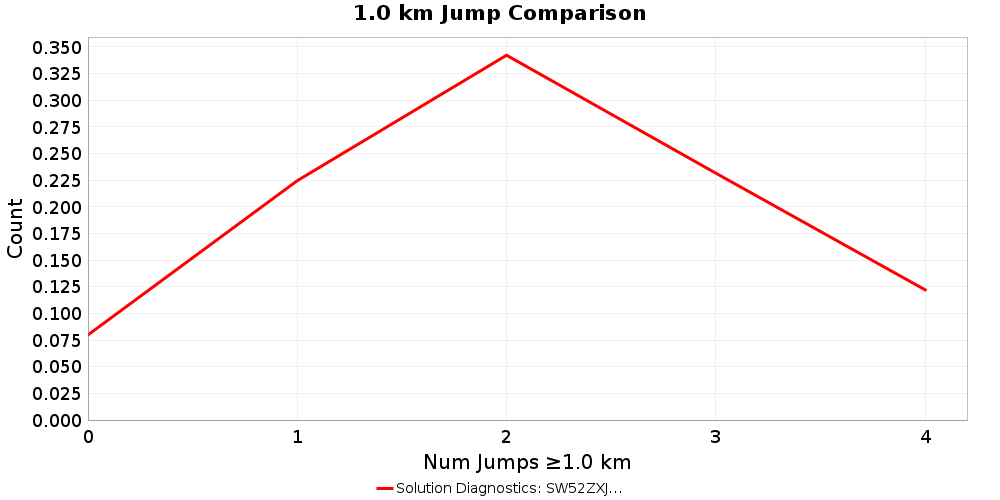 | 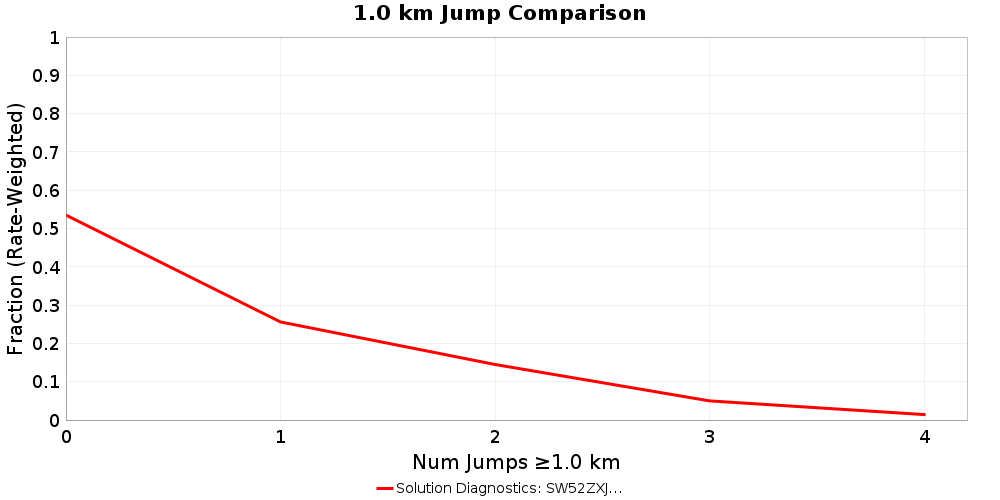 |
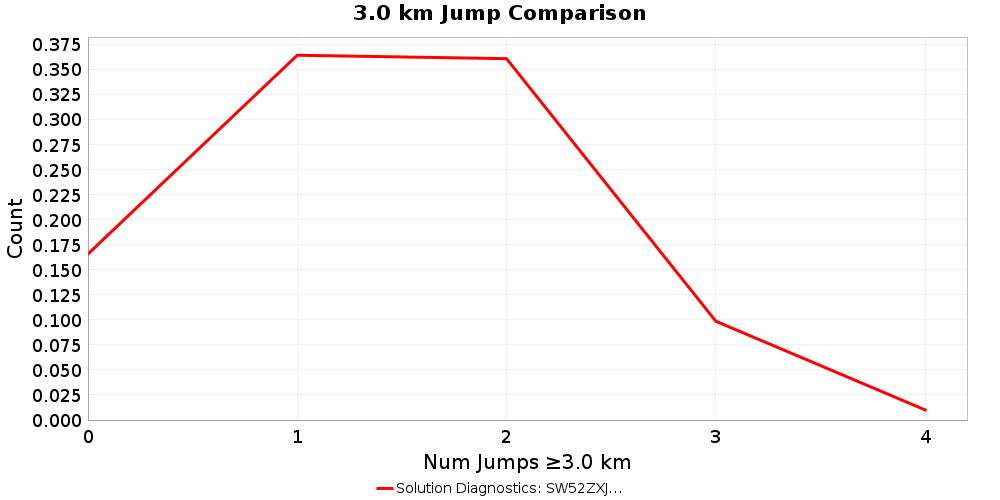 |  |
M≥7 Jump Counts
(top)
| As Discretized | Rate Weighted |
|---|
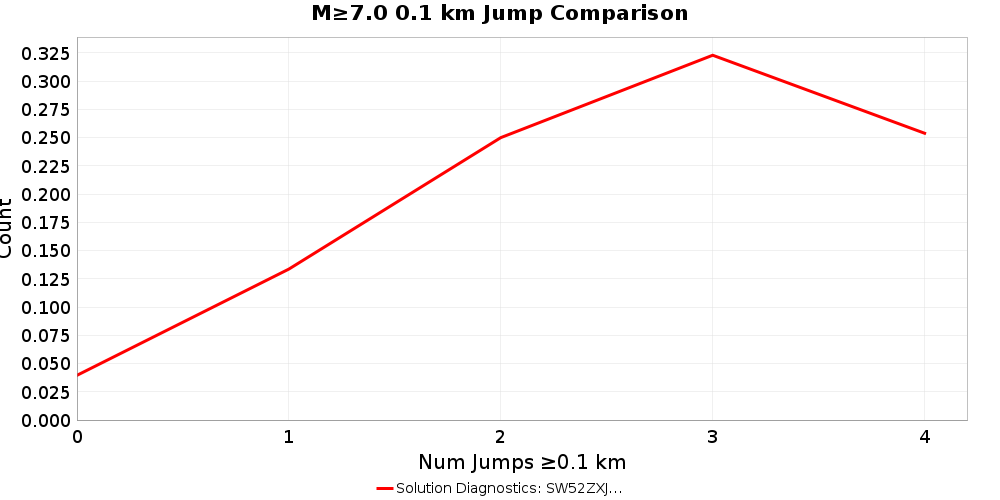 | 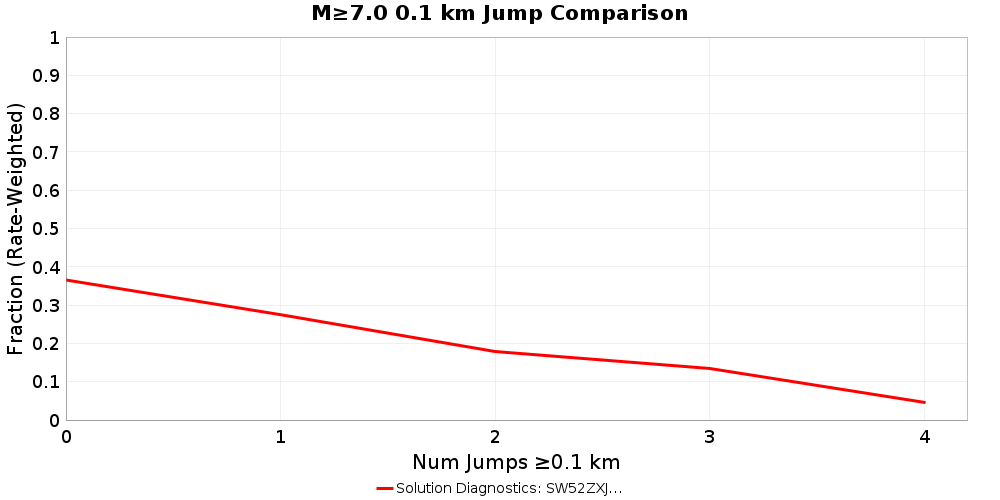 |
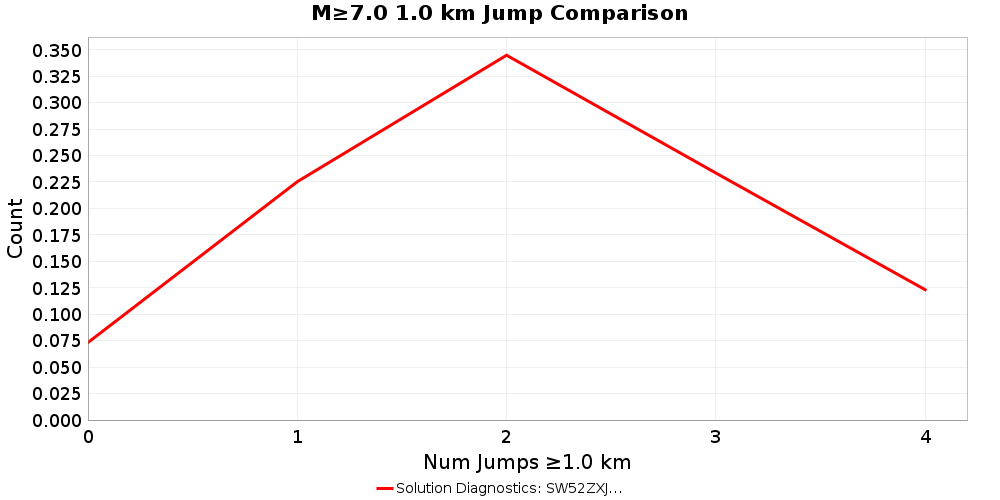 | 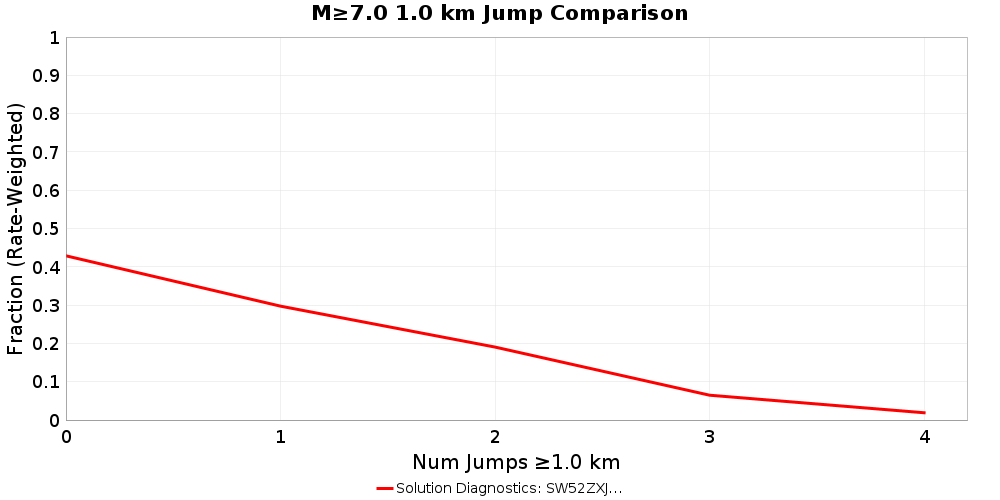 |
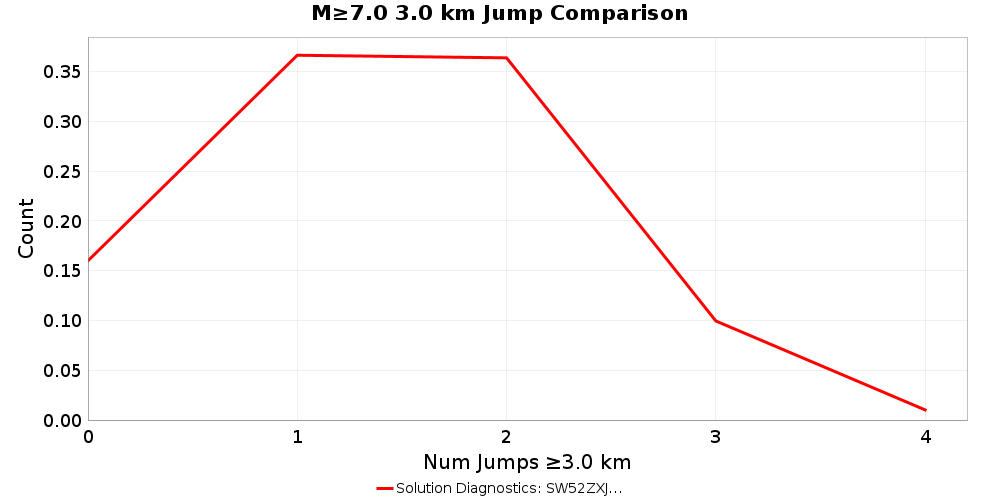 | 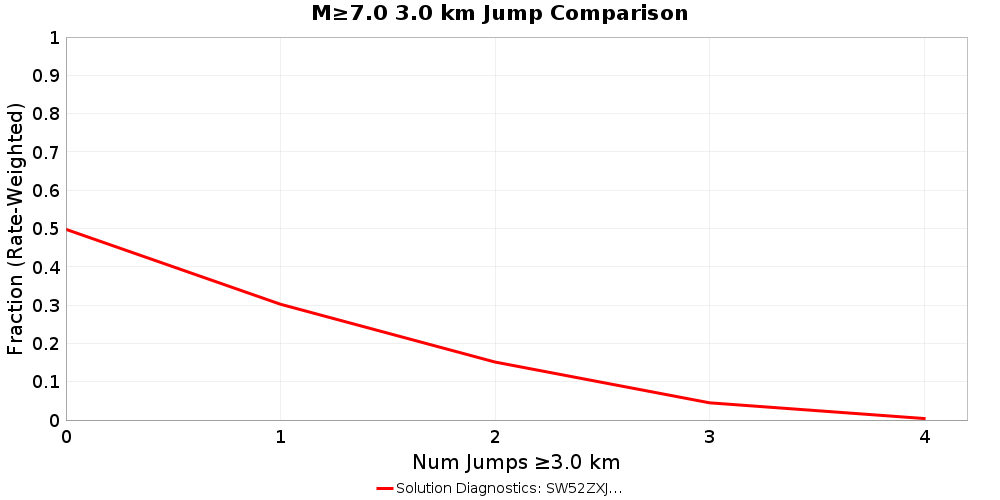 |
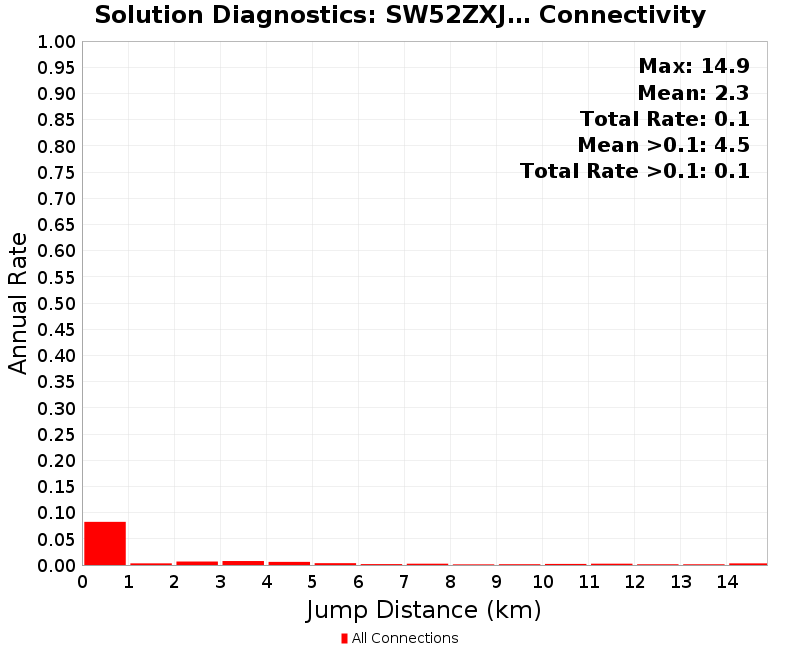
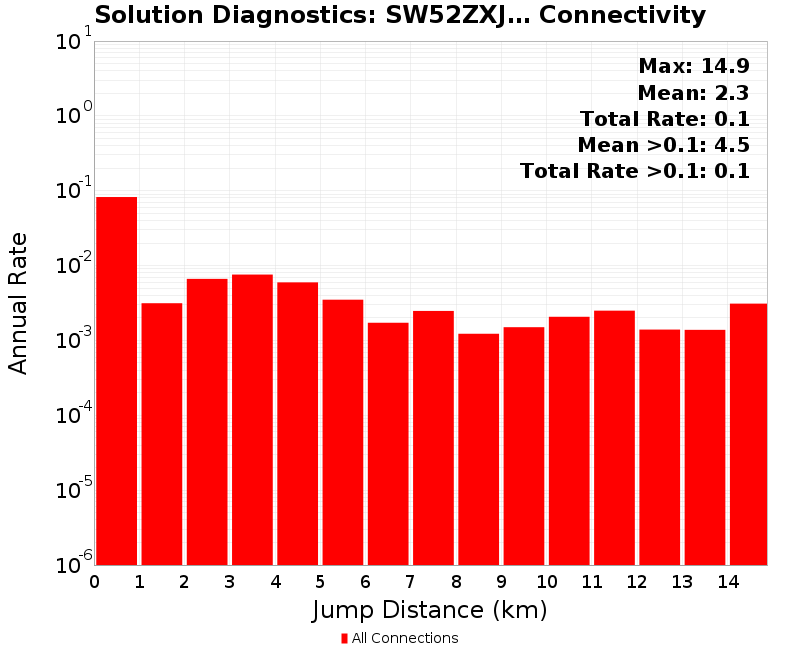
Max Jump Distance Distribution
(top)
Cumulative Jump Distance Distribution
(top)
Hazard Maps
(top)
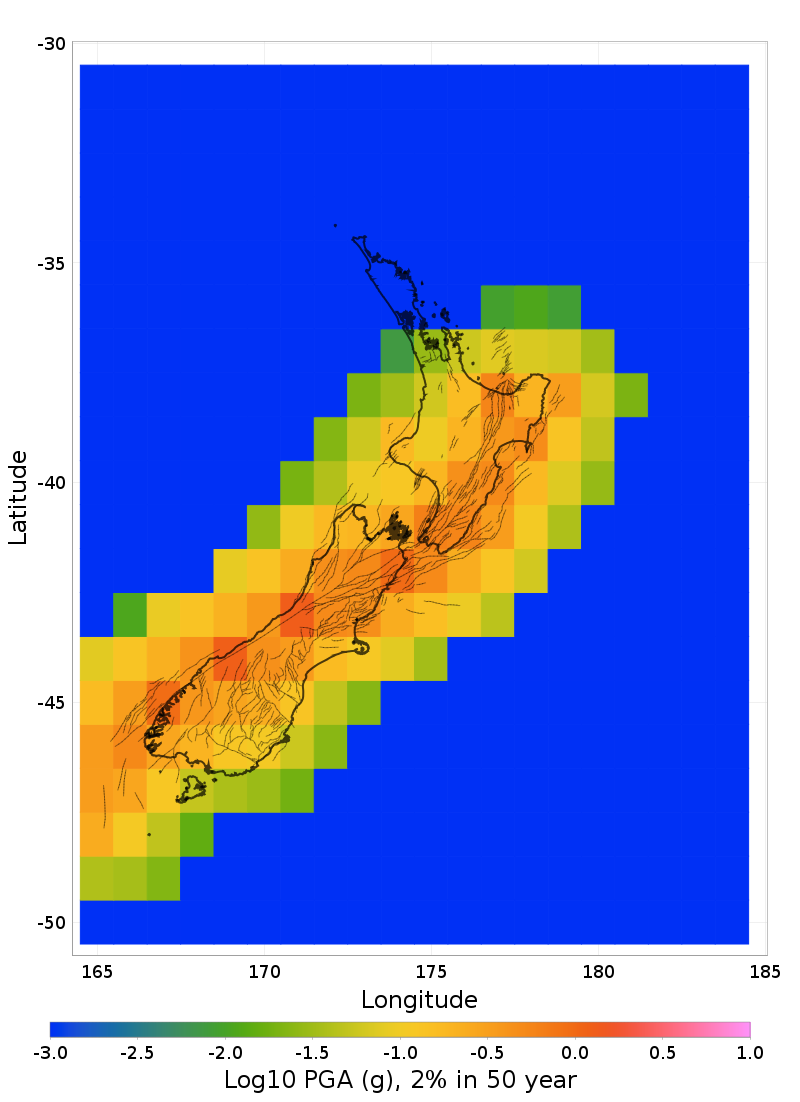
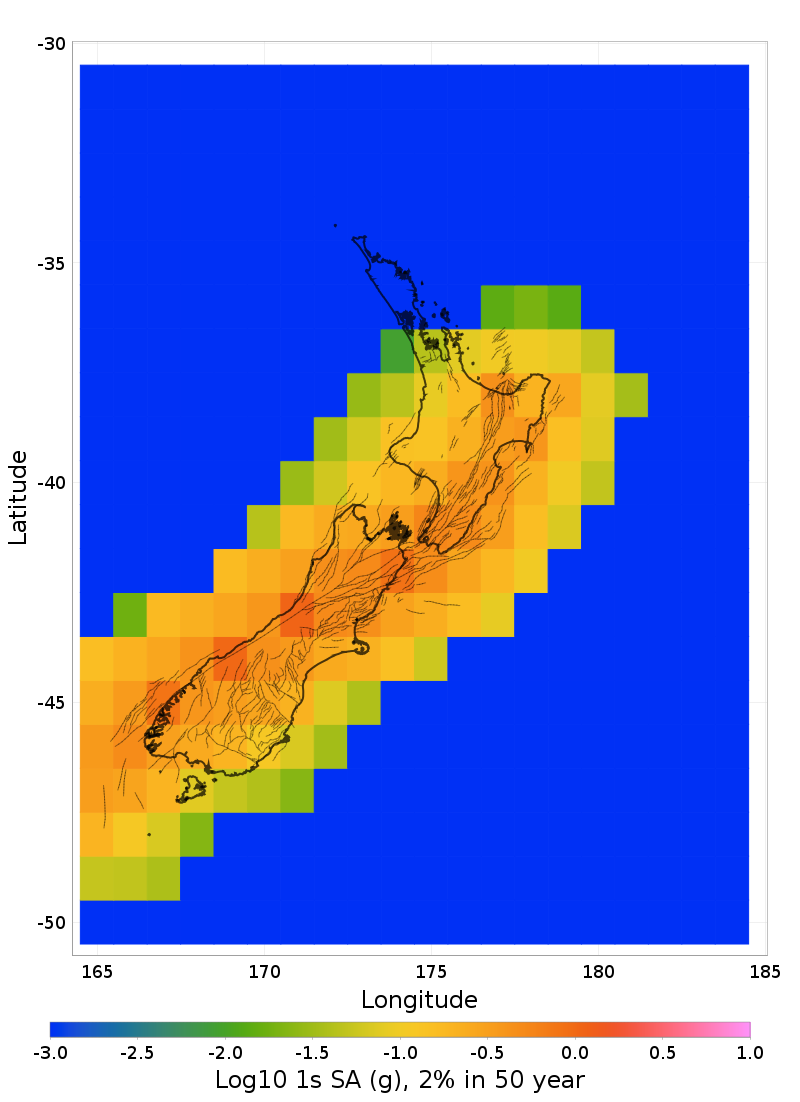
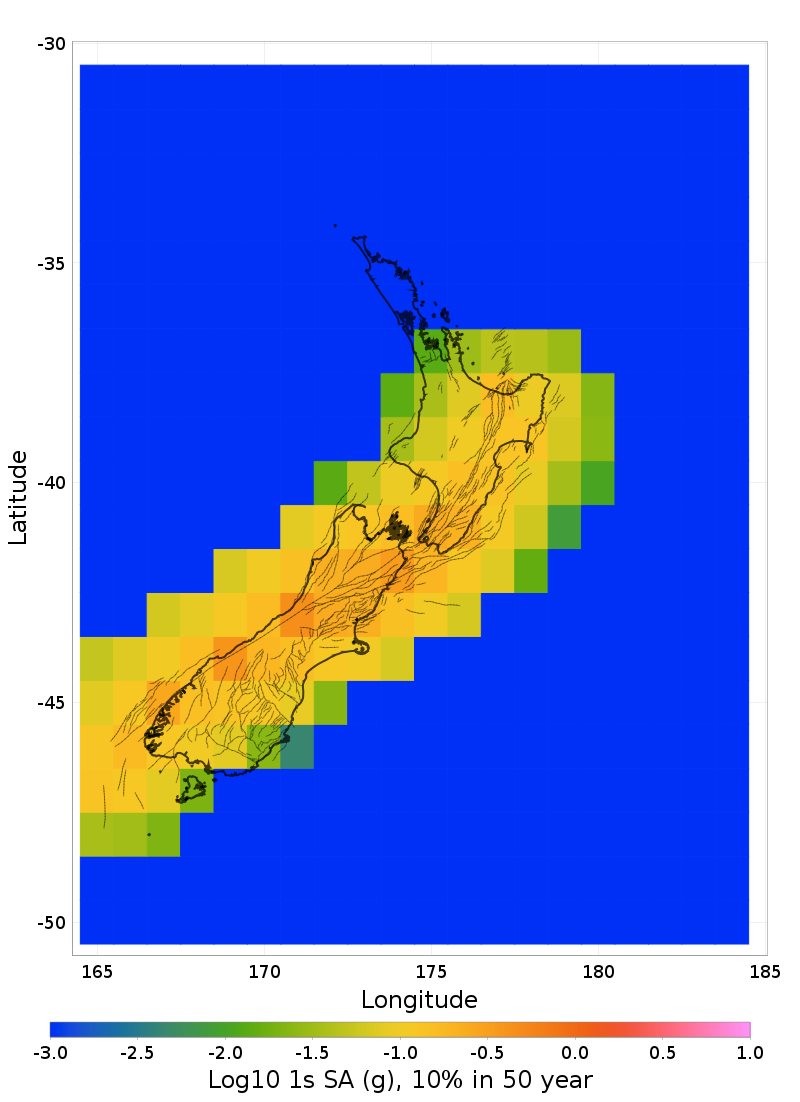
Hazard map comparisons with a resolution of 1 degrees (400 sites). Hazard is computed with the ASK2014 GMPE, default site parameters, and supra-seismogenic fault sources only.
PGA Hazard Maps
(top)
PGA, 2% in 50 year Hazard Maps
(top)
PGA, 10% in 50 year Hazard Maps
(top)

1s SA Hazard Maps
(top)
1s SA, 2% in 50 year Hazard Maps
(top)
1s SA, 10% in 50 year Hazard Maps
(top)
Parent Section Detail Pages
(top)