Rupture Set Diagnostics: Rupture Set Diagnostics. Rupset ID: RmlsZToxNDg3LjBWa2VaTg==
- Num ruptures: 32,665
- Num single-strand ruptures: 32,665 (100%)
- Rupture mag range: [6.57,9.49]
- Rupture length range: [29.36,3295.47] km
- Rupture sect count range: [1,578]
Table Of Contents
Plausibility Configuration
(top)
- Connection strategy:
- Name: ClosestSectPair: maxDist=5 km
- Max jump dist: 5.0 km
- Allowed parent-section connections:
- Total: 0
- Each: avg=0.00, range=[0,0]
- Actual connections (after applying filters):
- Total: 0
- Each: avg=0.00, range=[2147483647,-2147483648]
- Max num splays: 0
- Filters:
Rupture Size Histograms
(top)
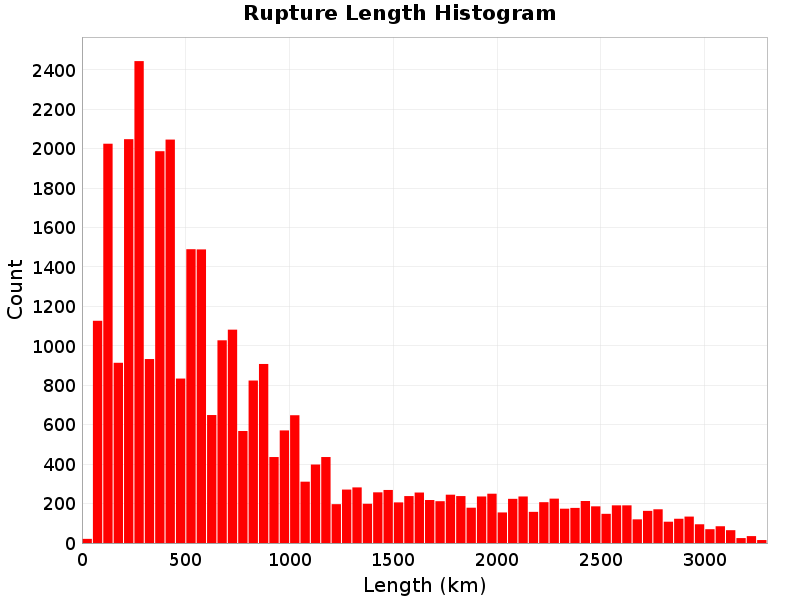
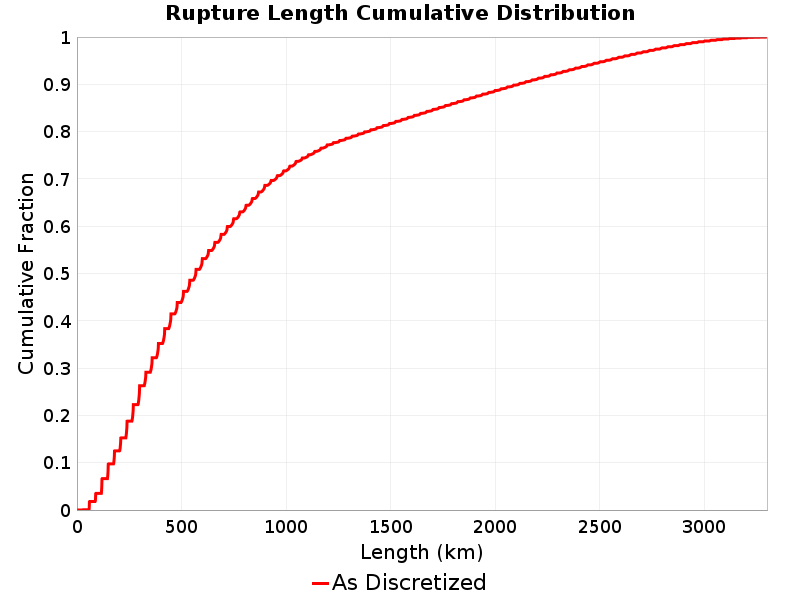
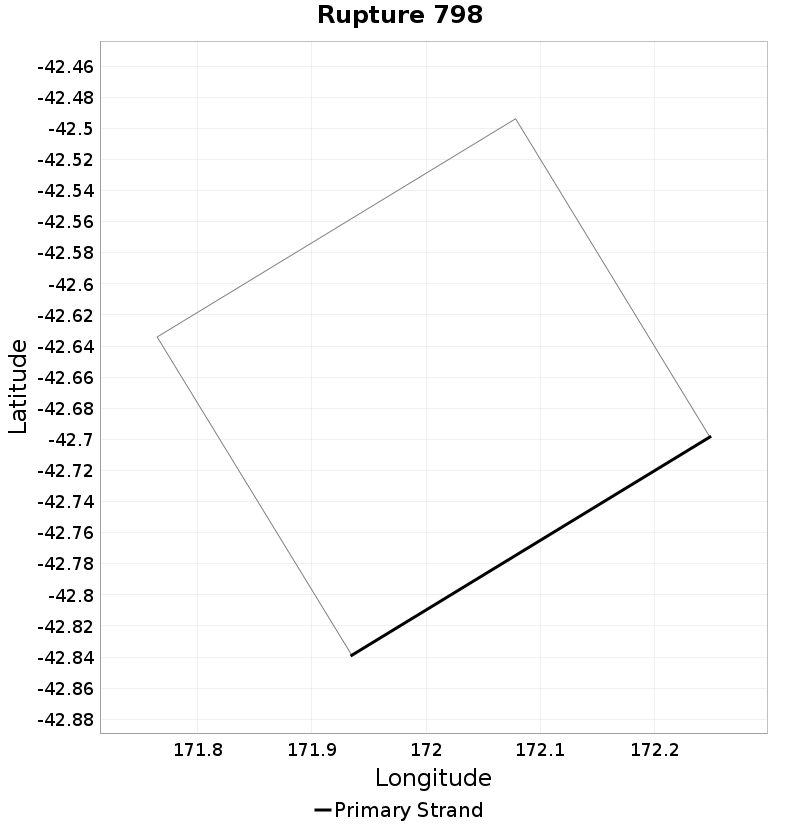
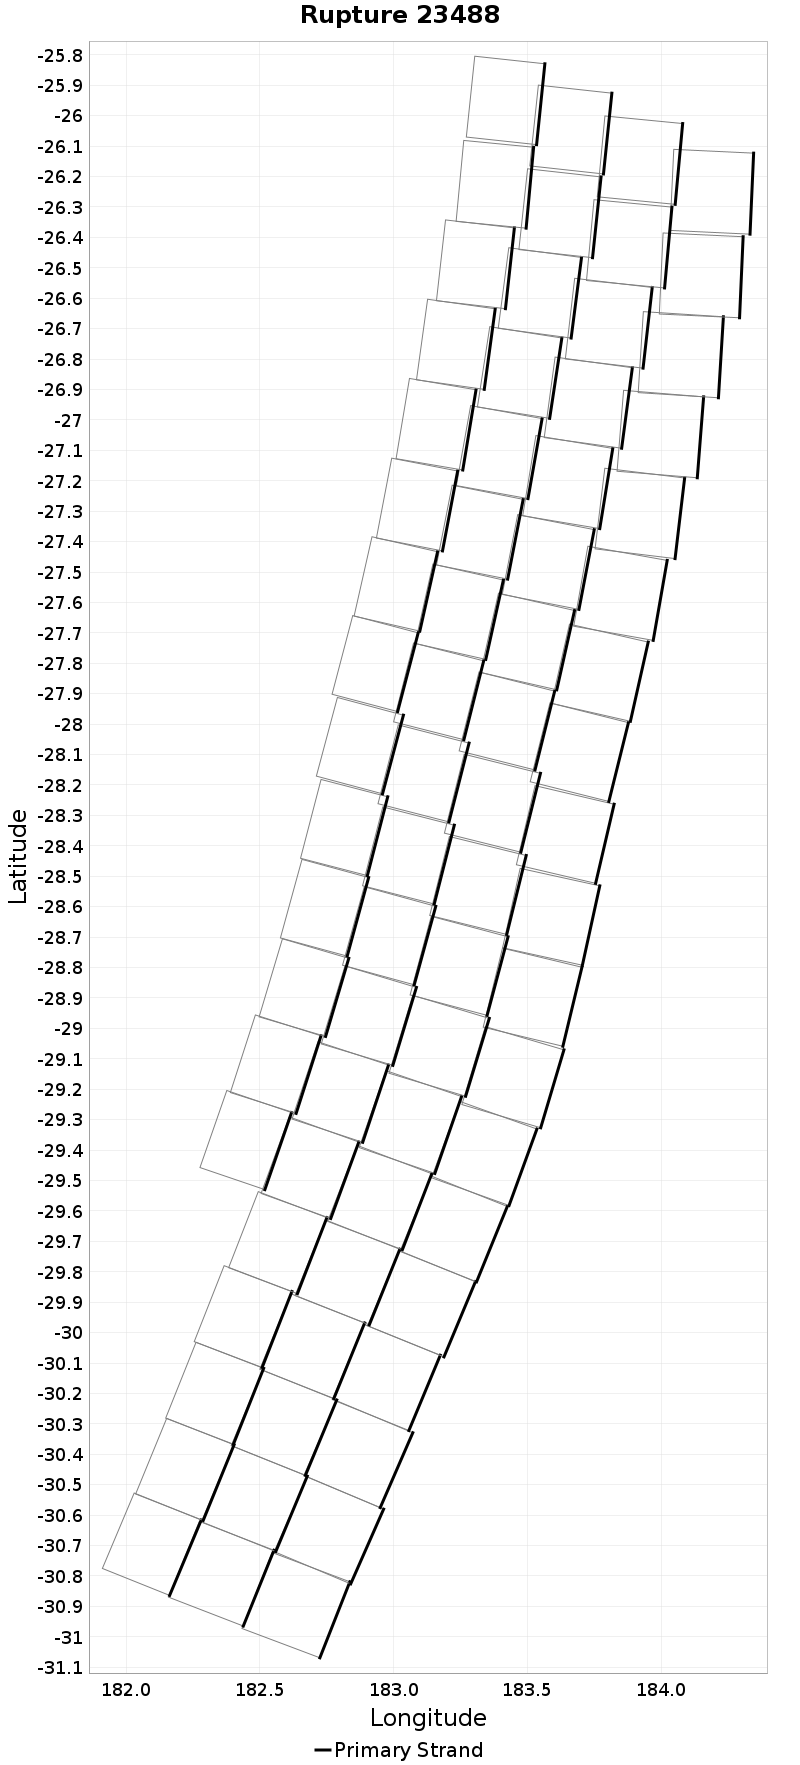
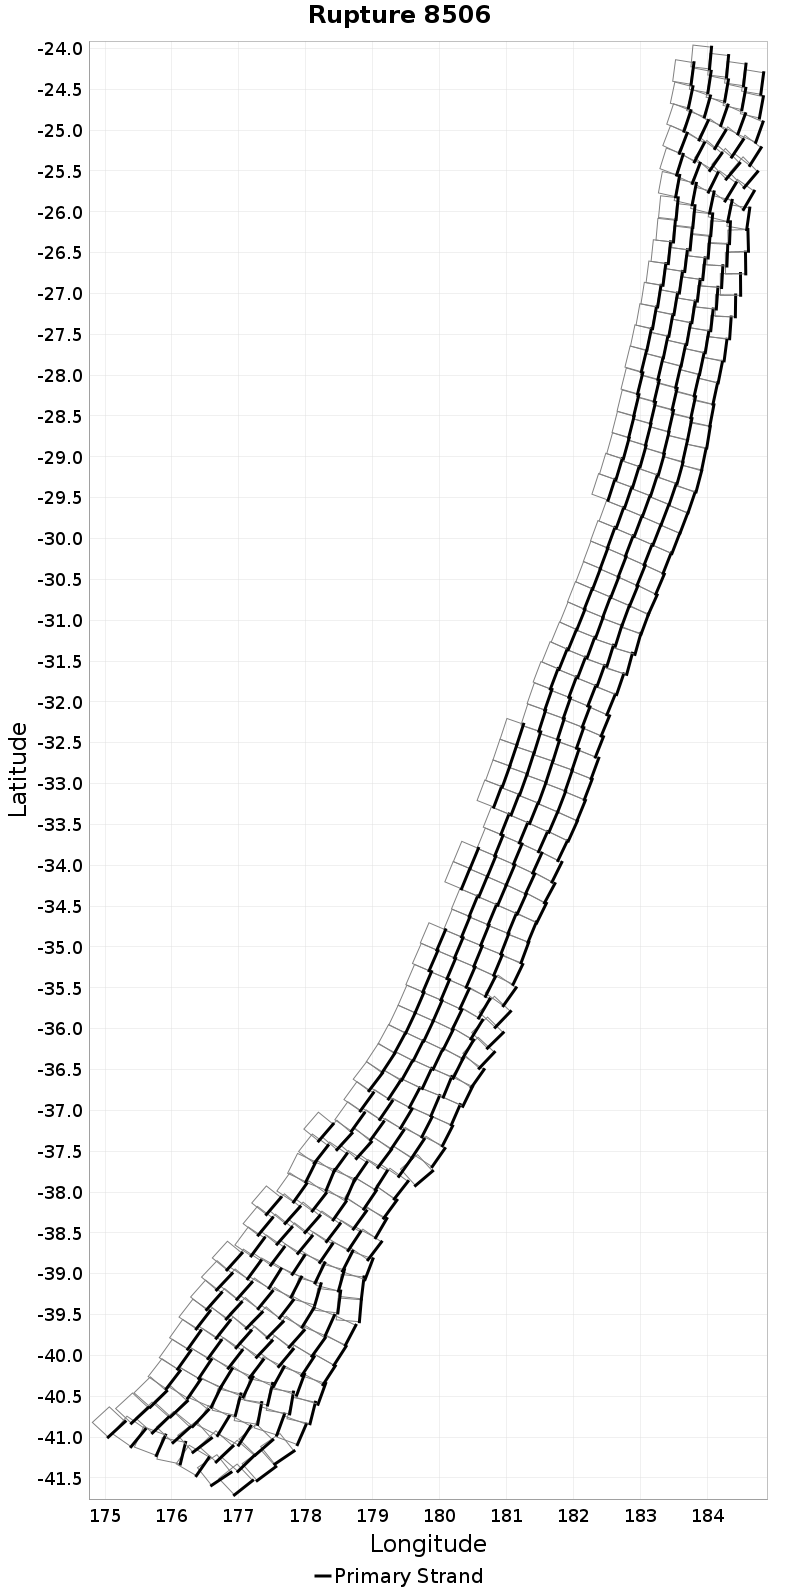
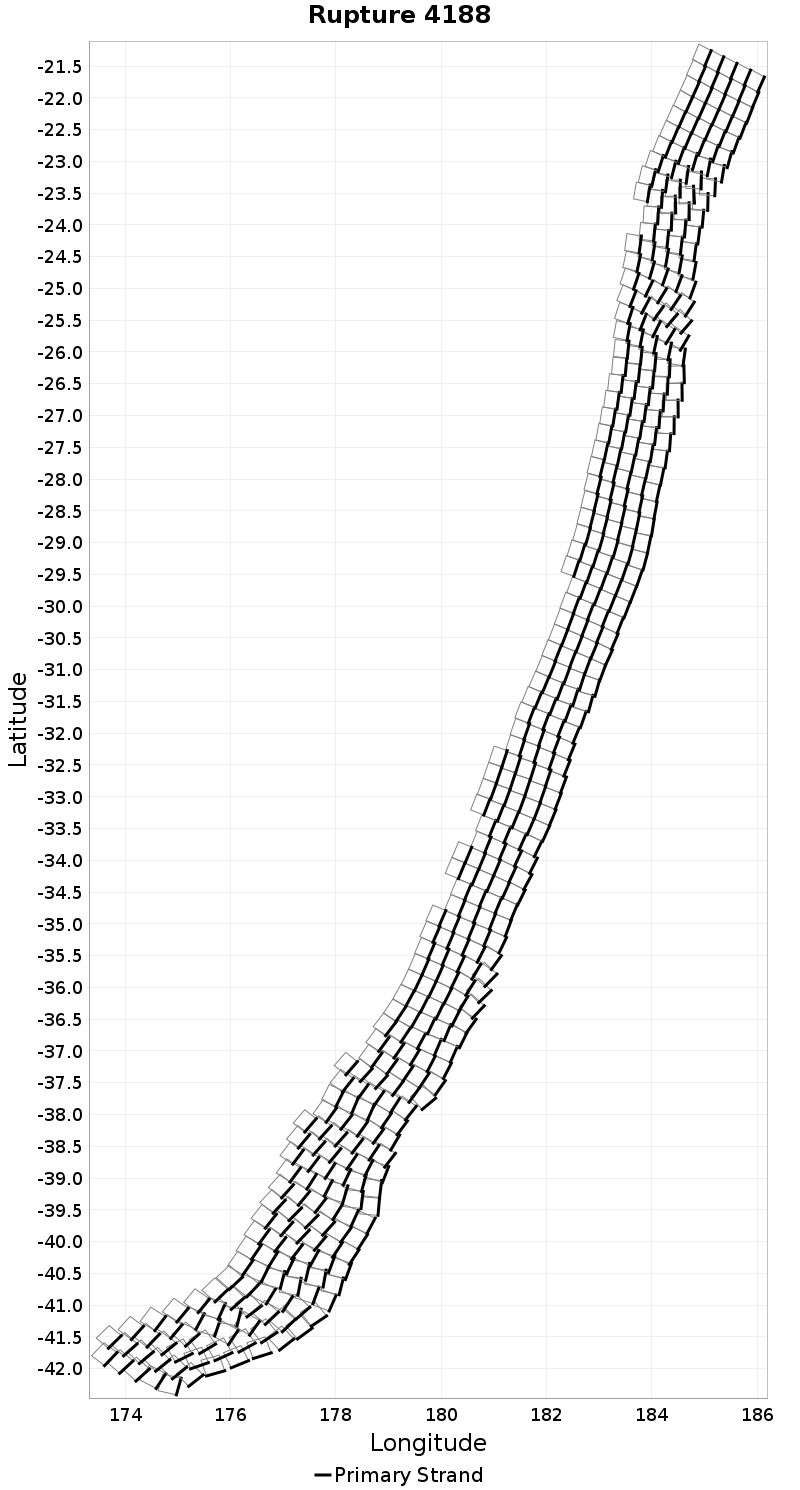
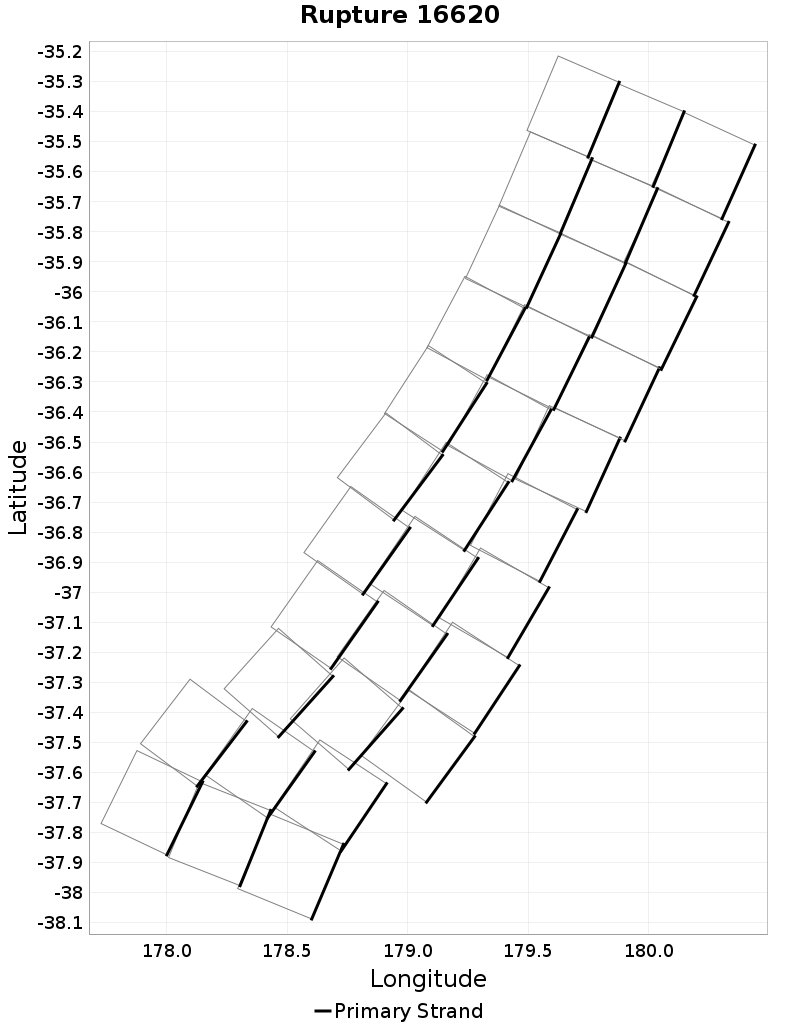
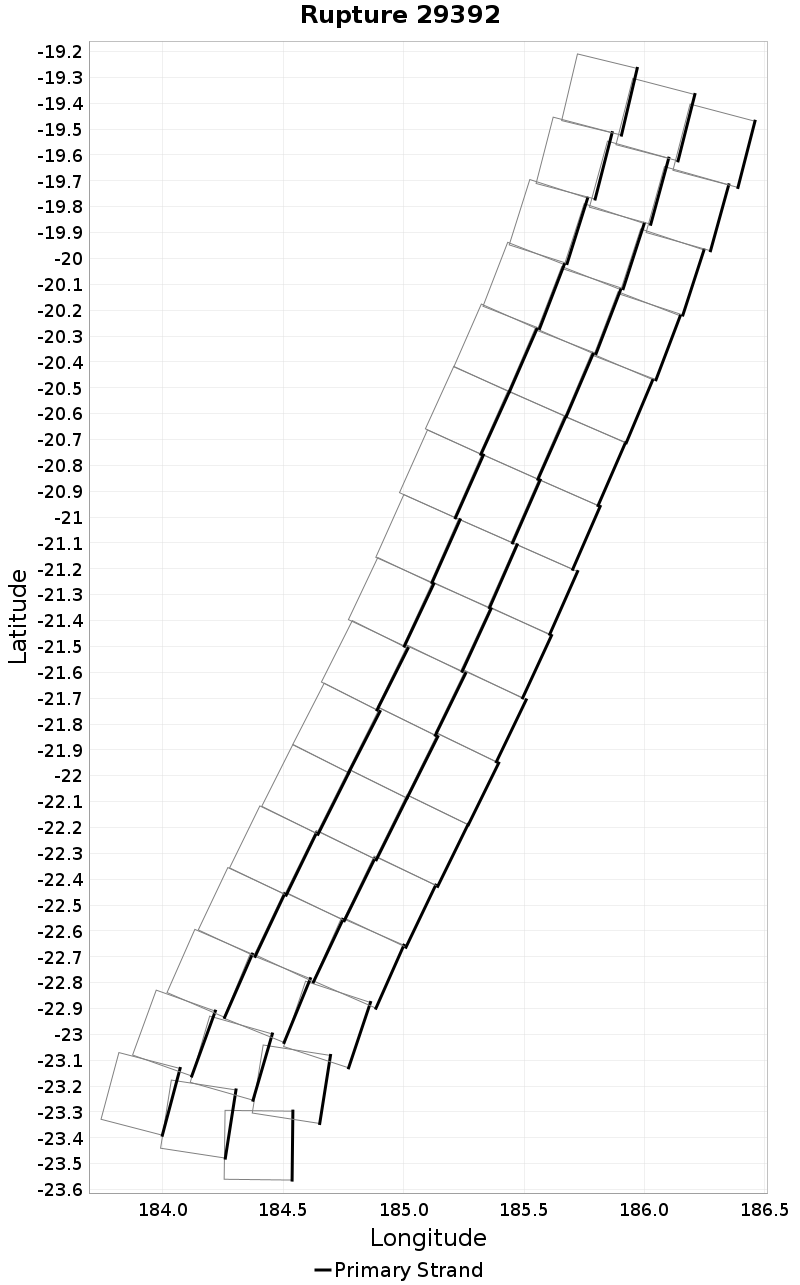
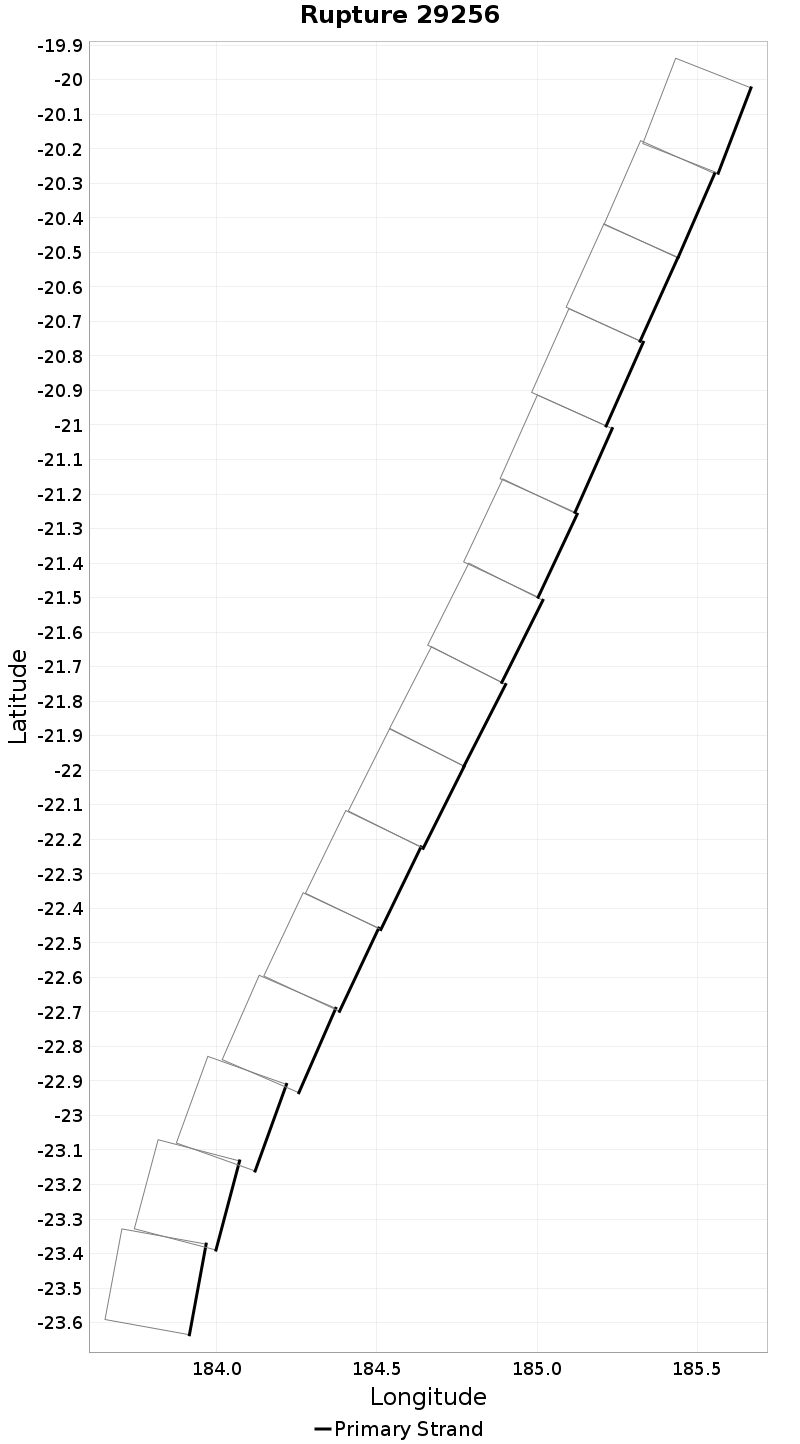
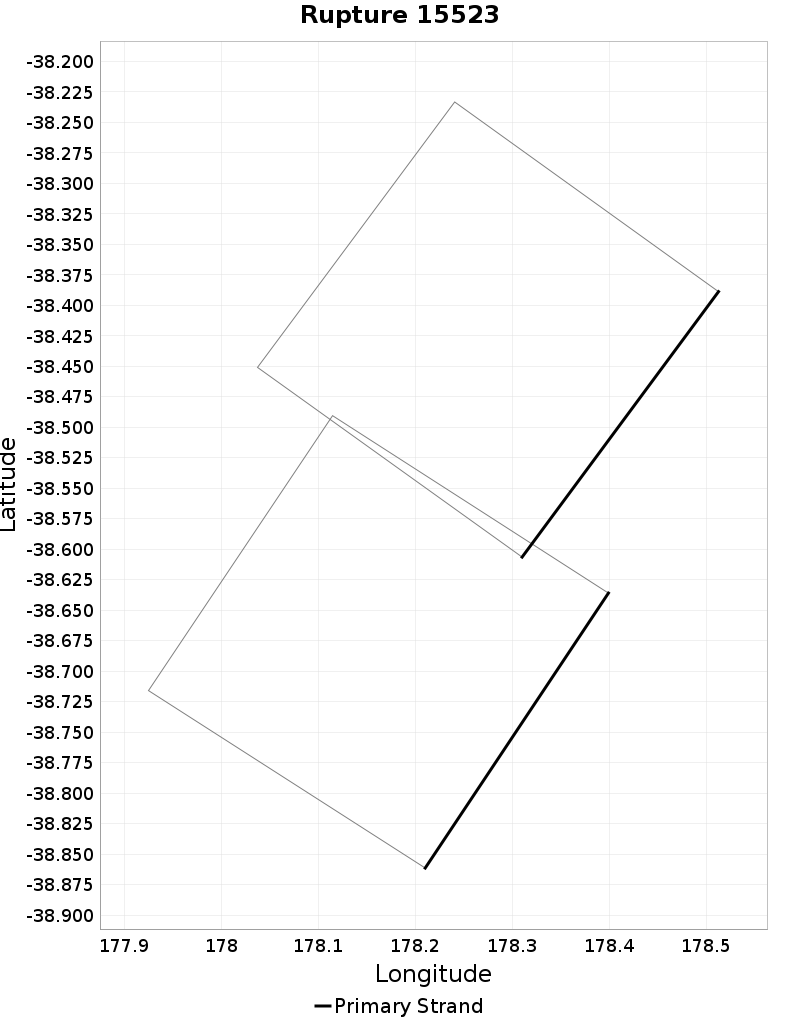
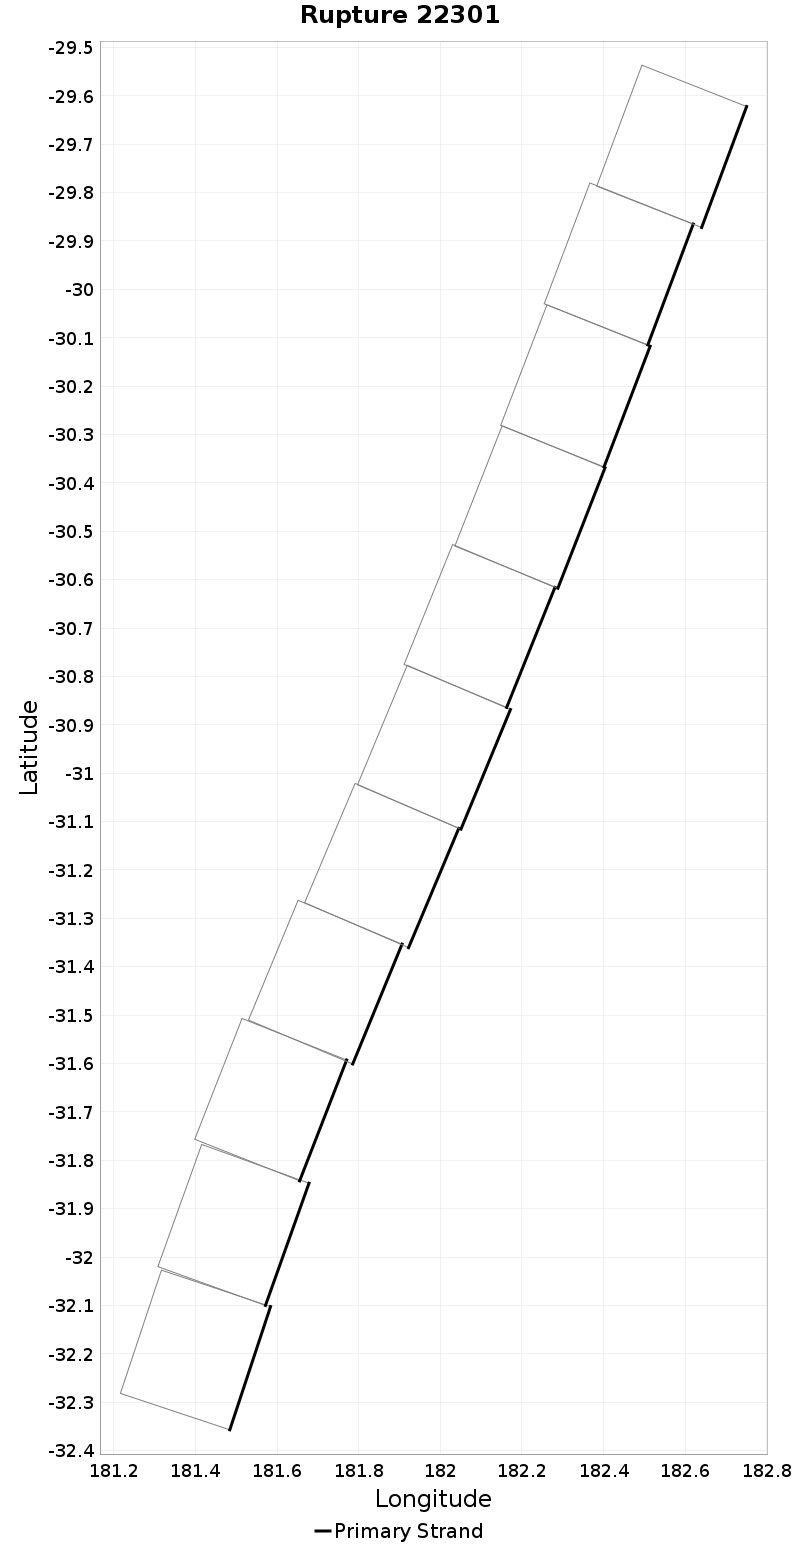
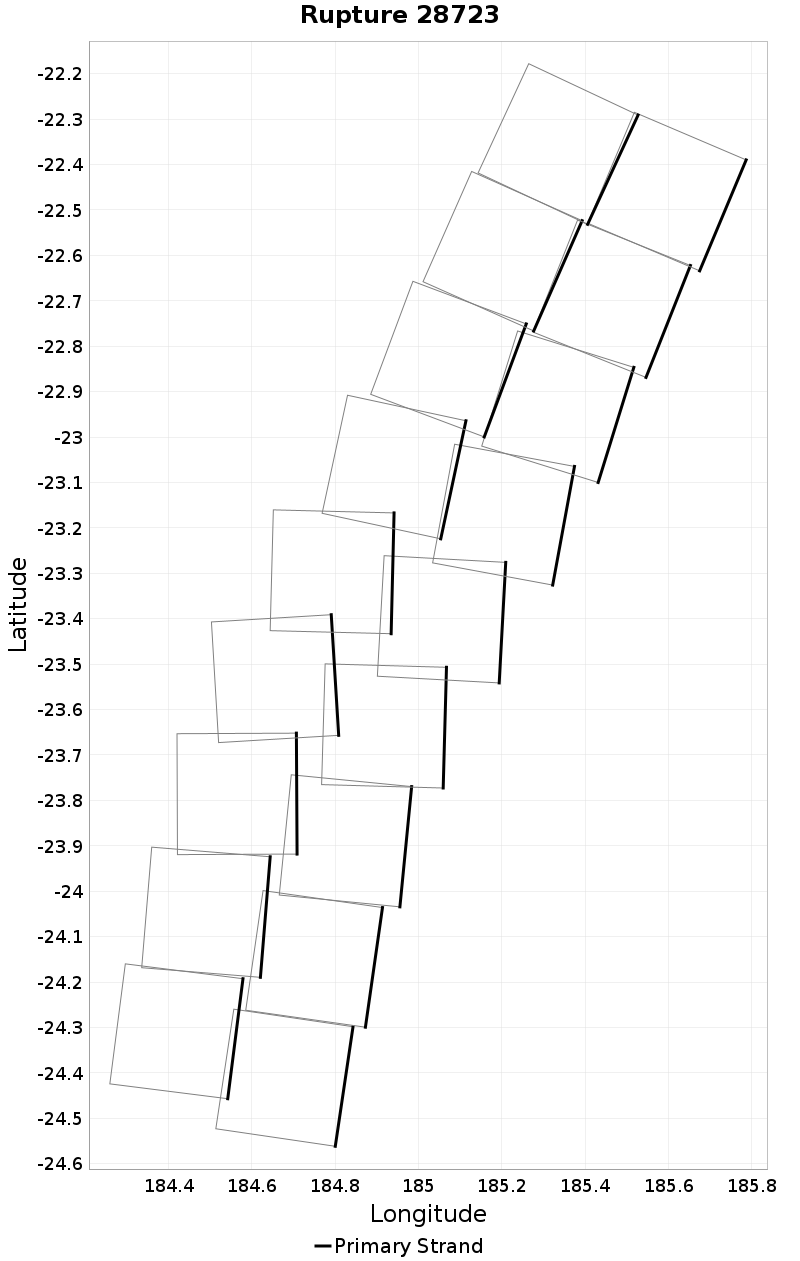
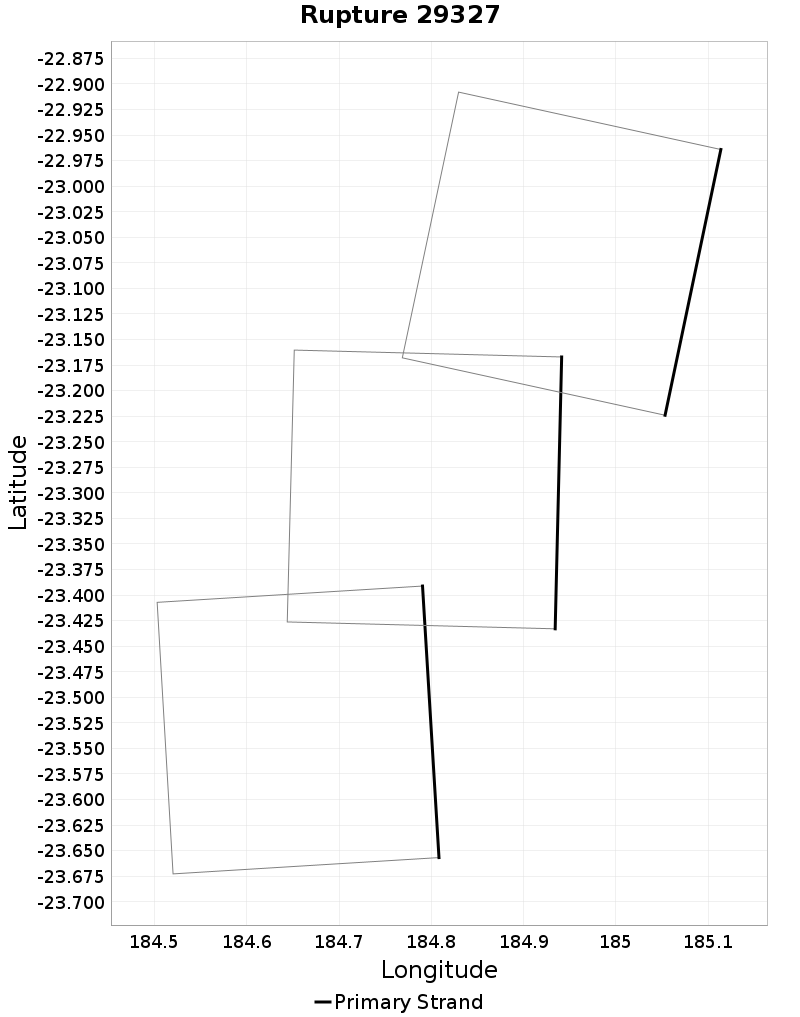
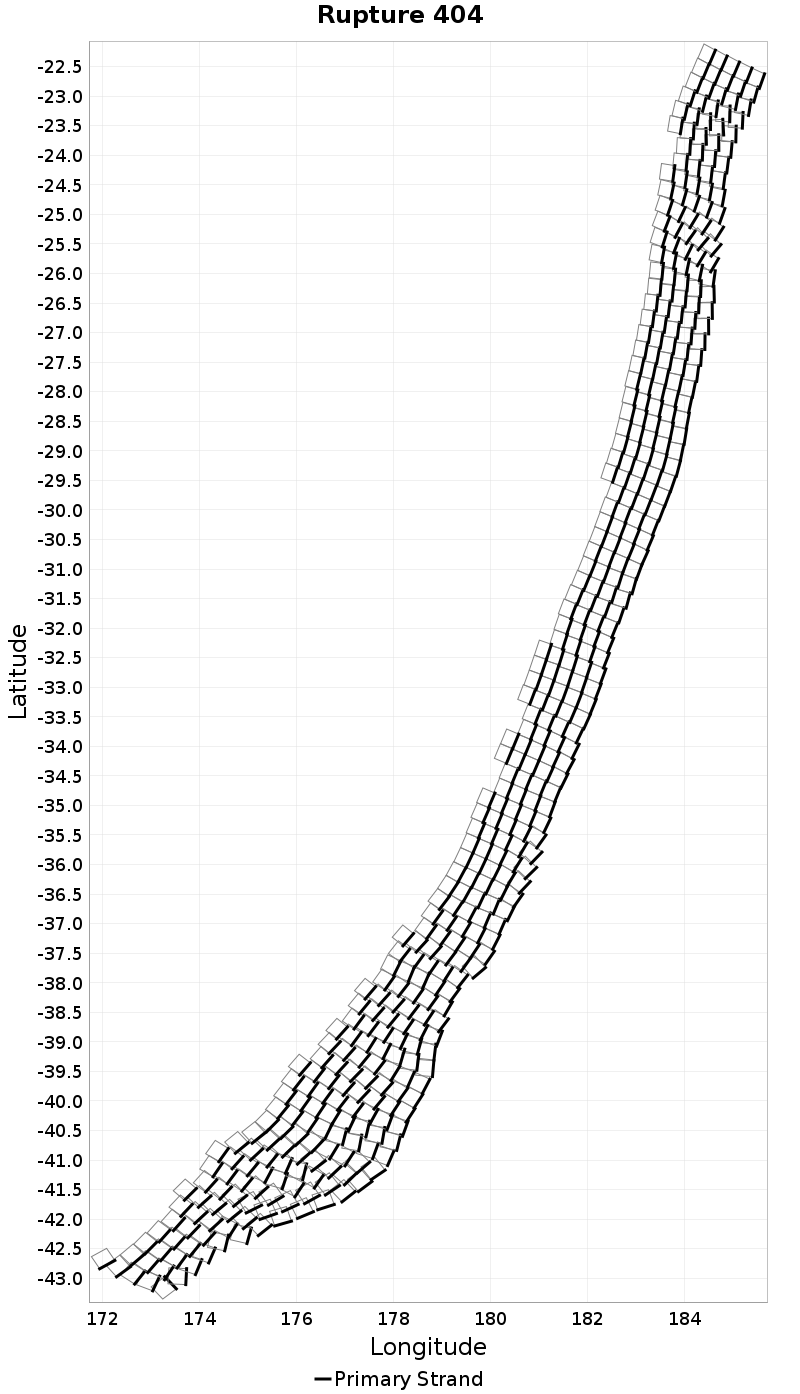
Rupture Length
(top)
Total length (km) of the rupture, not including jumps or gaps.
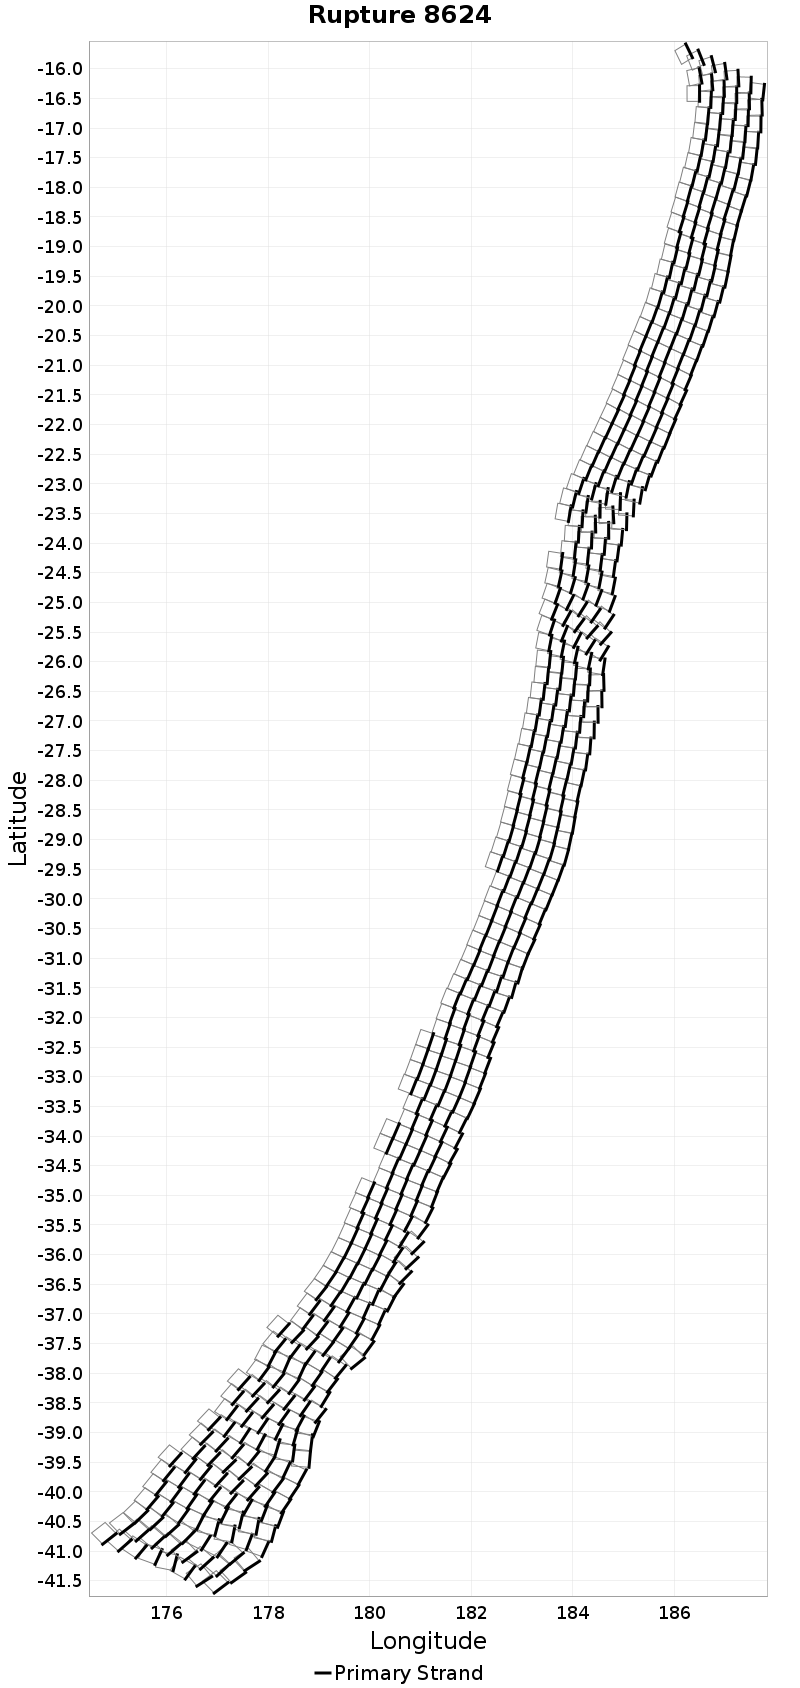
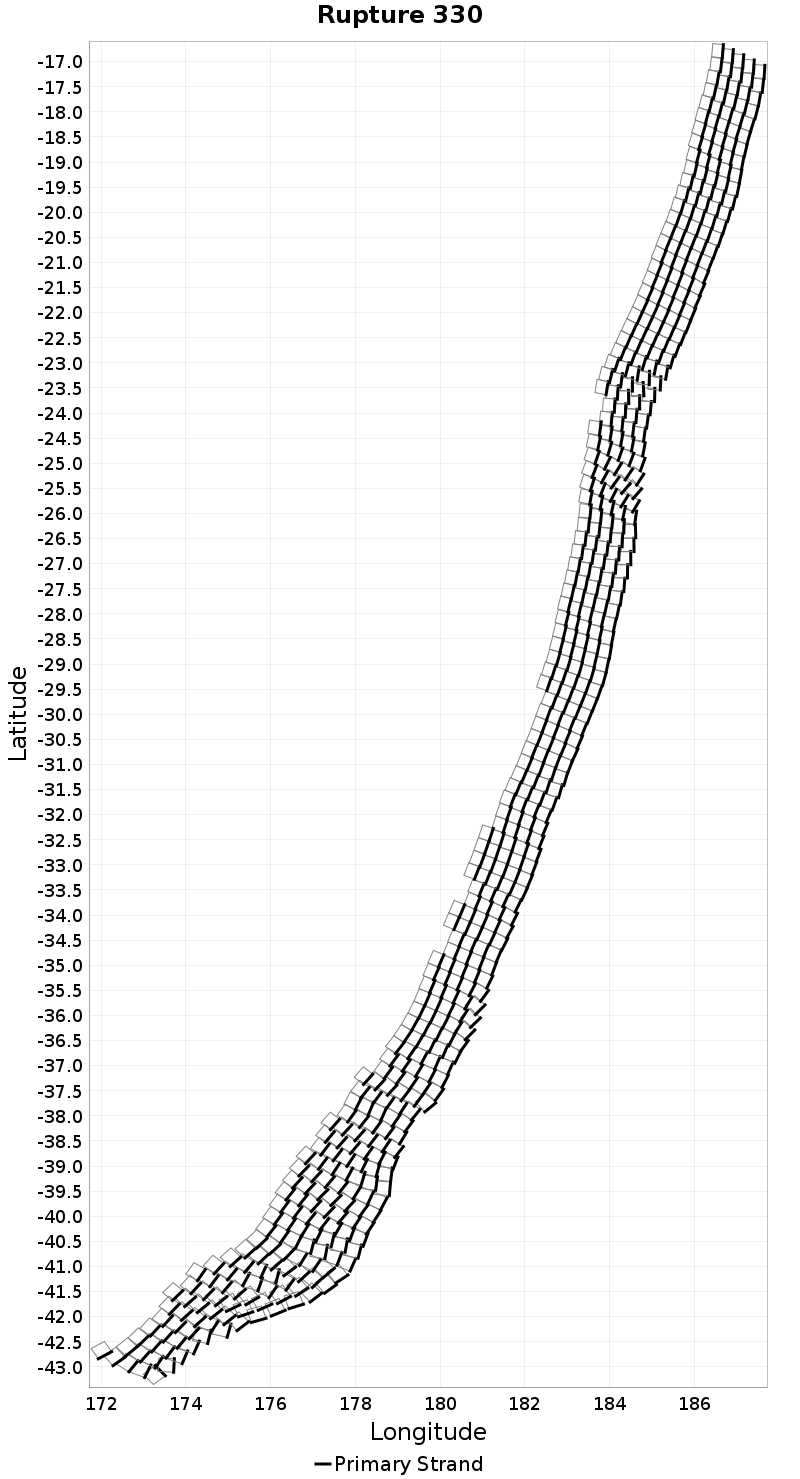
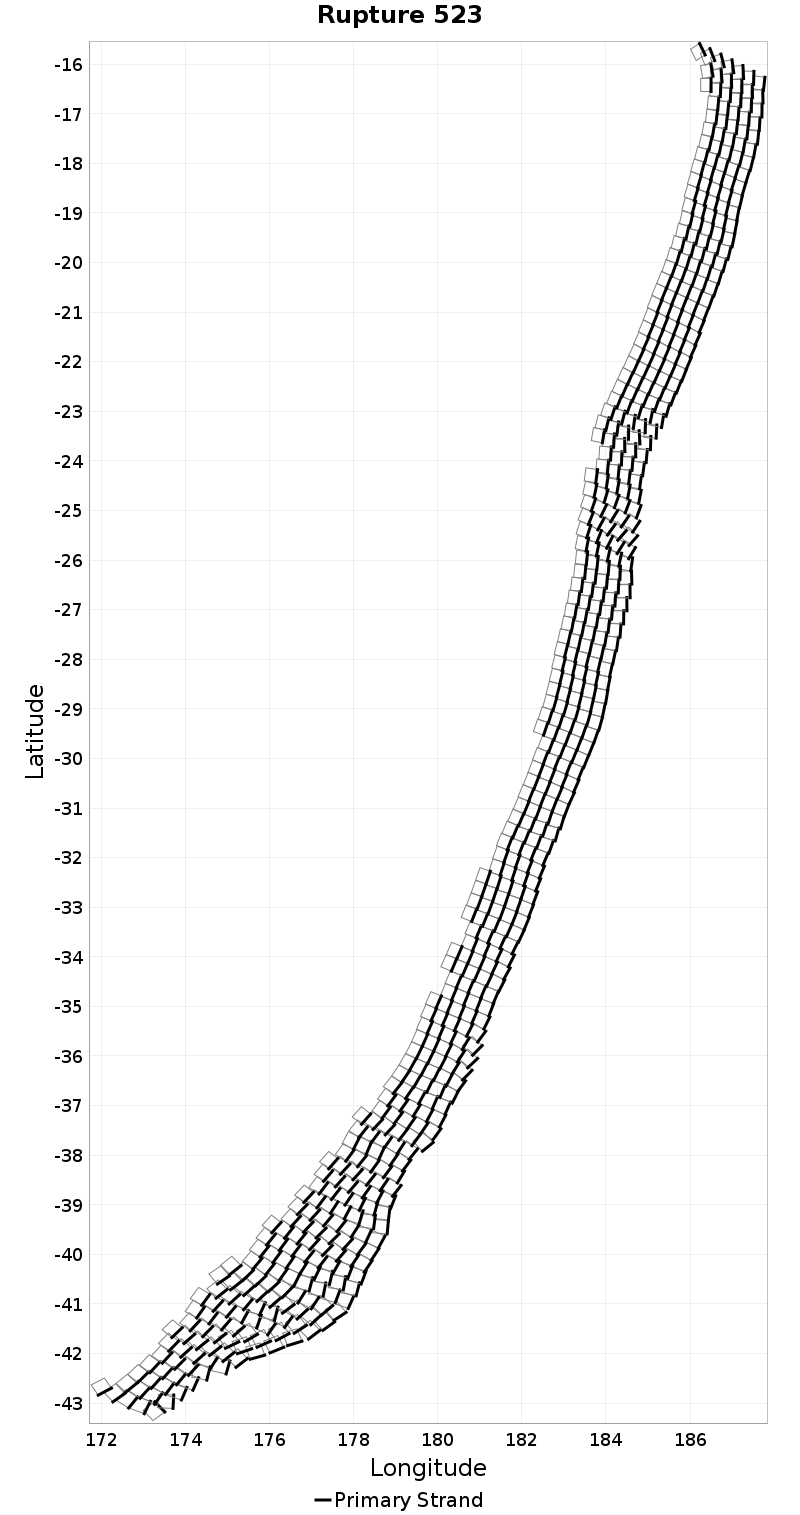
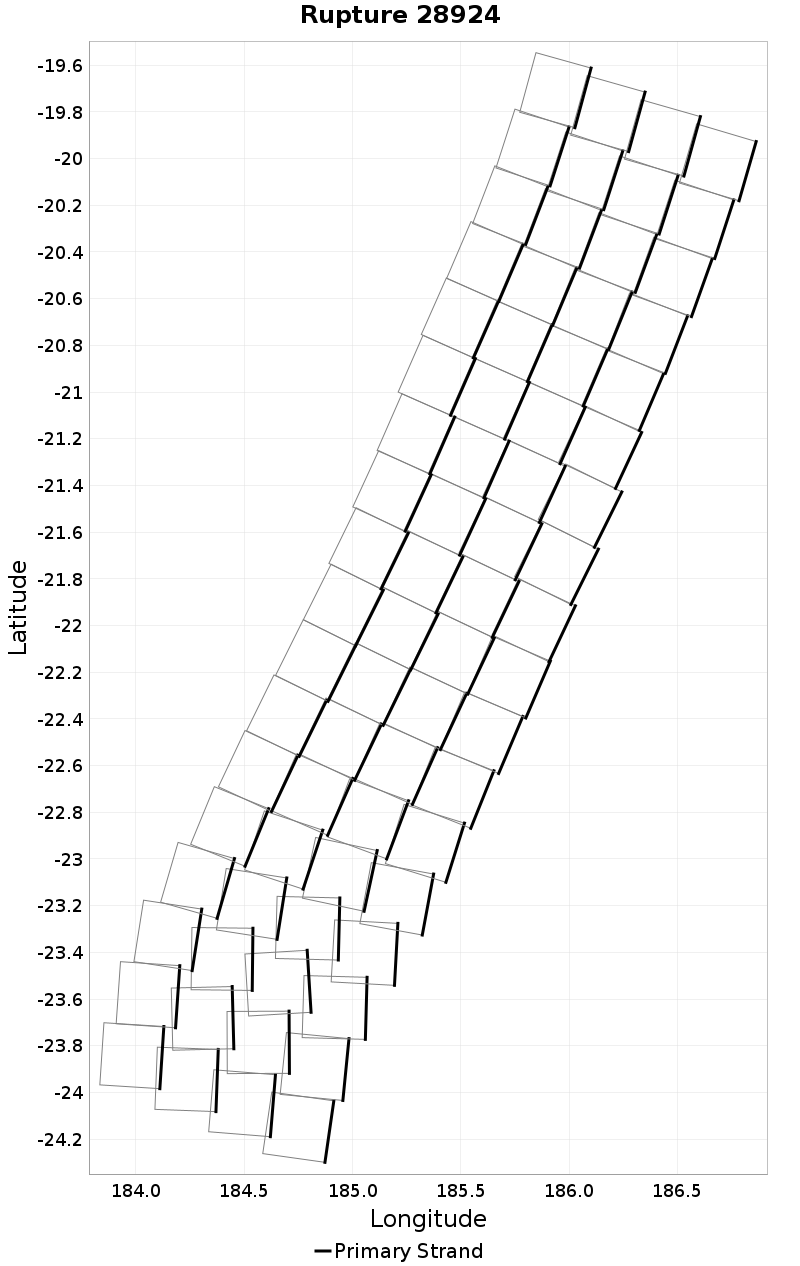
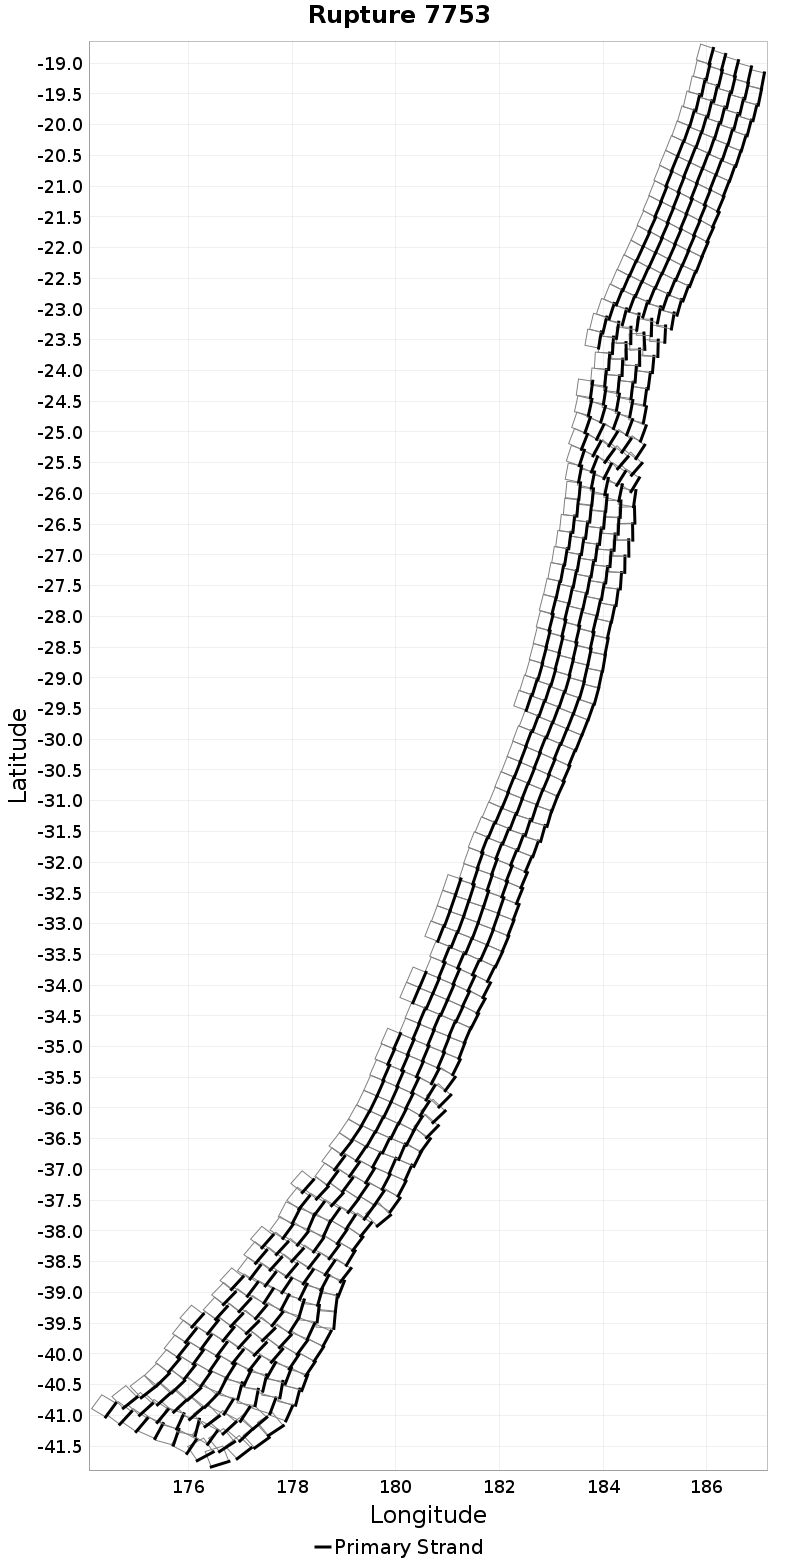
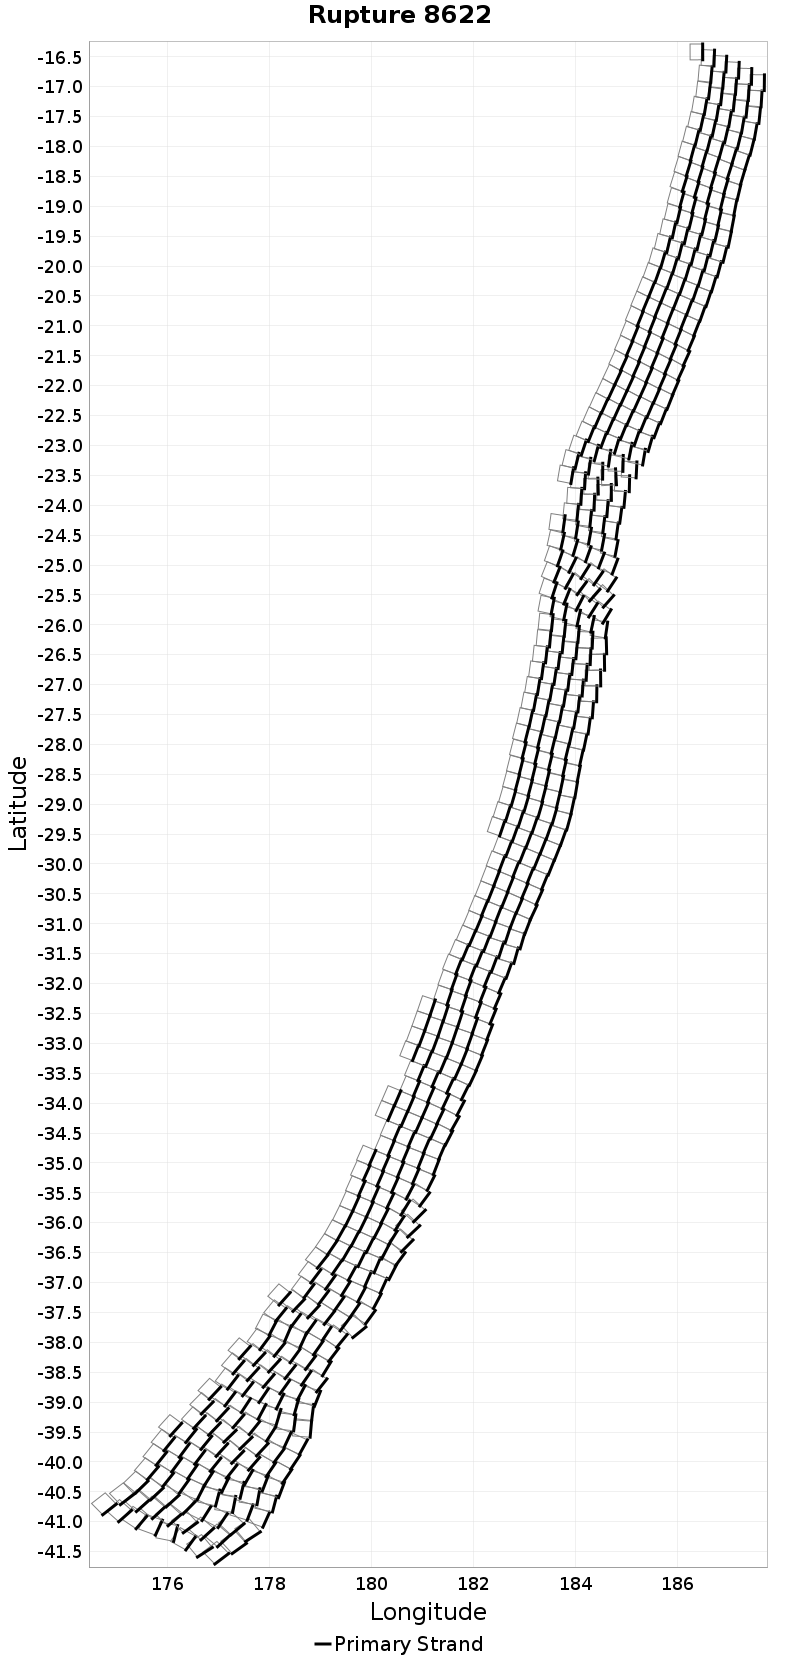
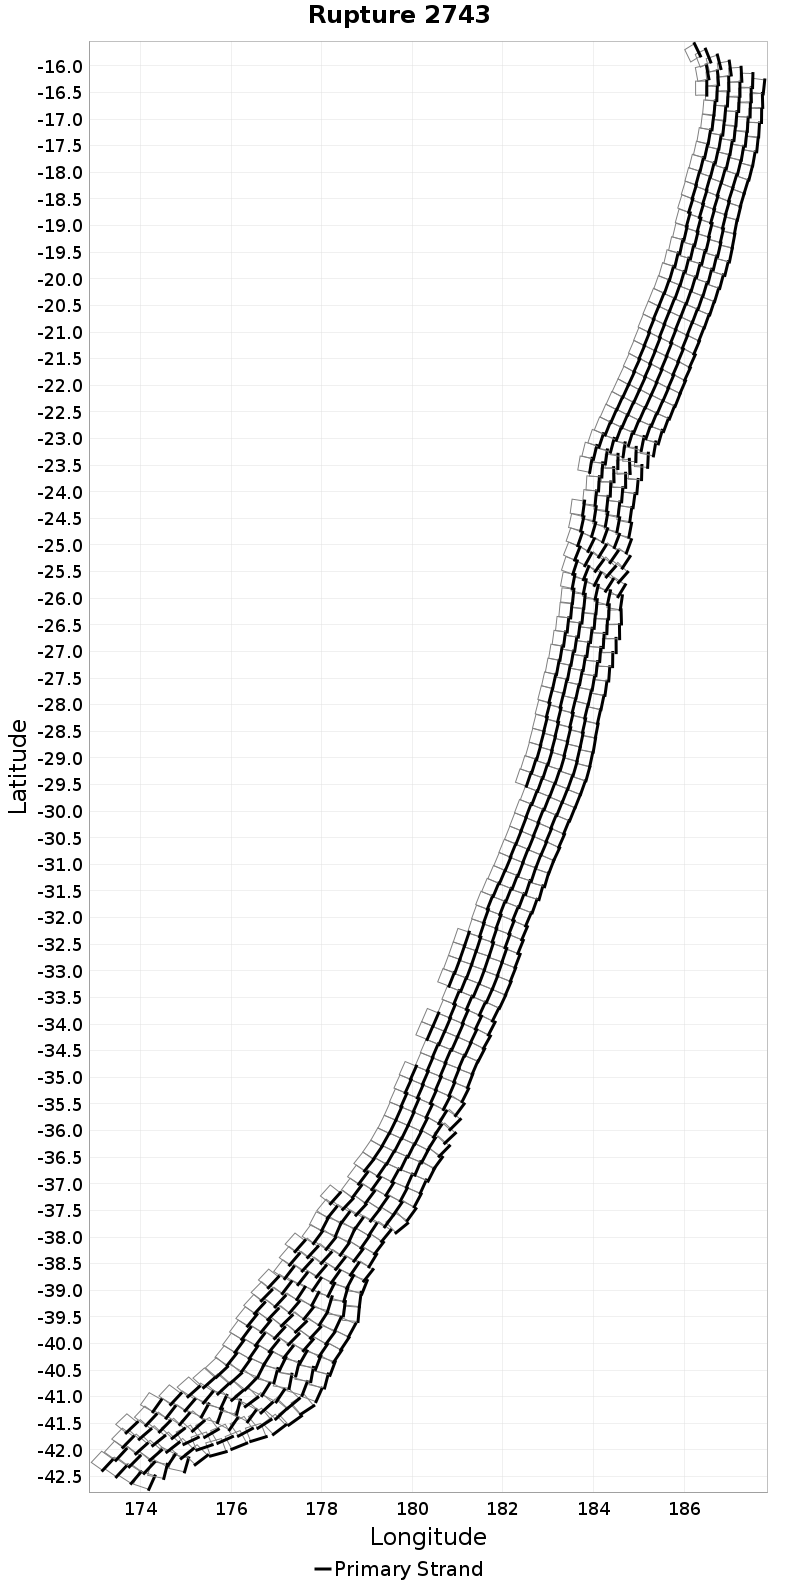
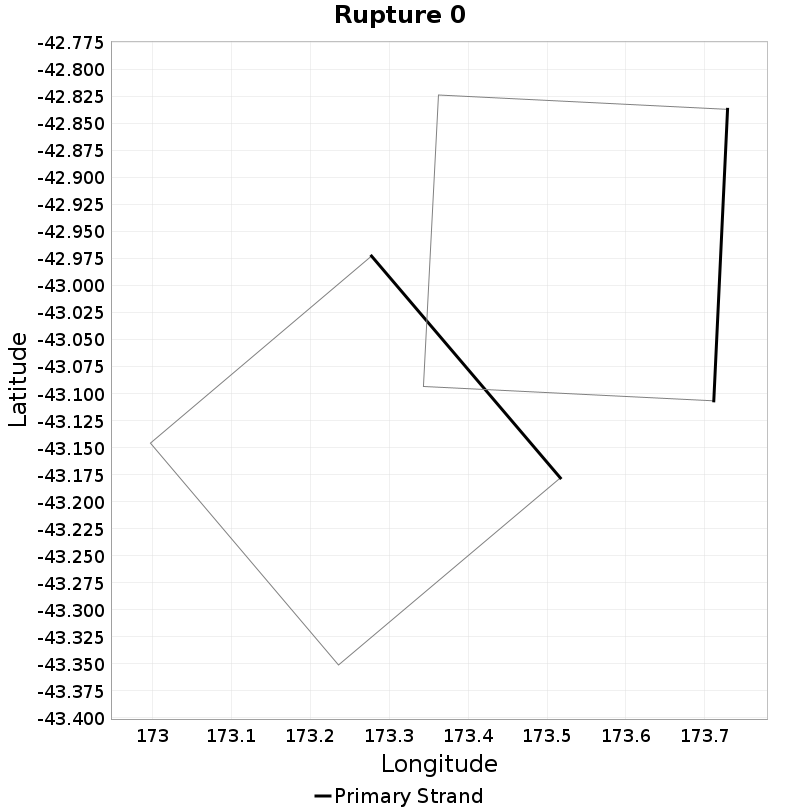
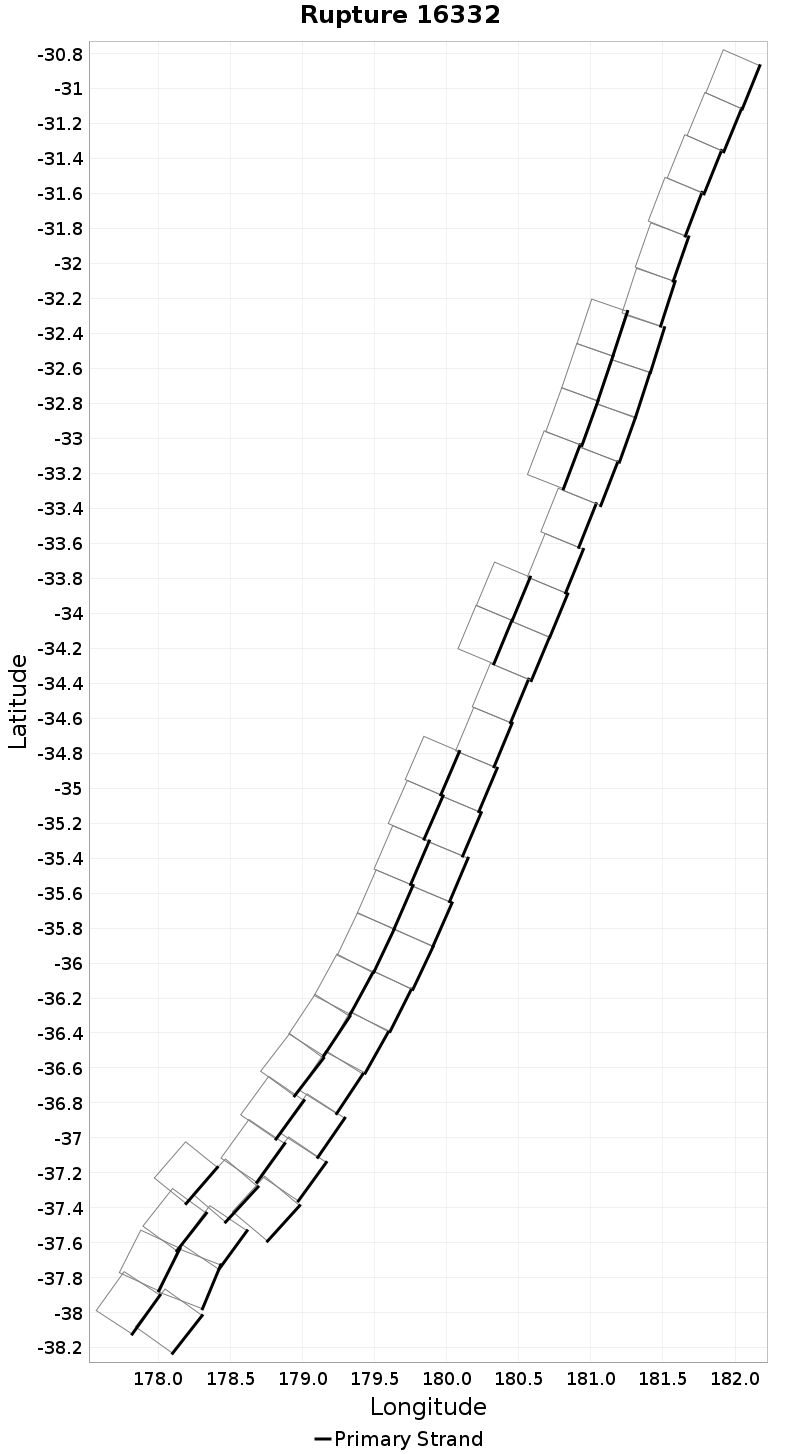
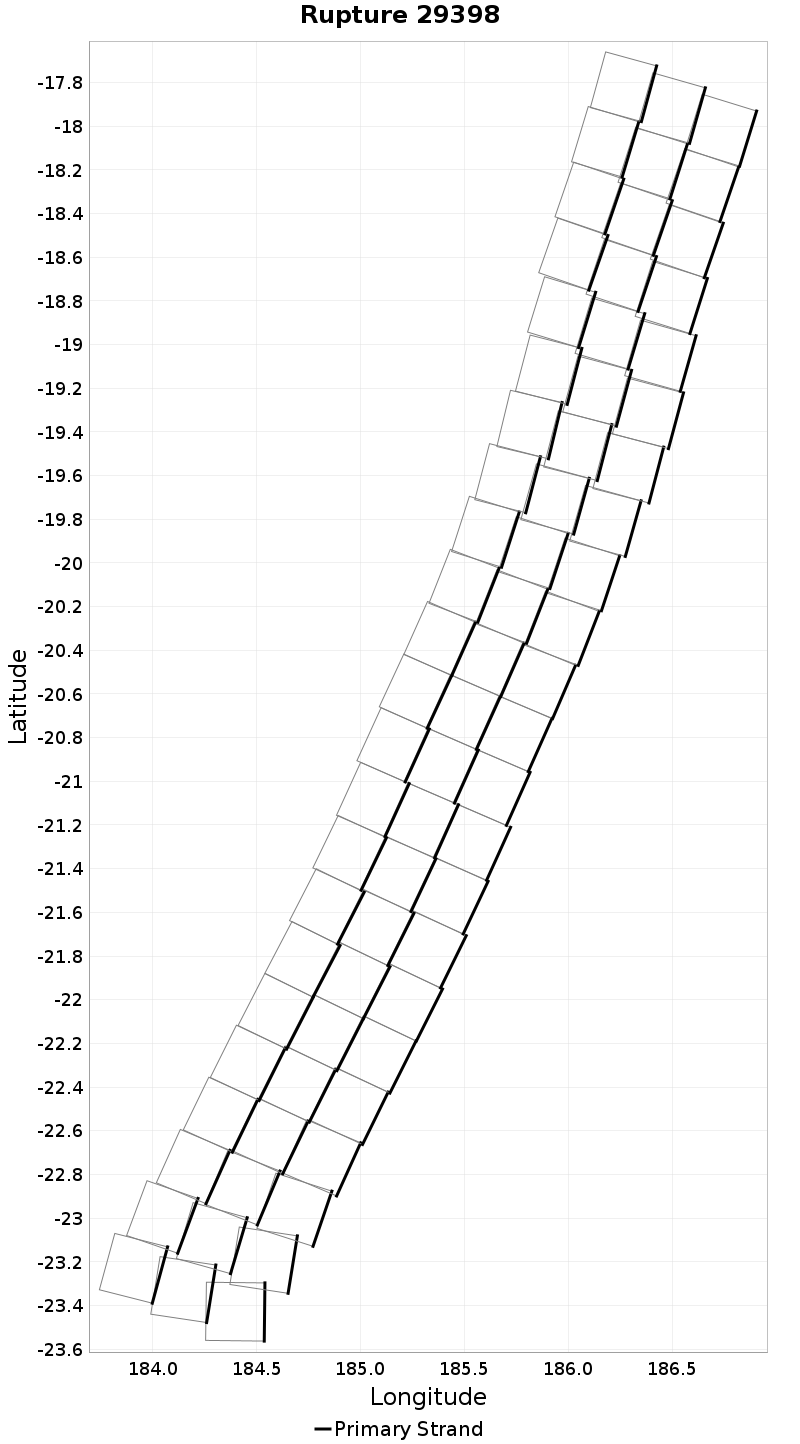
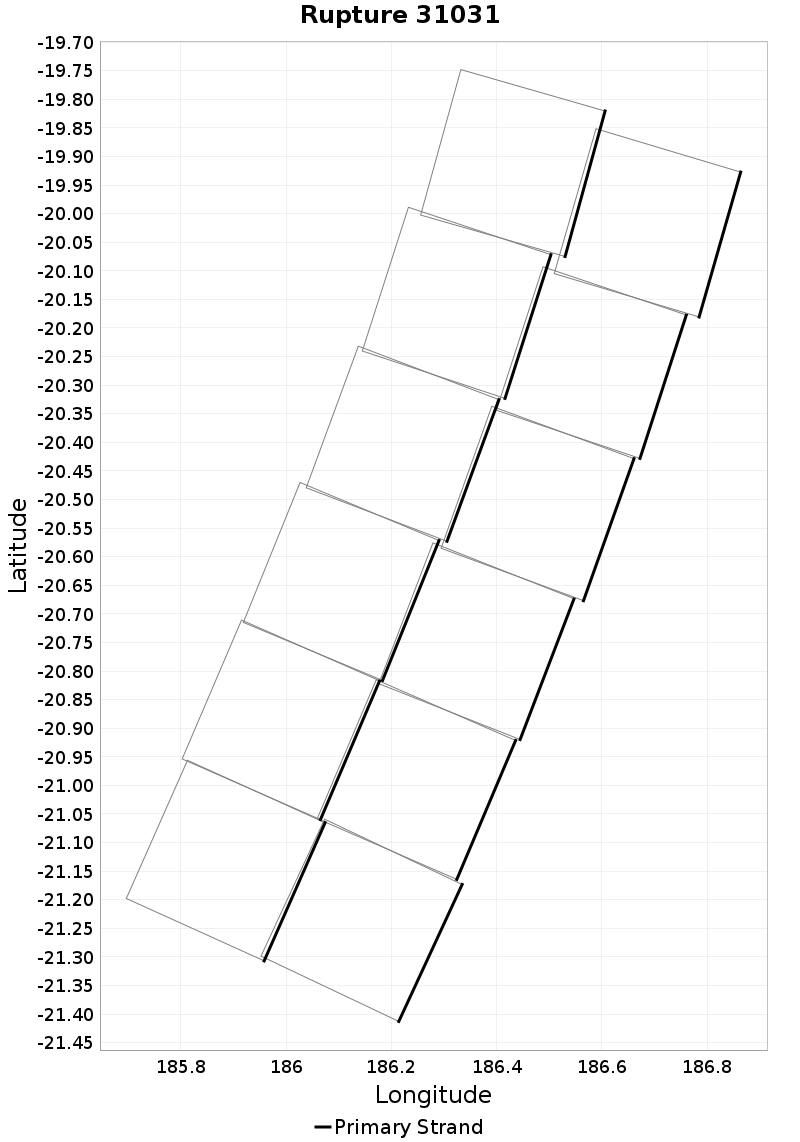
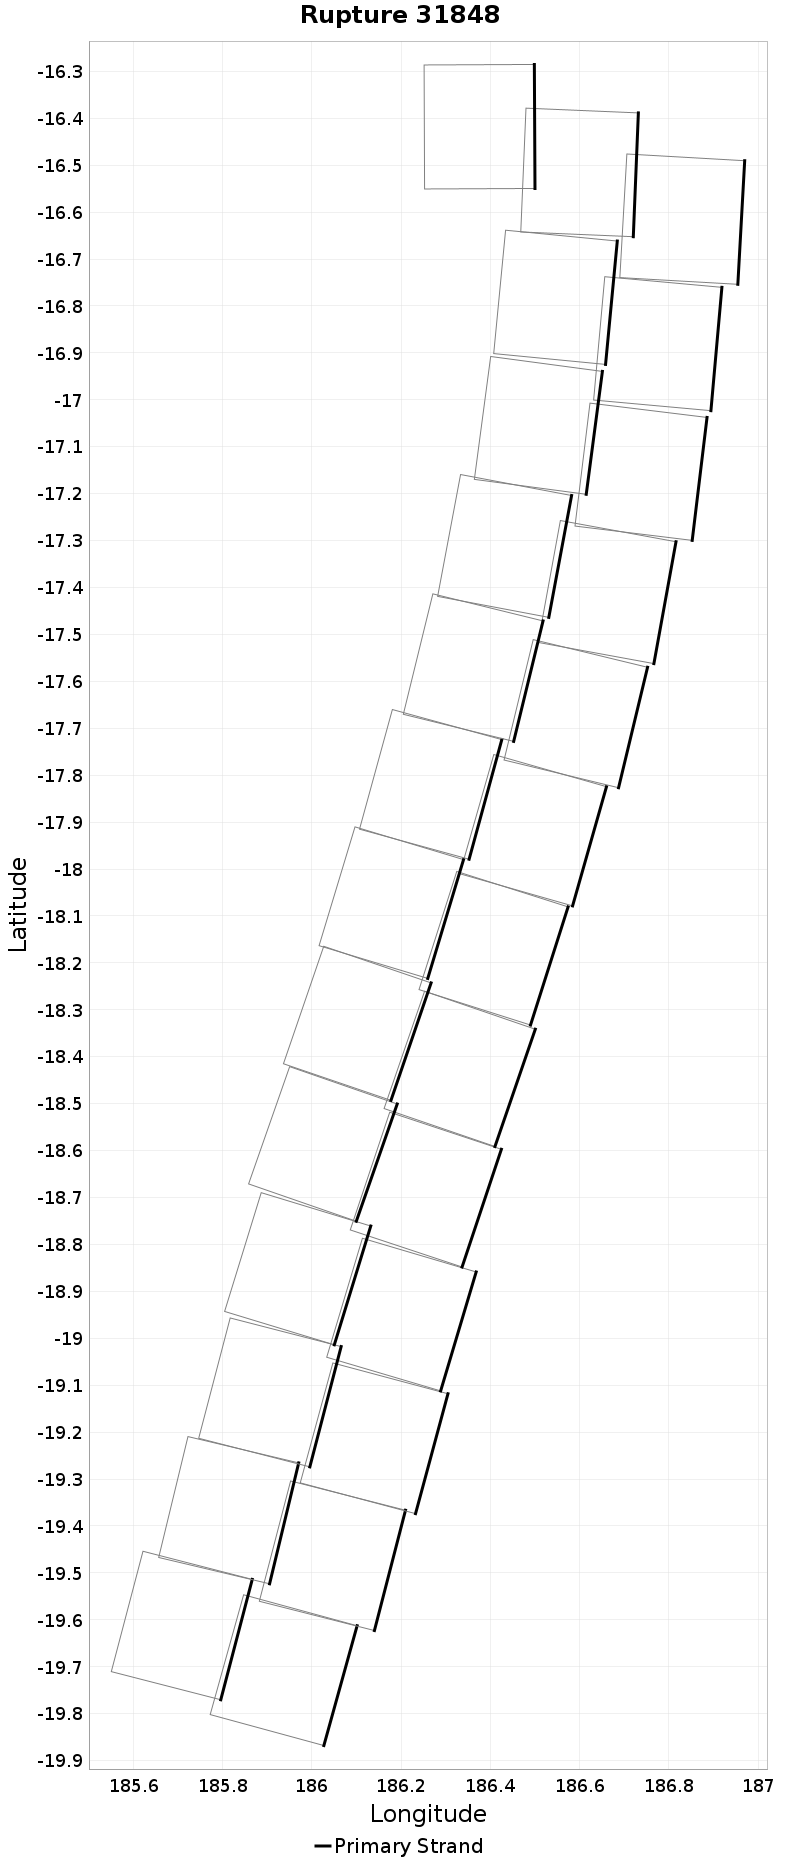
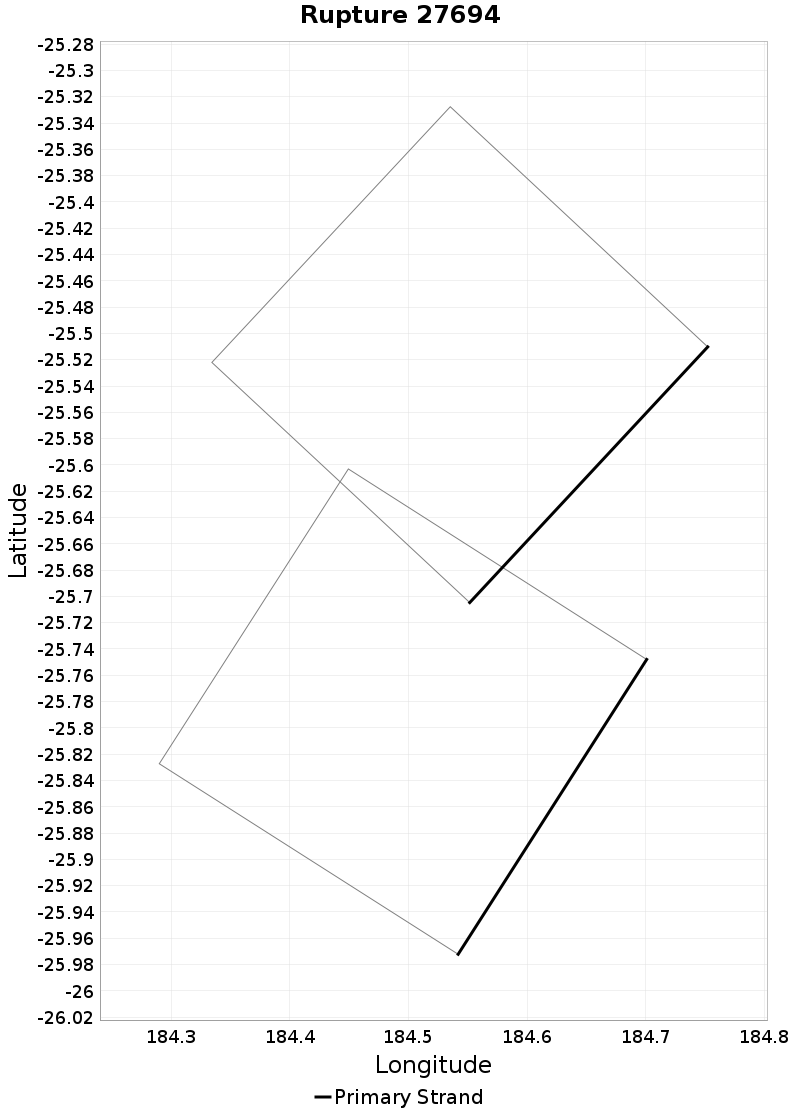
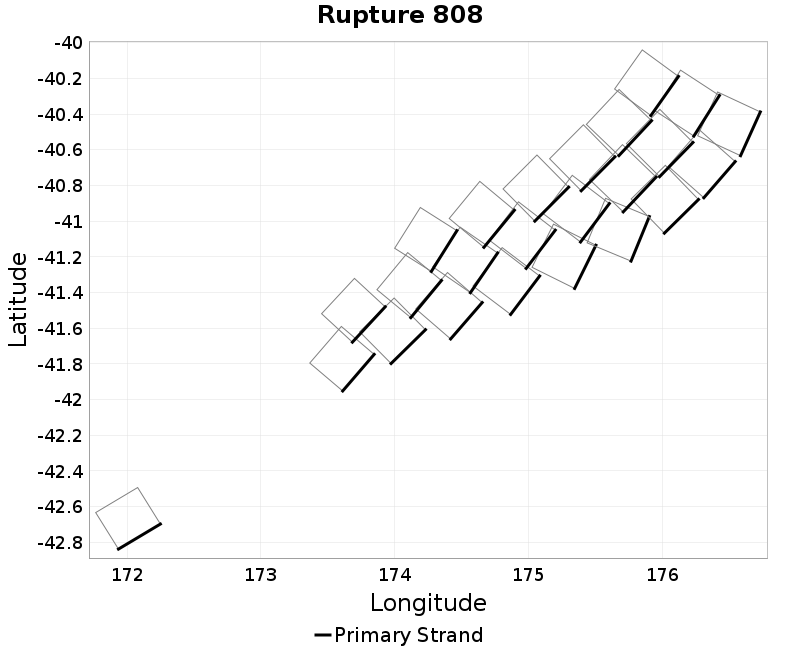
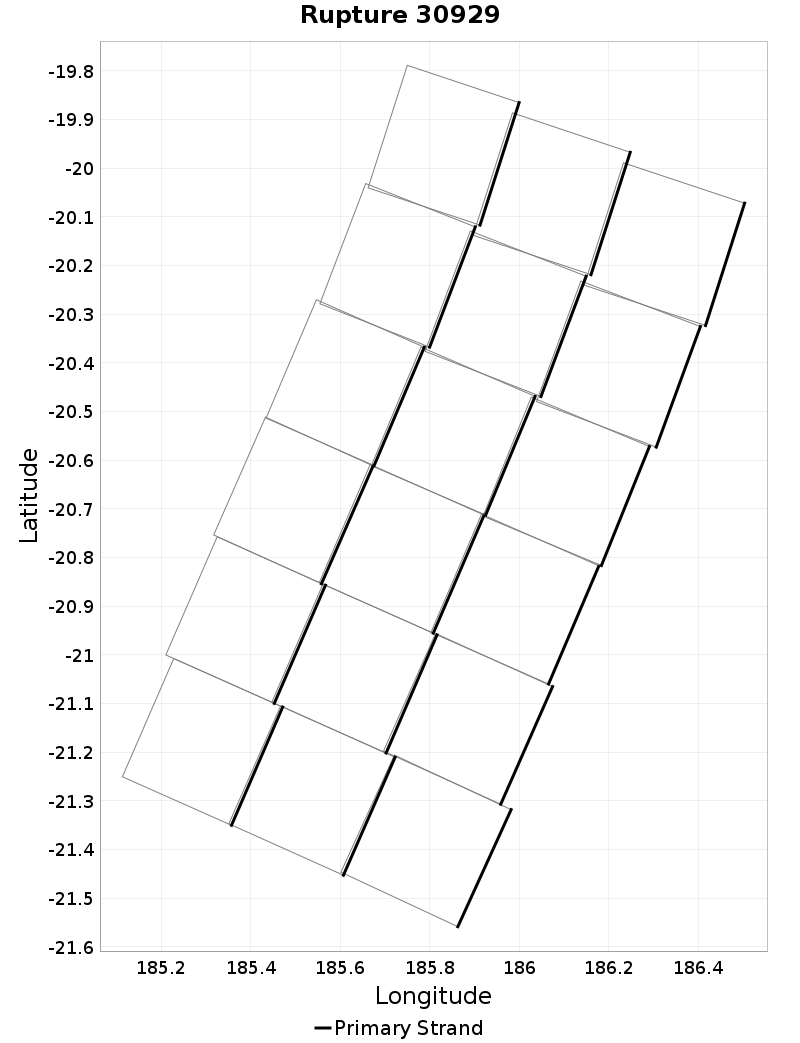
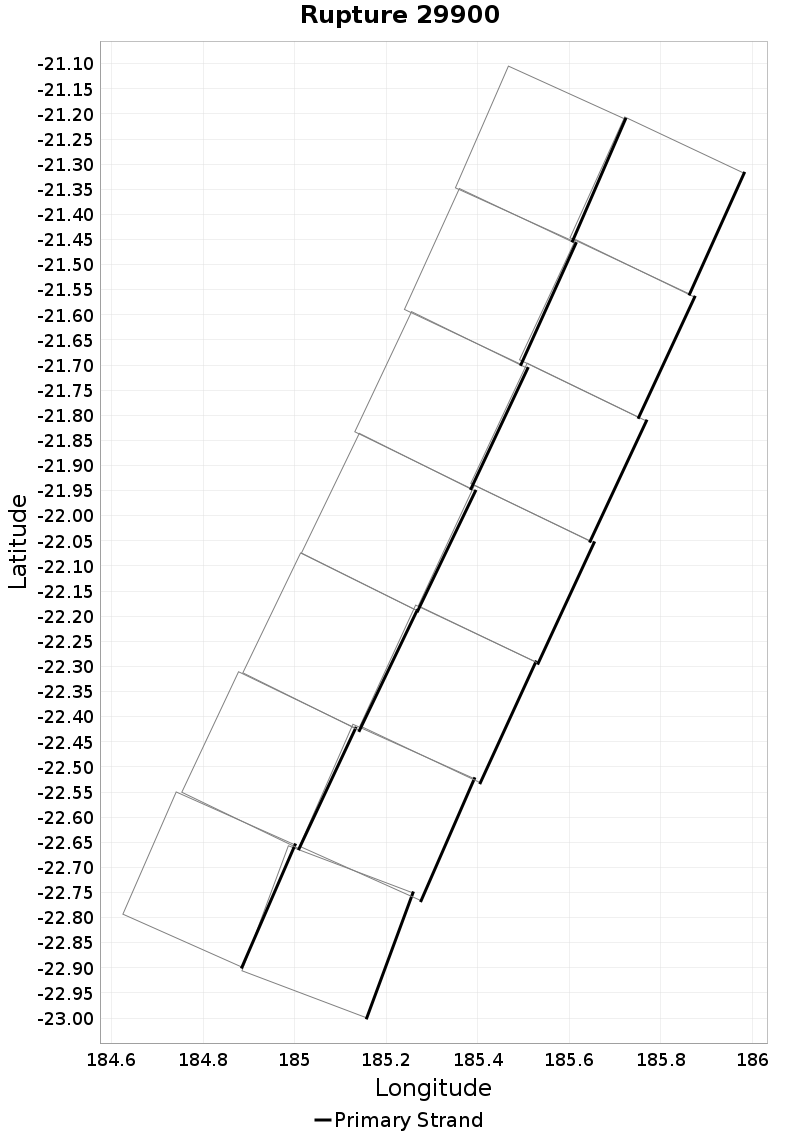
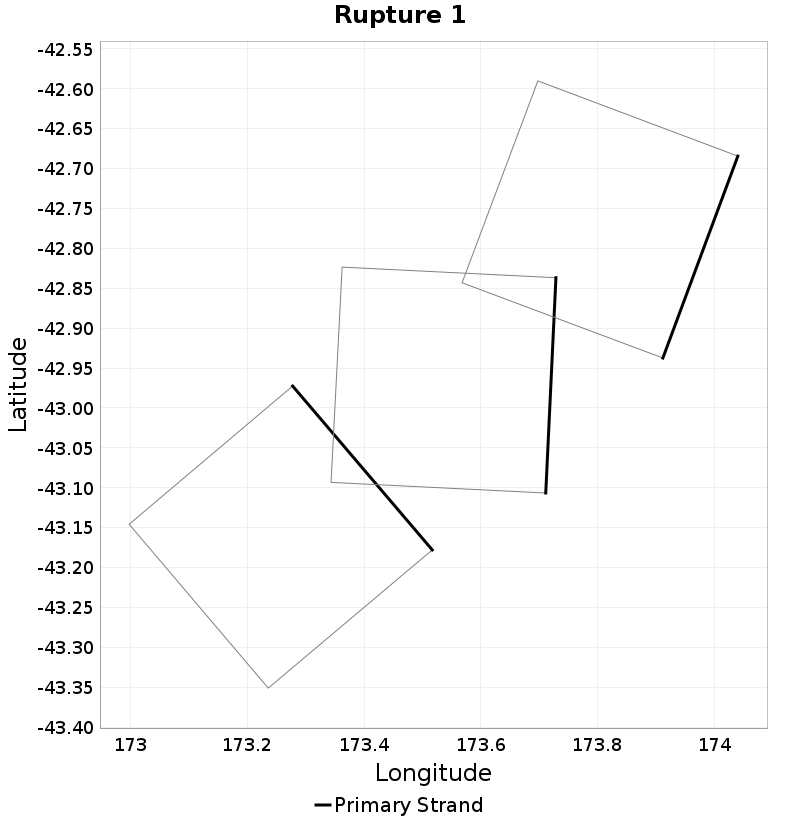
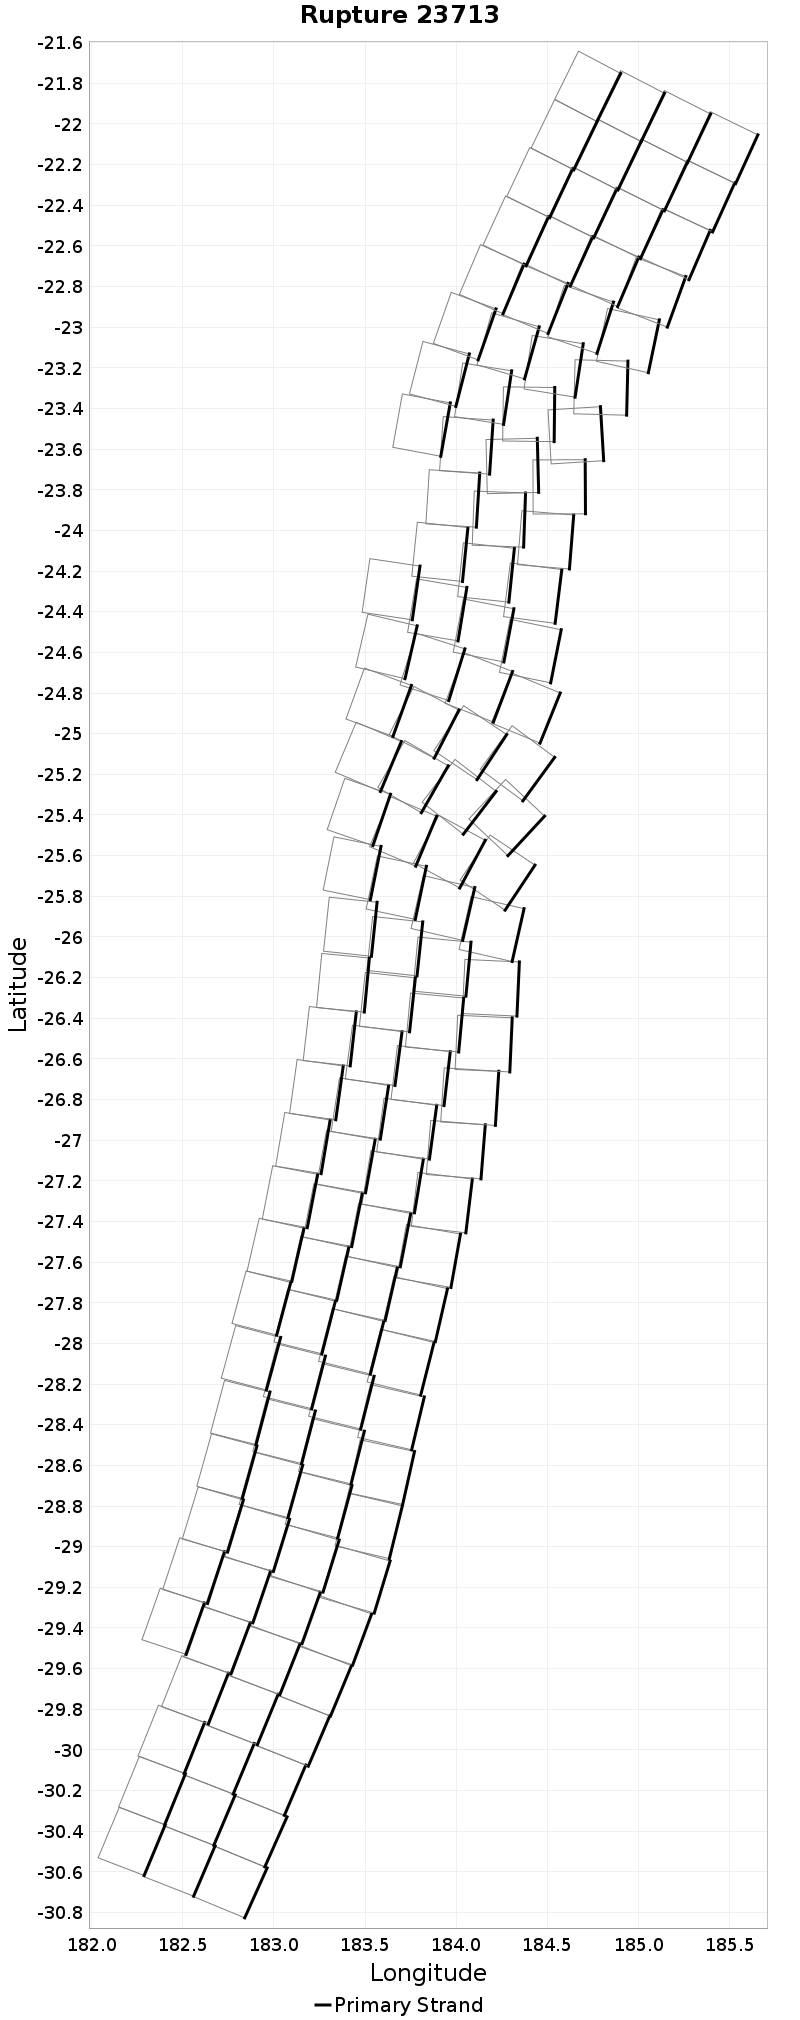
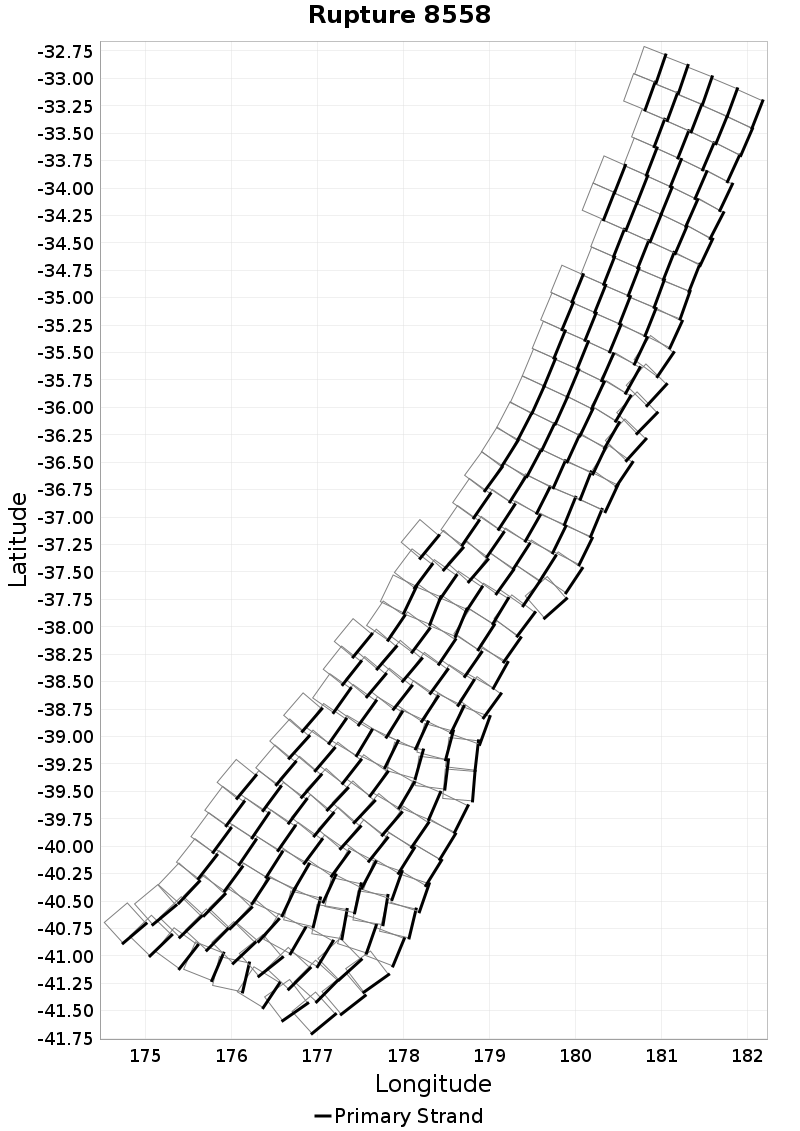
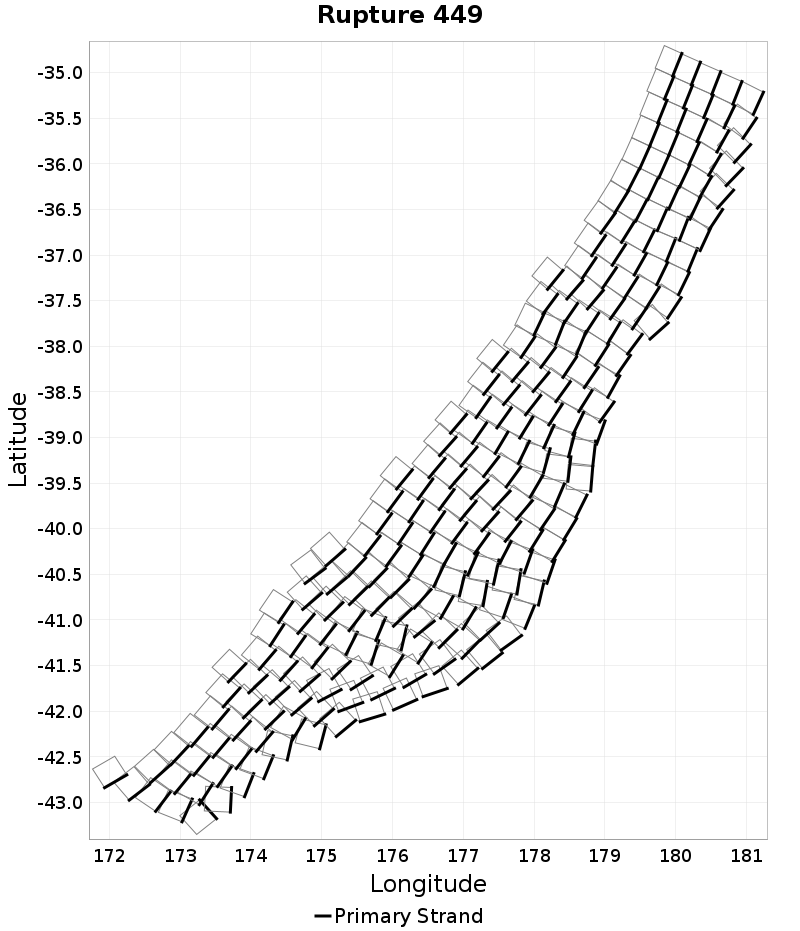
Rupture Length Extremes & Examples
(top)
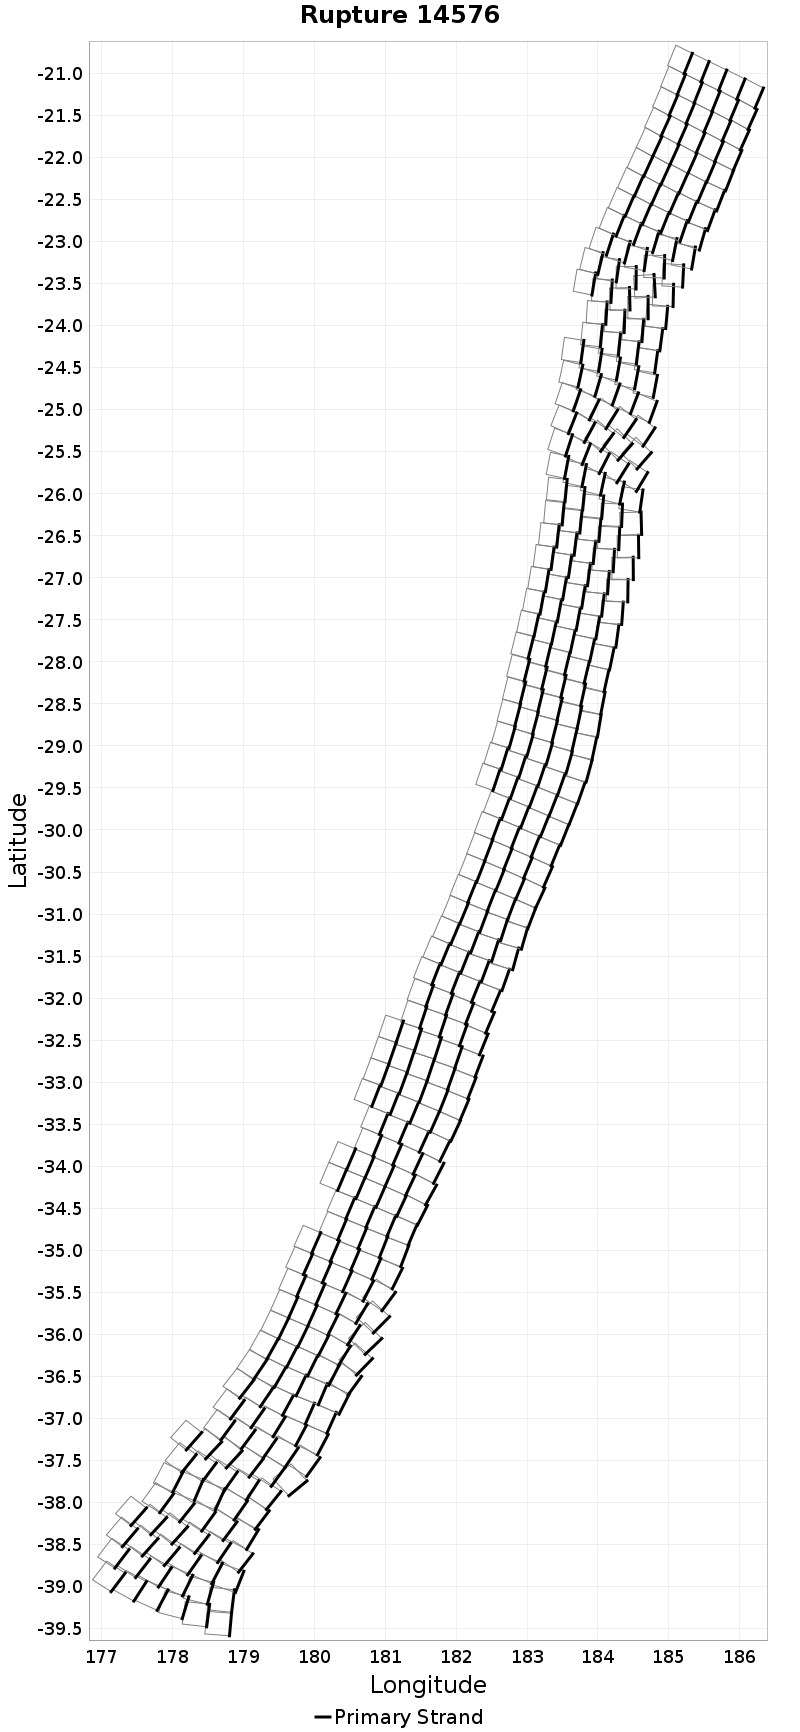
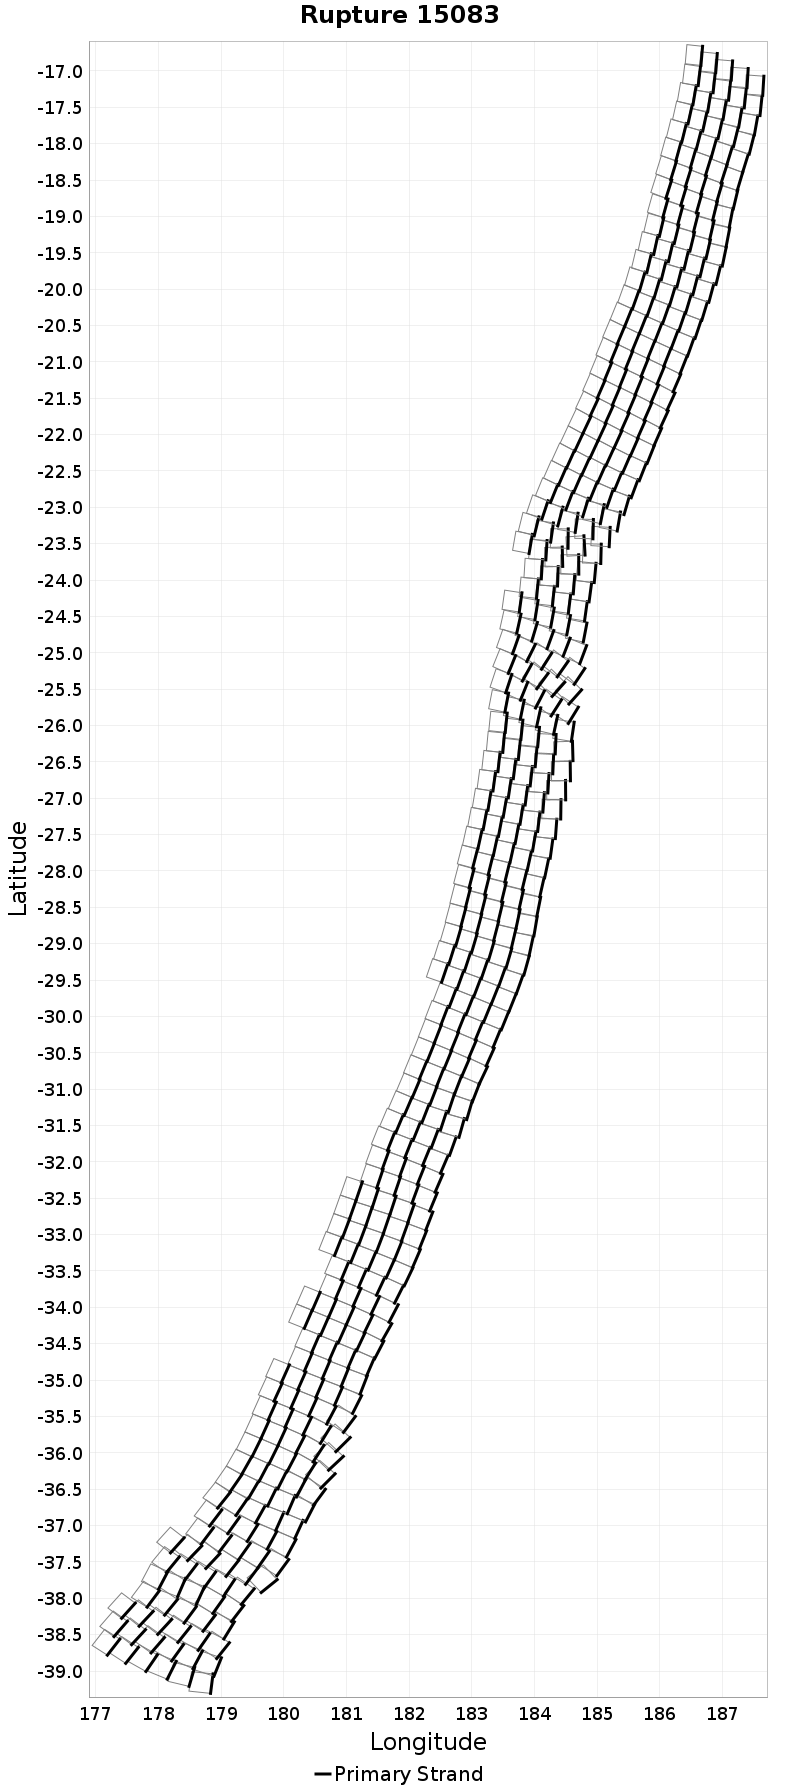
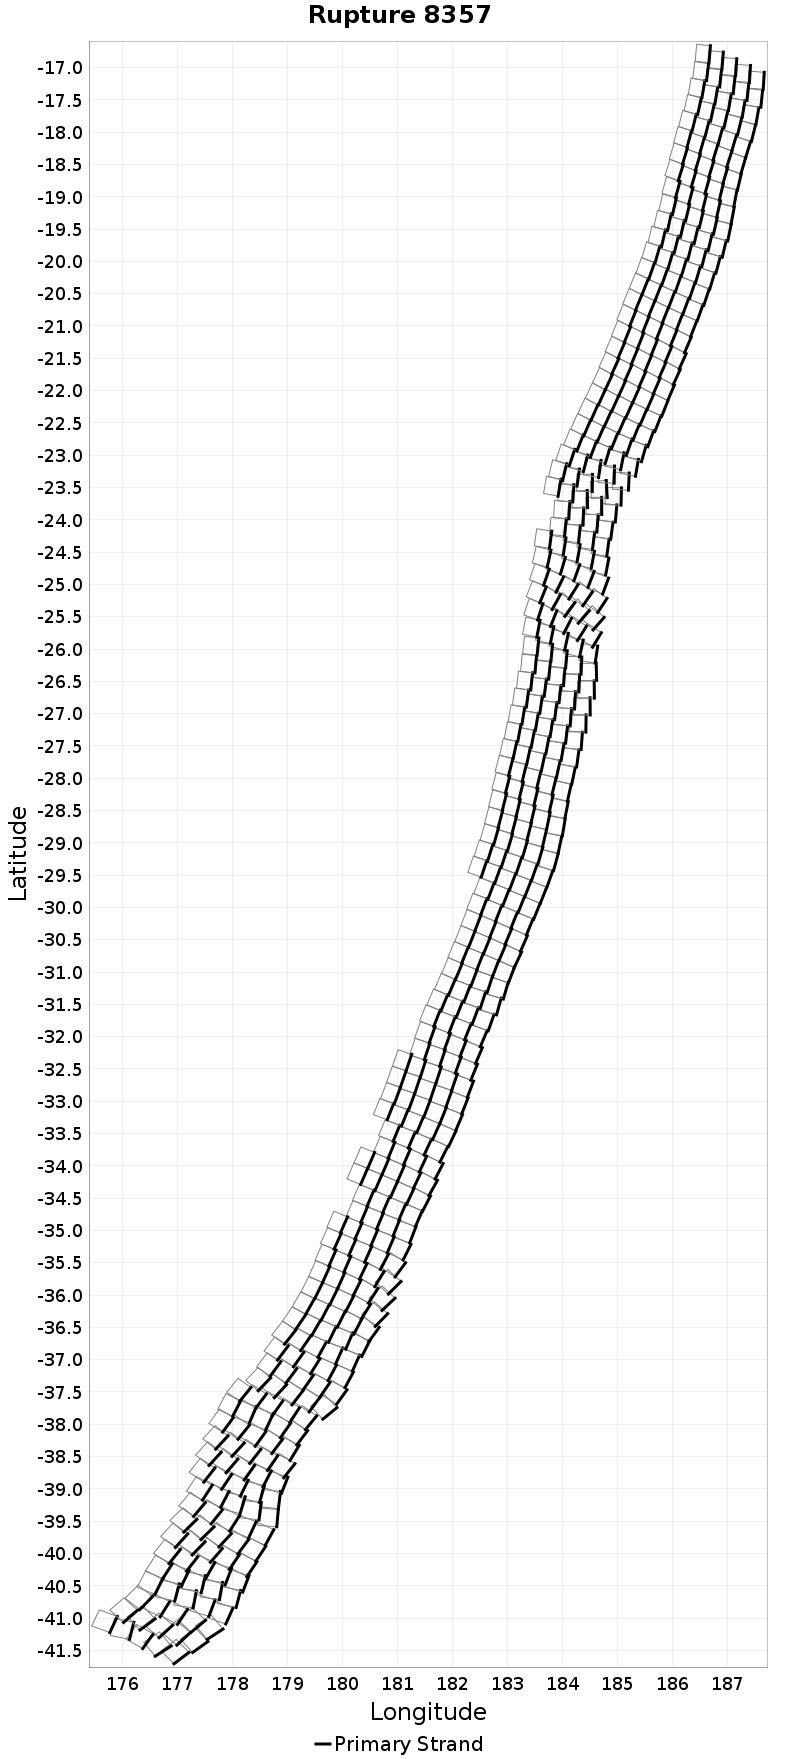
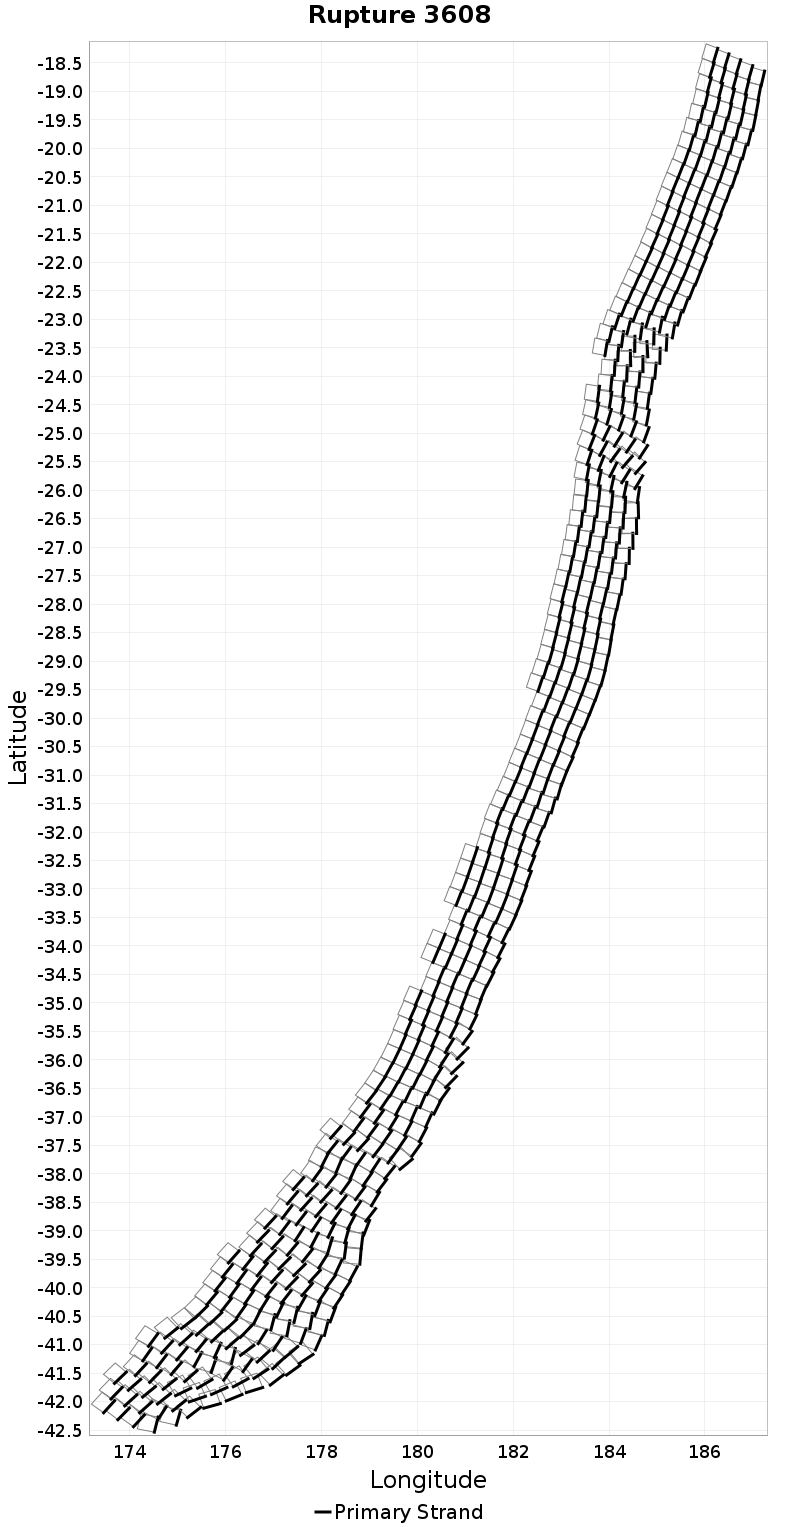
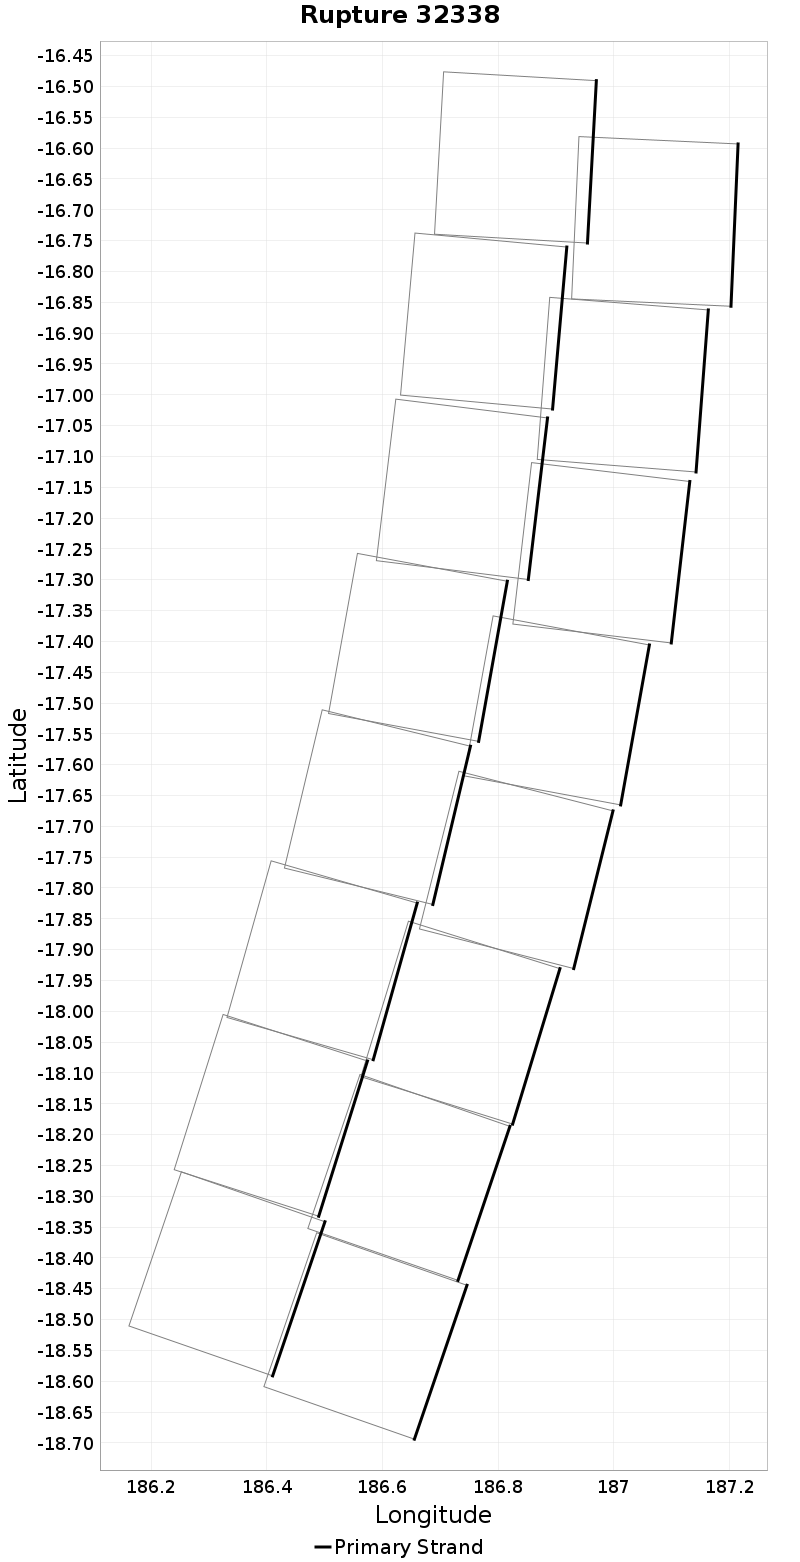
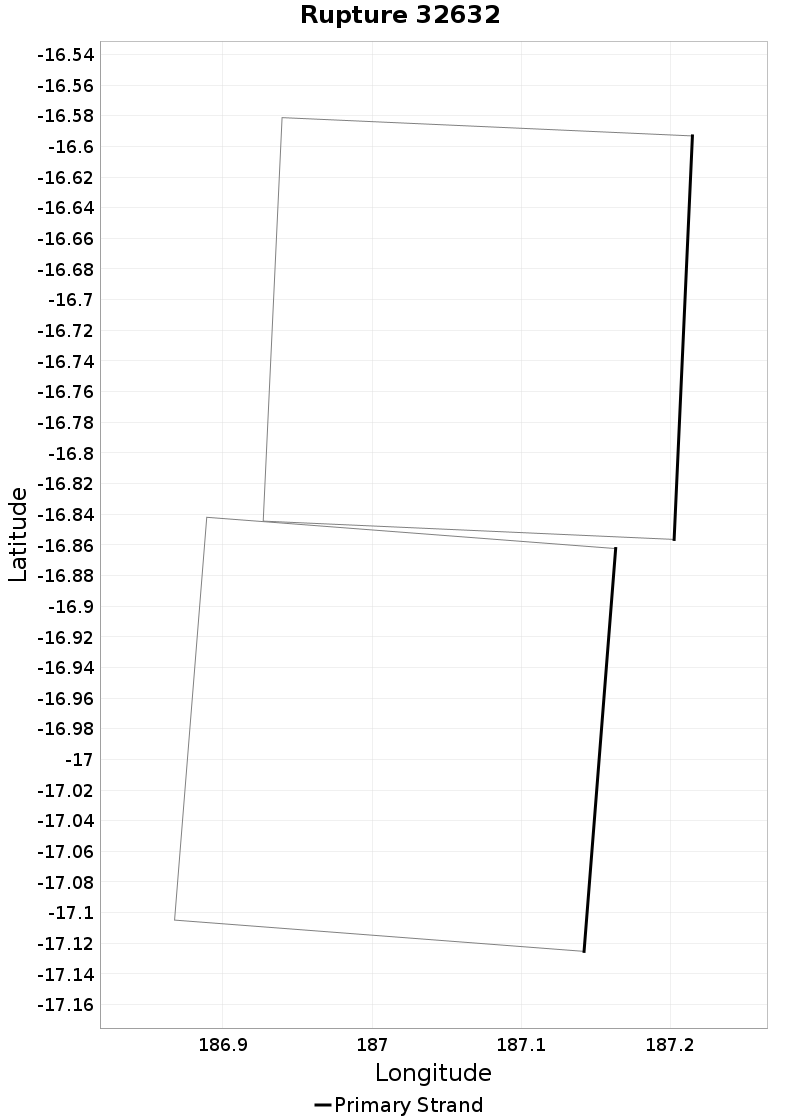
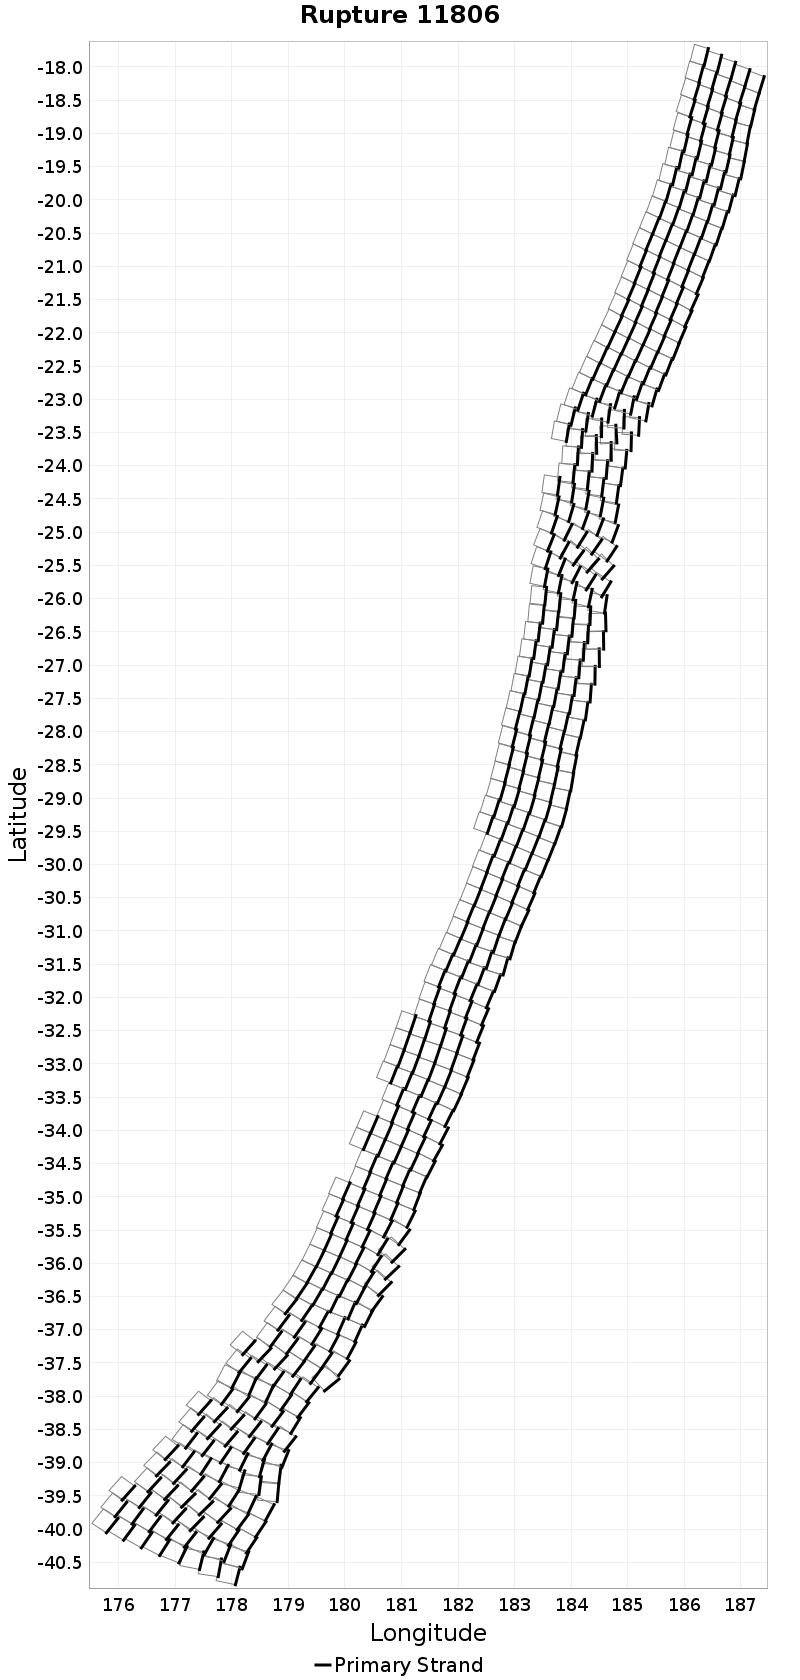
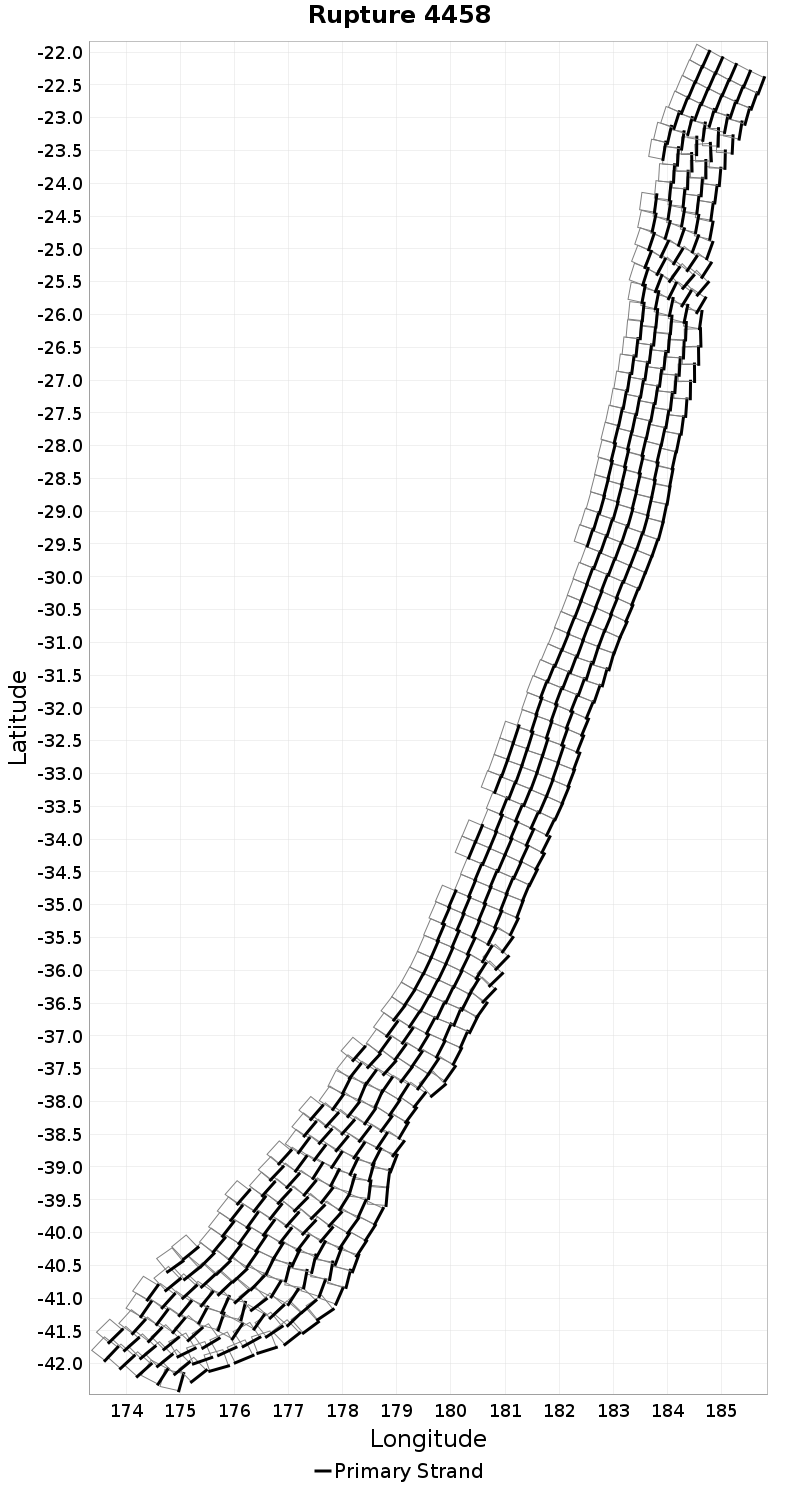
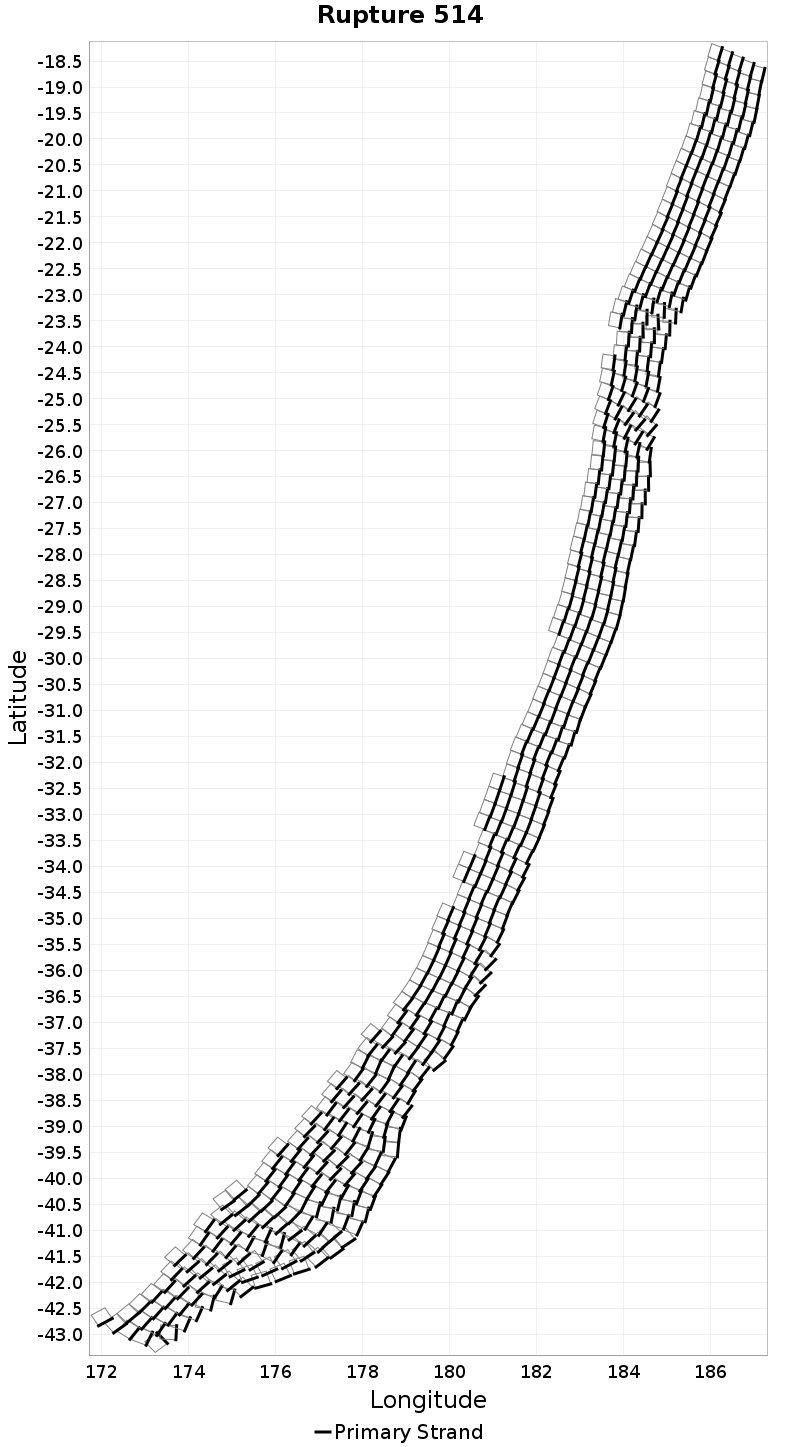
Example ruptures at various percentiles of Rupture Length
| Minimum: 29.36 | p50: 568.64 | p90: 2113.3 | p95: 2529.66 |
|---|
 |  | 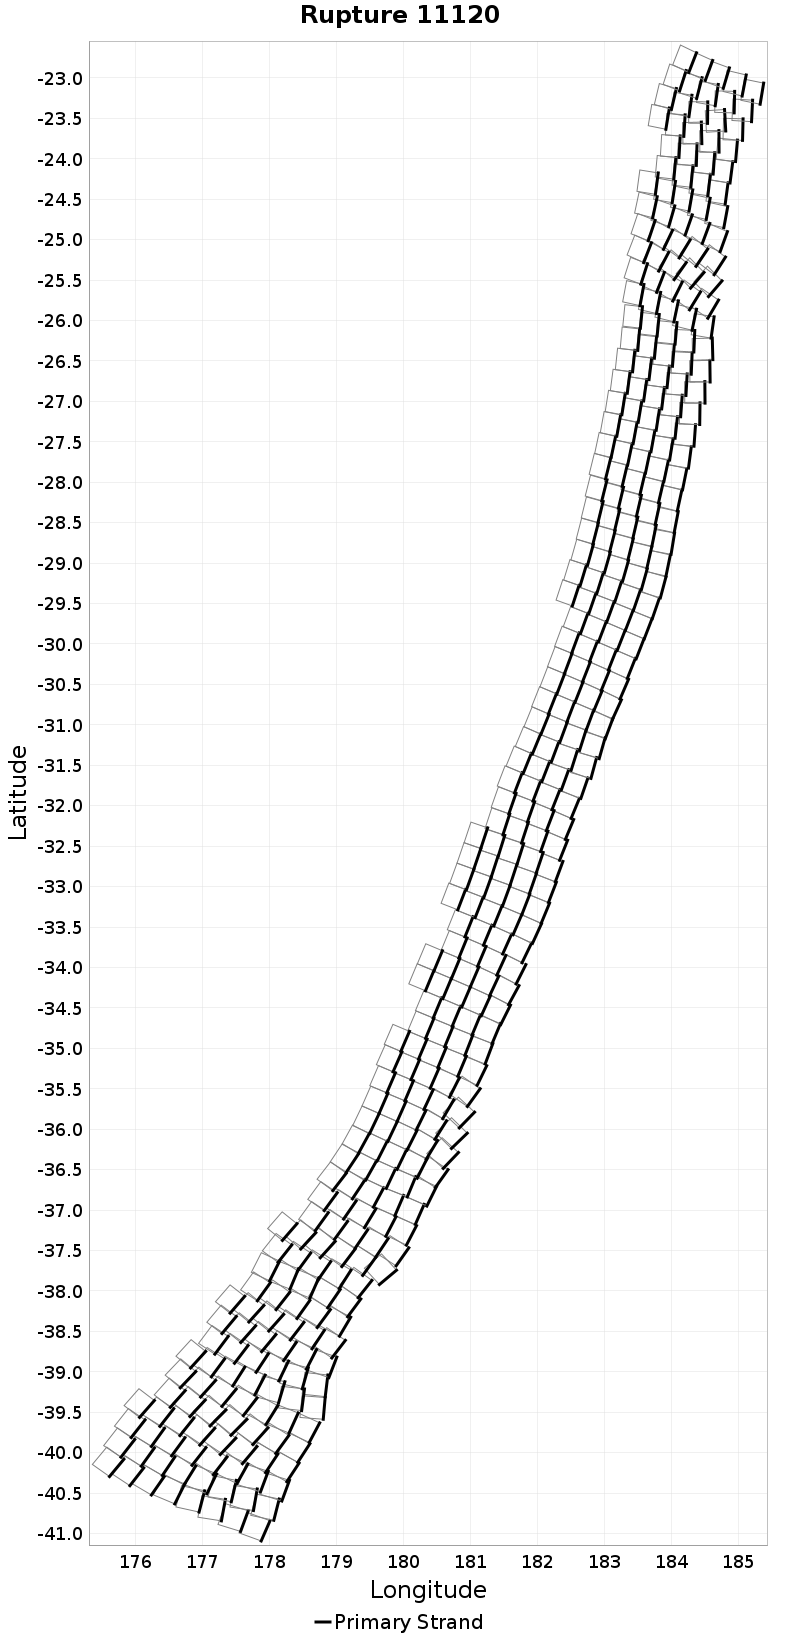 |  |
| p97.5: 2789.49 | p99: 2995.6 | p99.9: 3207.74 | Maximum: 3295.47 |
 |  |  |  |
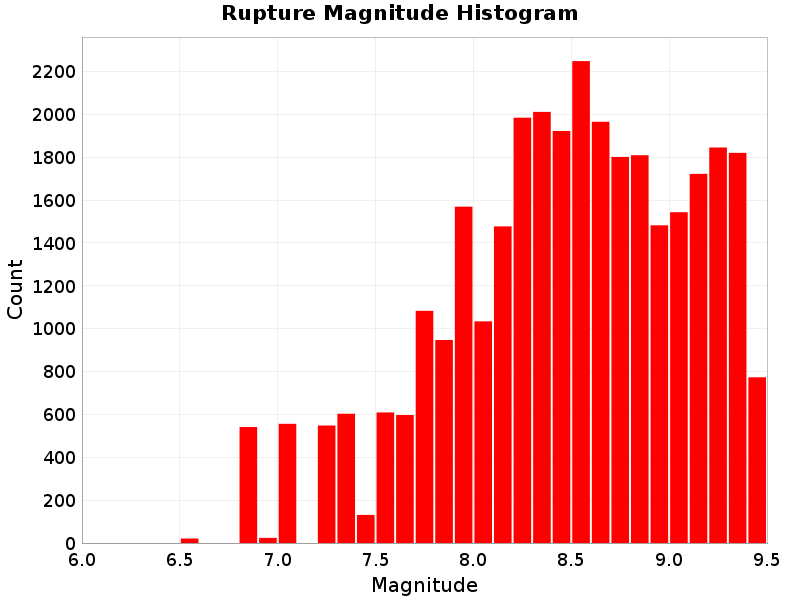
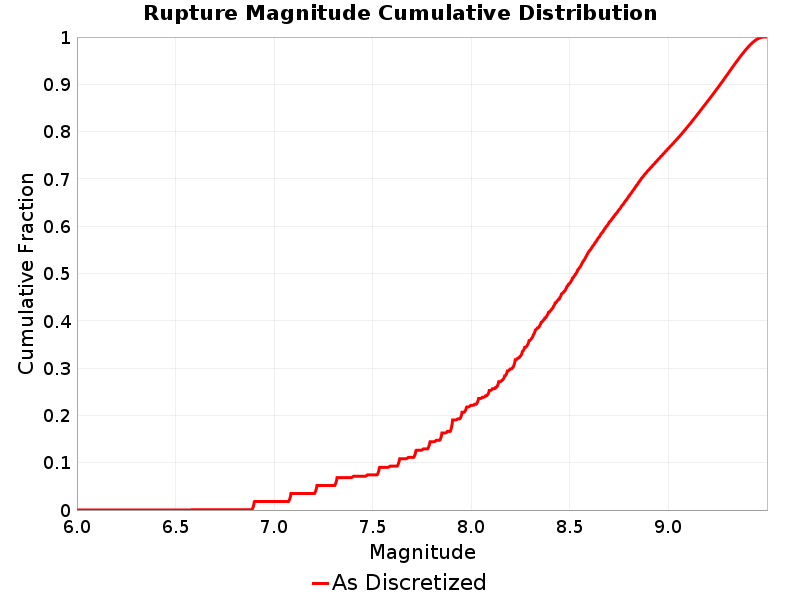
Rupture Magnitude
(top)
Magnitude of the rupture.
Rupture Magnitude Extremes & Examples
(top)
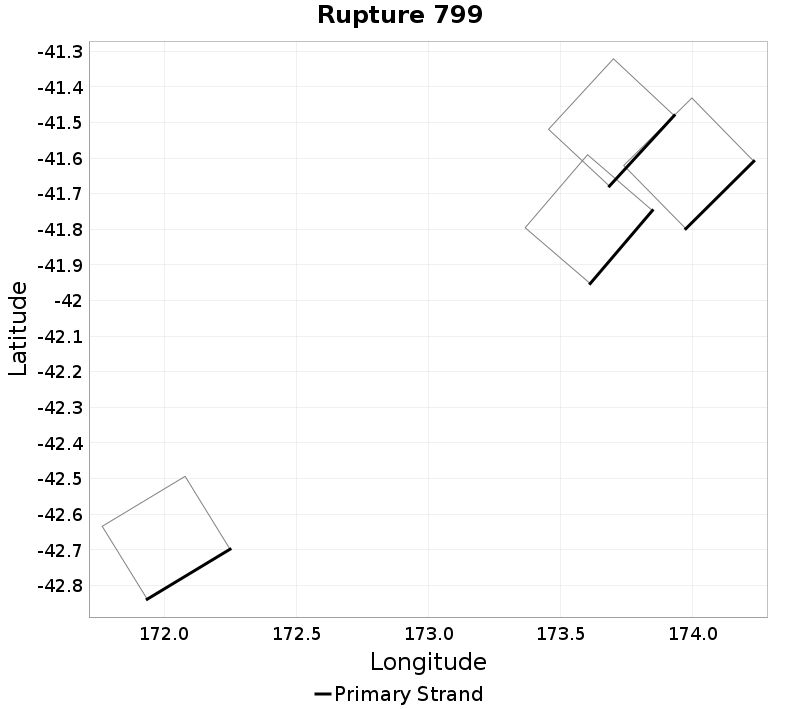
Example ruptures at various percentiles of Rupture Magnitude
| Minimum: 6.57 | p50: 8.53 | p90: 9.26 | p95: 9.35 |
|---|
|  |  |  |
| p97.5: 9.4 | p99: 9.43 | p99.9: 9.47 | Maximum: 9.49 |
 |  |  | |
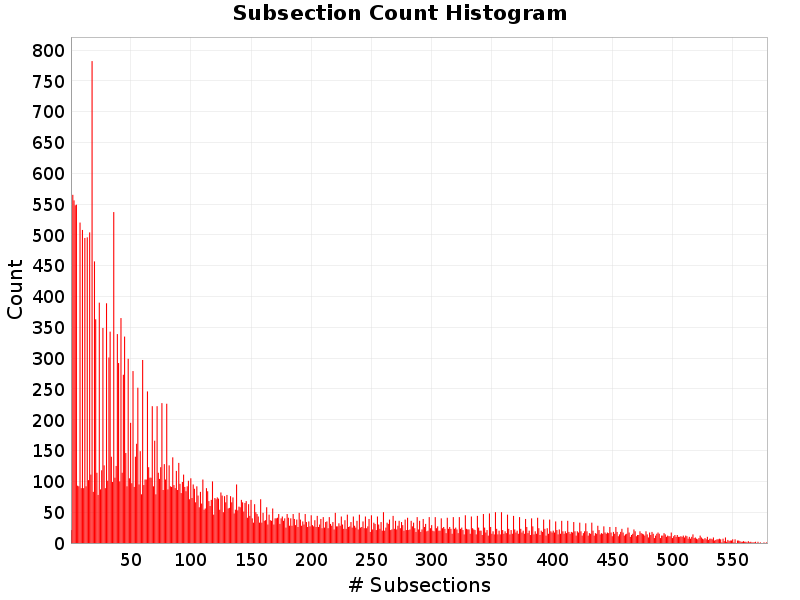
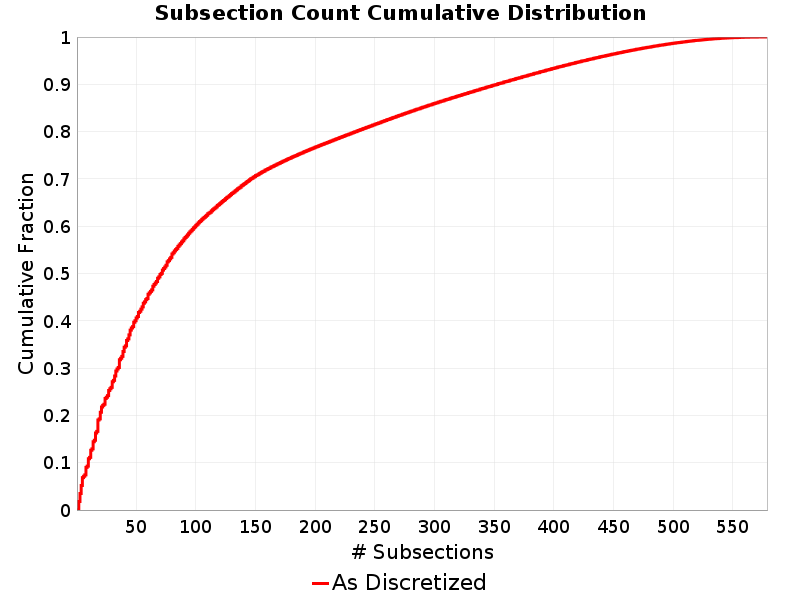
Subsection Count
(top)
Total number of subsections involved in a rupture.
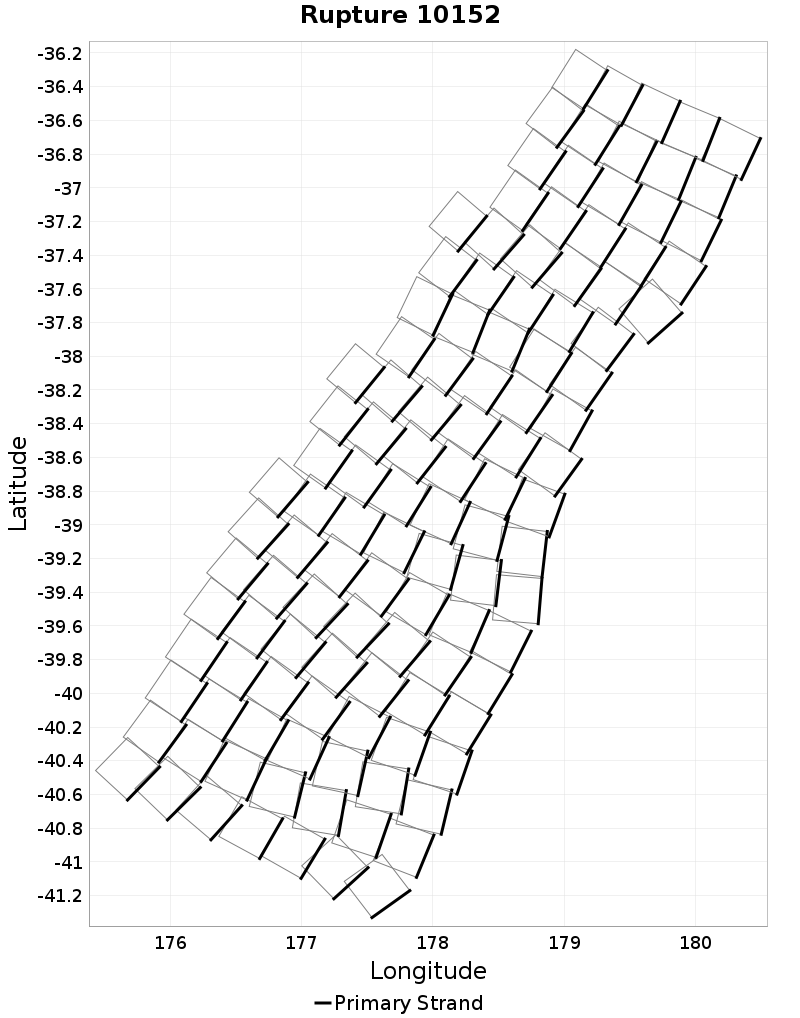
Subsection Count Extremes & Examples
(top)
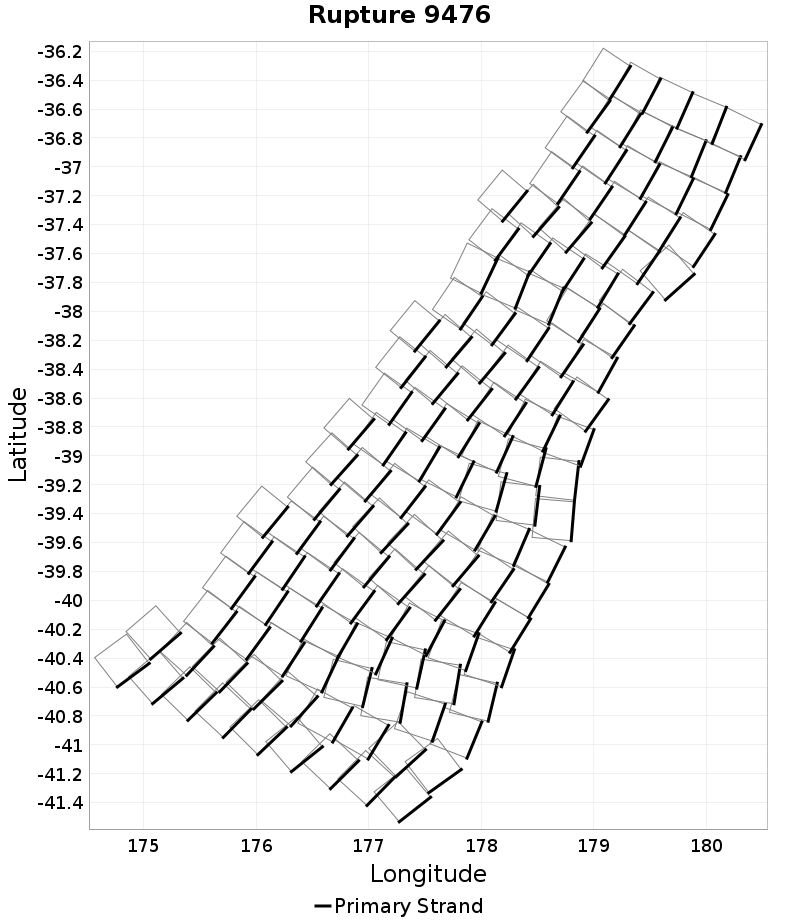
Example ruptures at various percentiles of Subsection Count
| Minimum: 1 | p50: 71 | p90: 353 | p95: 426 |
|---|
 |  |  |  |
| p97.5: 472 | p99: 510 | p99.9: 555 | Maximum: 578 |
 |  |  | |
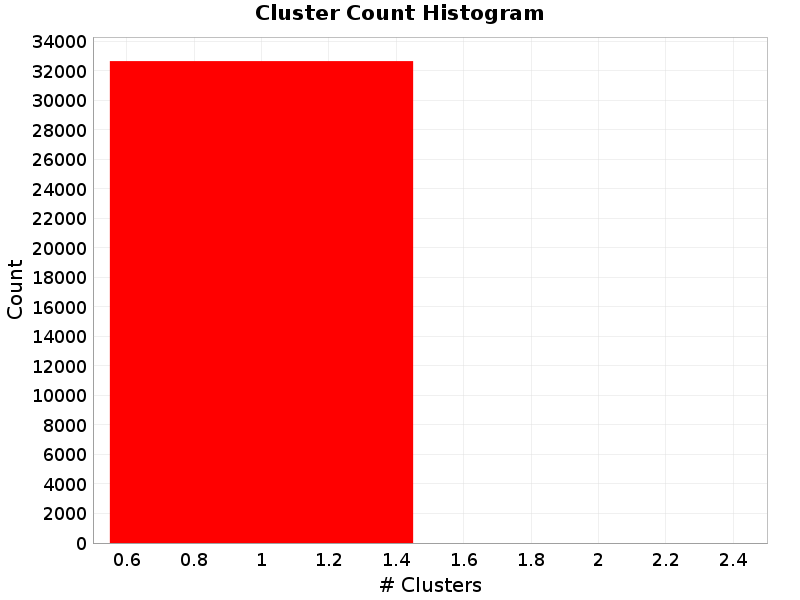
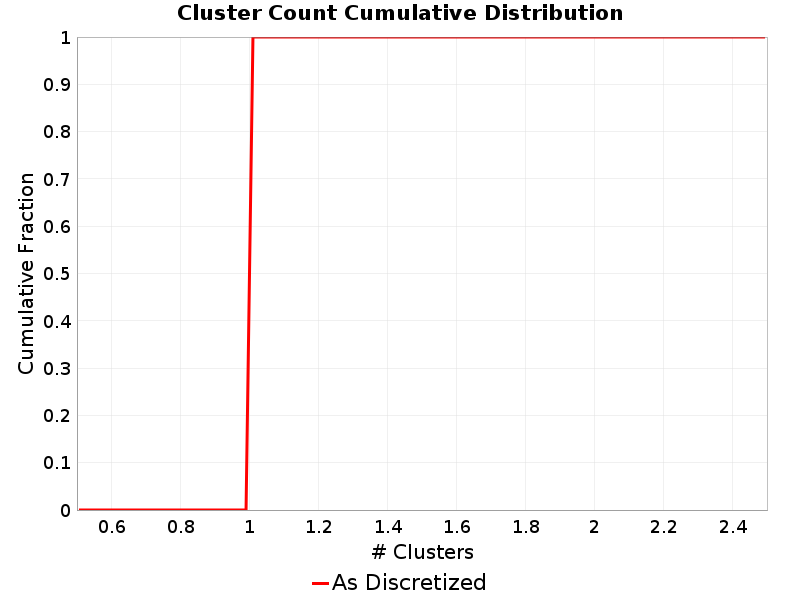
Cluster Count
(top)
Total number of clusters (of contiguous subsections on the same parent fault section) a rupture.
Cluster Count Extremes & Examples
(top)
Example ruptures at various percentiles of Cluster Count
| Minimum: 1 | p50: 1 | p90: 1 | p95: 1 |
|---|
 |  |  |  |
| p97.5: 1 | p99: 1 | p99.9: 1 | Maximum: 1 |
 |  |  | |
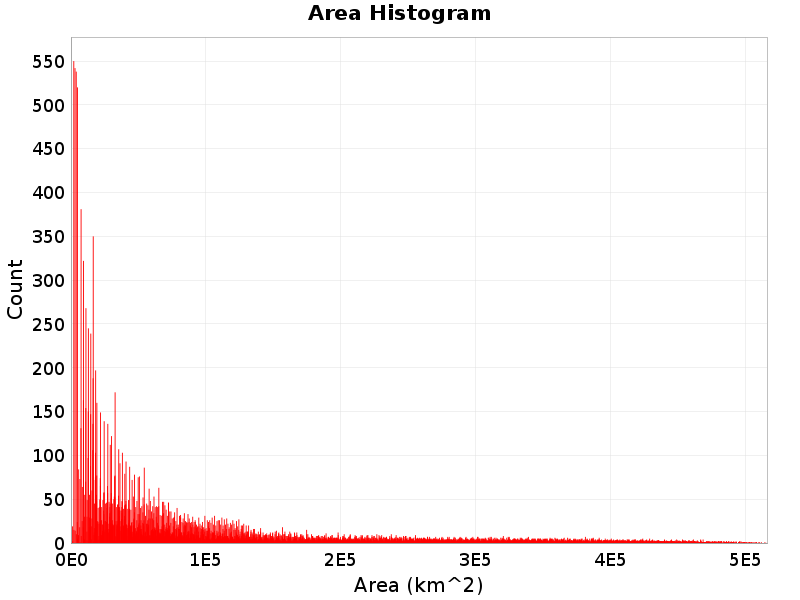
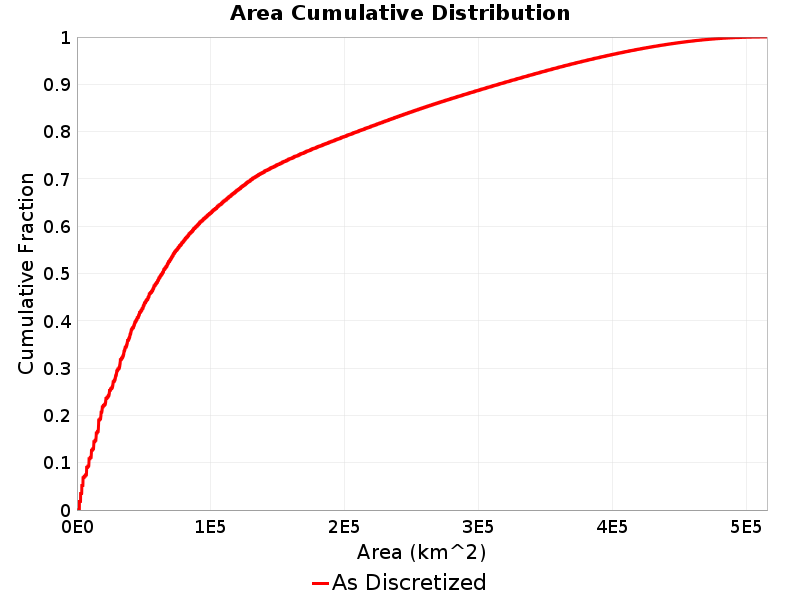
Area
(top)
Total area of the rupture (km^2).
Area Extremes & Examples
(top)
Example ruptures at various percentiles of Area
| Minimum: 880.87 | p50: 63720.62 | p90: 315071.21 | p95: 380177.03 |
|---|
| | | |
| p97.5: 421531.9 | p99: 455396.35 | p99.9: 494928.1 | Maximum: 515598.14 |
| | | |
Maximum Jump Dist
(top)
The maximum jump distance in the rupture.
Cumulative Jump Dist
(top)
The total cumulative jump distance summed over all jumps in the rupture.
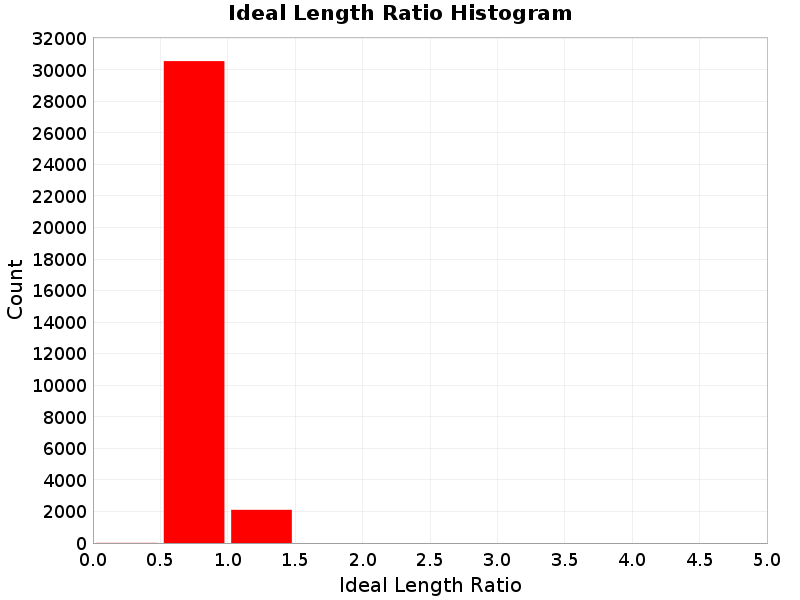
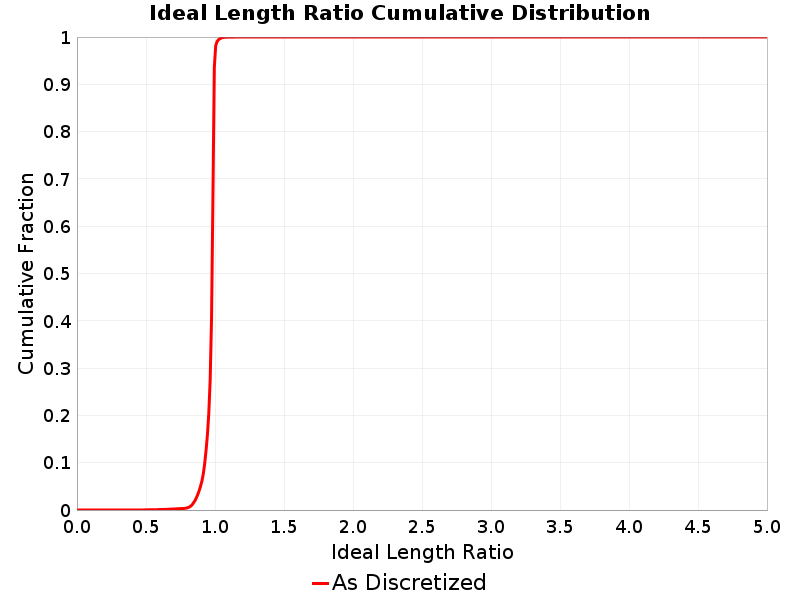
Ideal Length Ratio
(top)
The ratio between the total length of this rupture and the 'idealized length,' which we define as the straight line distance between the furthest two subsections.
Ideal Length Ratio Extremes & Examples
(top)
Example ruptures at various percentiles of Ideal Length Ratio
| Minimum: 0.39 | p50: 0.98 | p90: 1 | p95: 1 |
|---|
 |  |  |  |
| p97.5: 1.01 | p99: 1.02 | p99.9: 1.06 | Maximum: 1.44 |
 |  |  | |
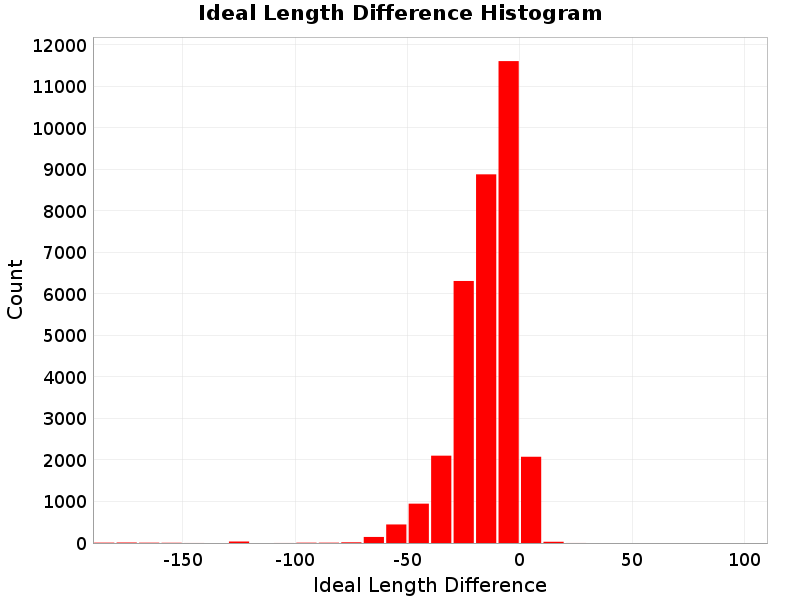
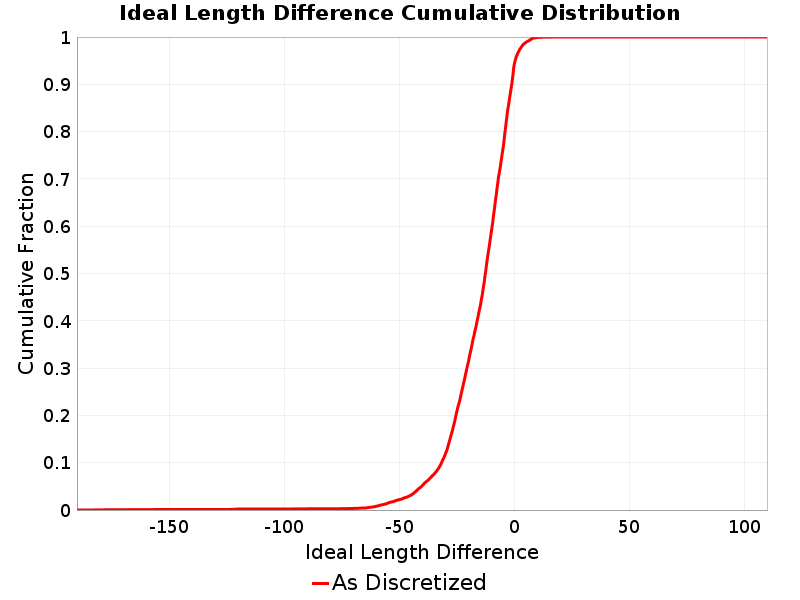
Ideal Length Difference
(top)
The difference between the total length of this rupture and the 'idealized length,' which we define as the straight line distance between the furthest two subsections.
Ideal Length Difference Extremes & Examples
(top)
Example ruptures at various percentiles of Ideal Length Difference
| Minimum: -183.21011 | p50: -12.336978 | p90: -0.8780747 | p95: 0.6 |
|---|
 |  |  |  |
| p97.5: 2.77 | p99: 5.64 | p99.9: 9.99 | Maximum: 20.06 |
 |  |  |  |
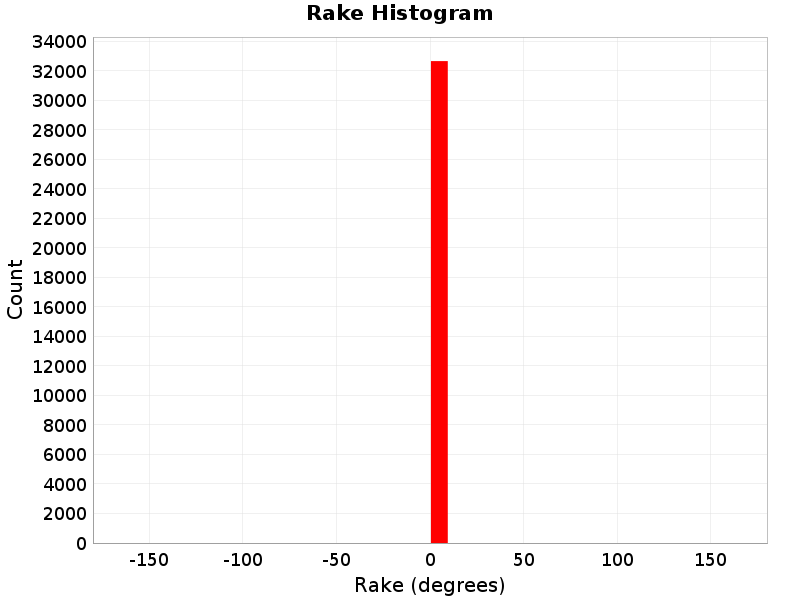
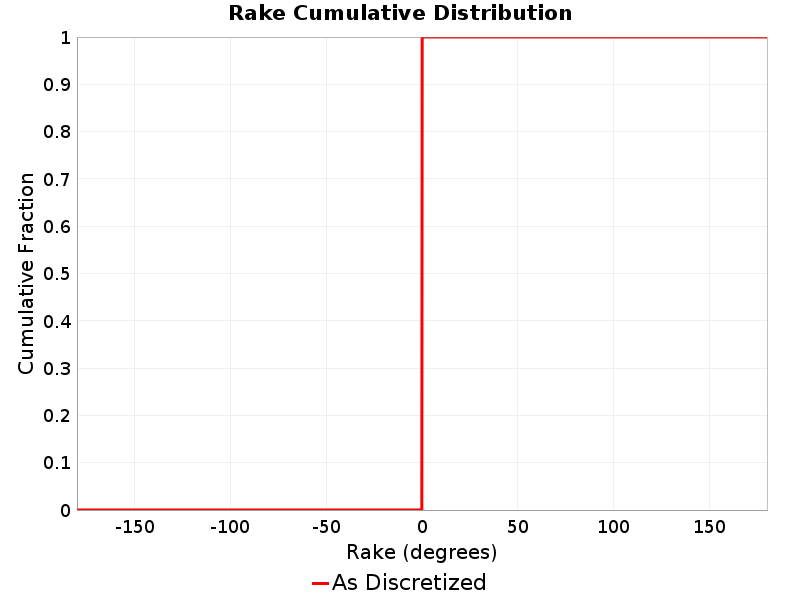
Rake
(top)
The area-averaged rake for this rupture.
Cumulative Rake Change
(top)
Cumulative rake change for this rupture.
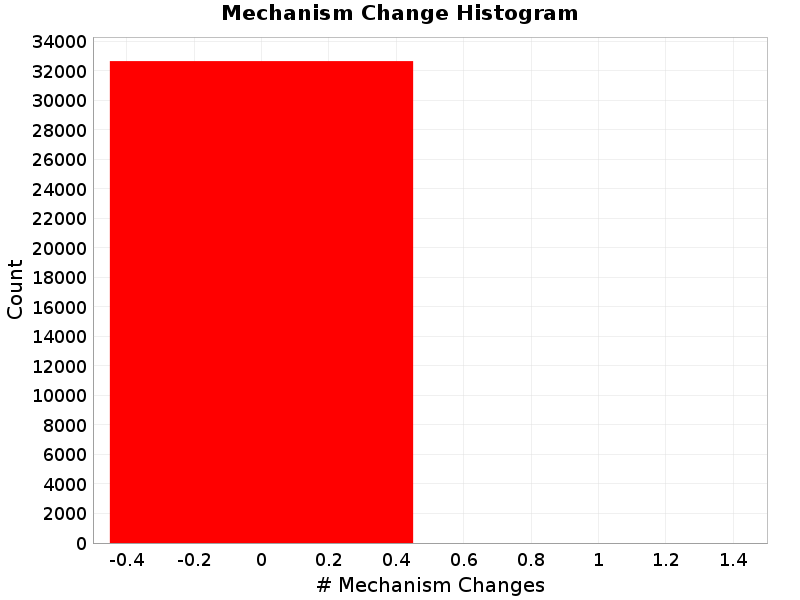
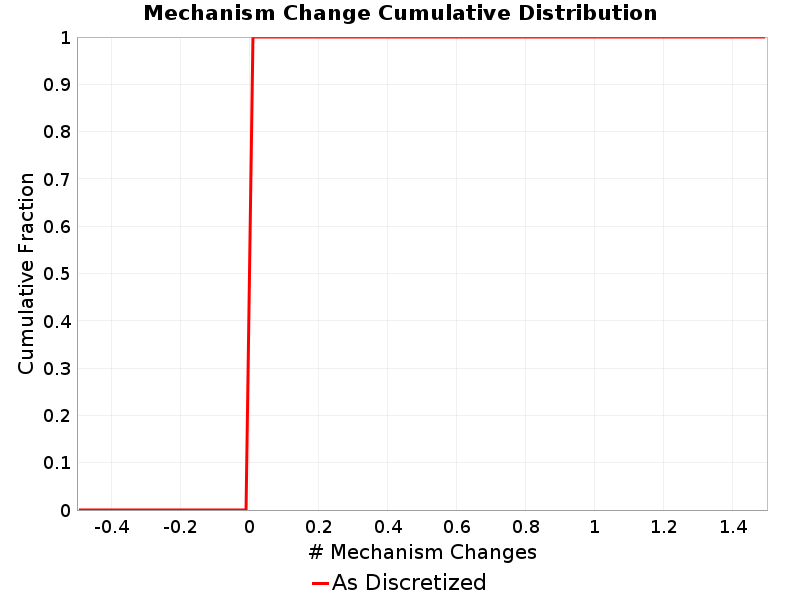
Mechanism Change
(top)
The number of times a rupture changed mechanisms, e.g., from right-lateral SS to left-lateral or SS to reverse.
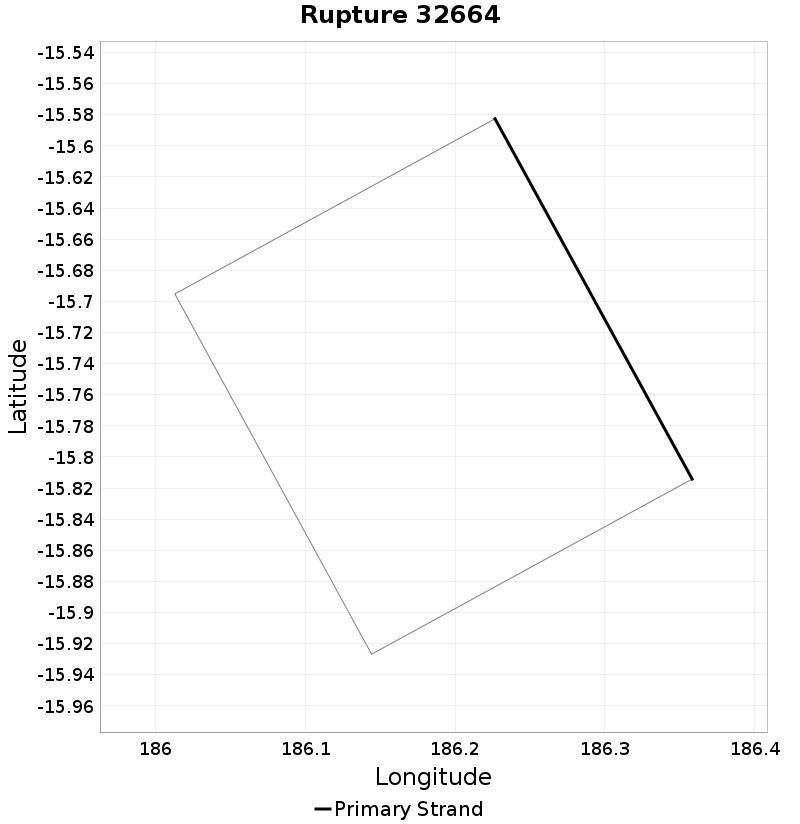
Mechanism Change Extremes & Examples
(top)
Example ruptures at various percentiles of Mechanism Change
| Minimum: 0.0 | p50: 0.0 | p90: 0.0 | p95: 0.0 |
|---|
| | | |
| p97.5: 0.0 | p99: 0.0 | p99.9: 0.0 | Maximum: 0.0 |
| | | |
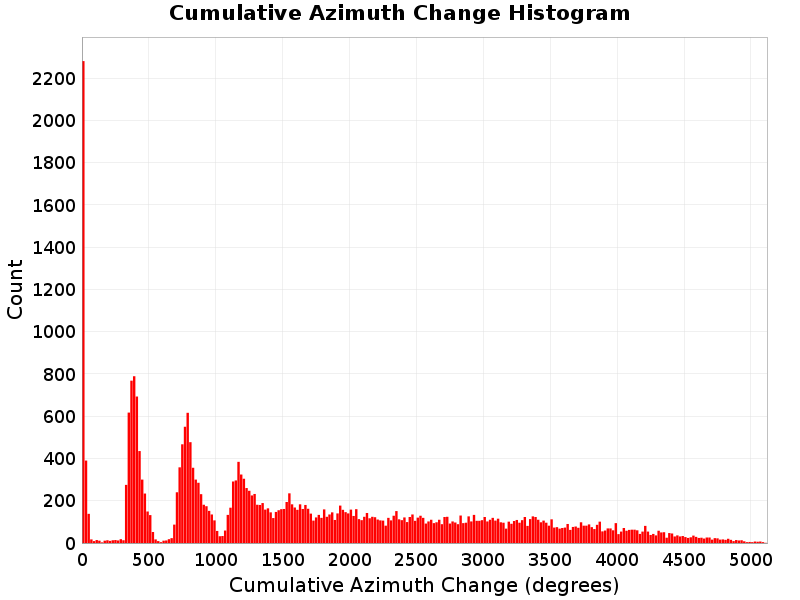
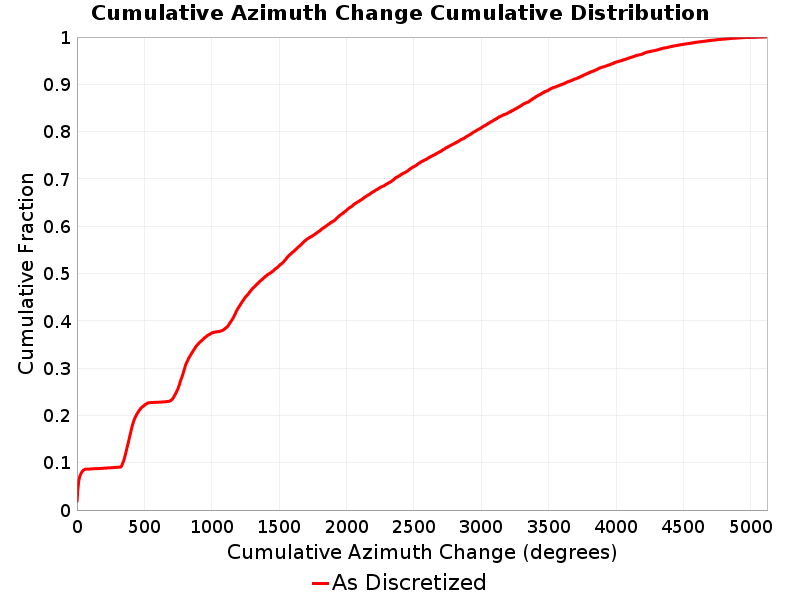
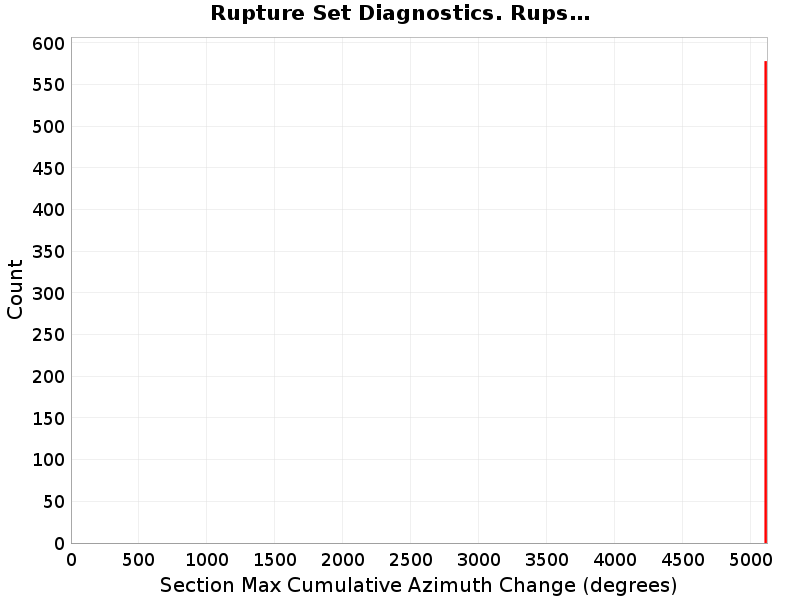
Cumulative Azimuth Change
(top)
Cumulative azimuth change for this rupture.
Cumulative Azimuth Change Extremes & Examples
(top)
Example ruptures at various percentiles of Cumulative Azimuth Change
| Minimum: 0.0 | p50: 1429.74 | p90: 3600.56 | p95: 4040.58 |
|---|
|  |  |  |
| p97.5: 4334.98 | p99: 4629.3 | p99.9: 4991.49 | Maximum: 5115.87 |
 |  |  | |
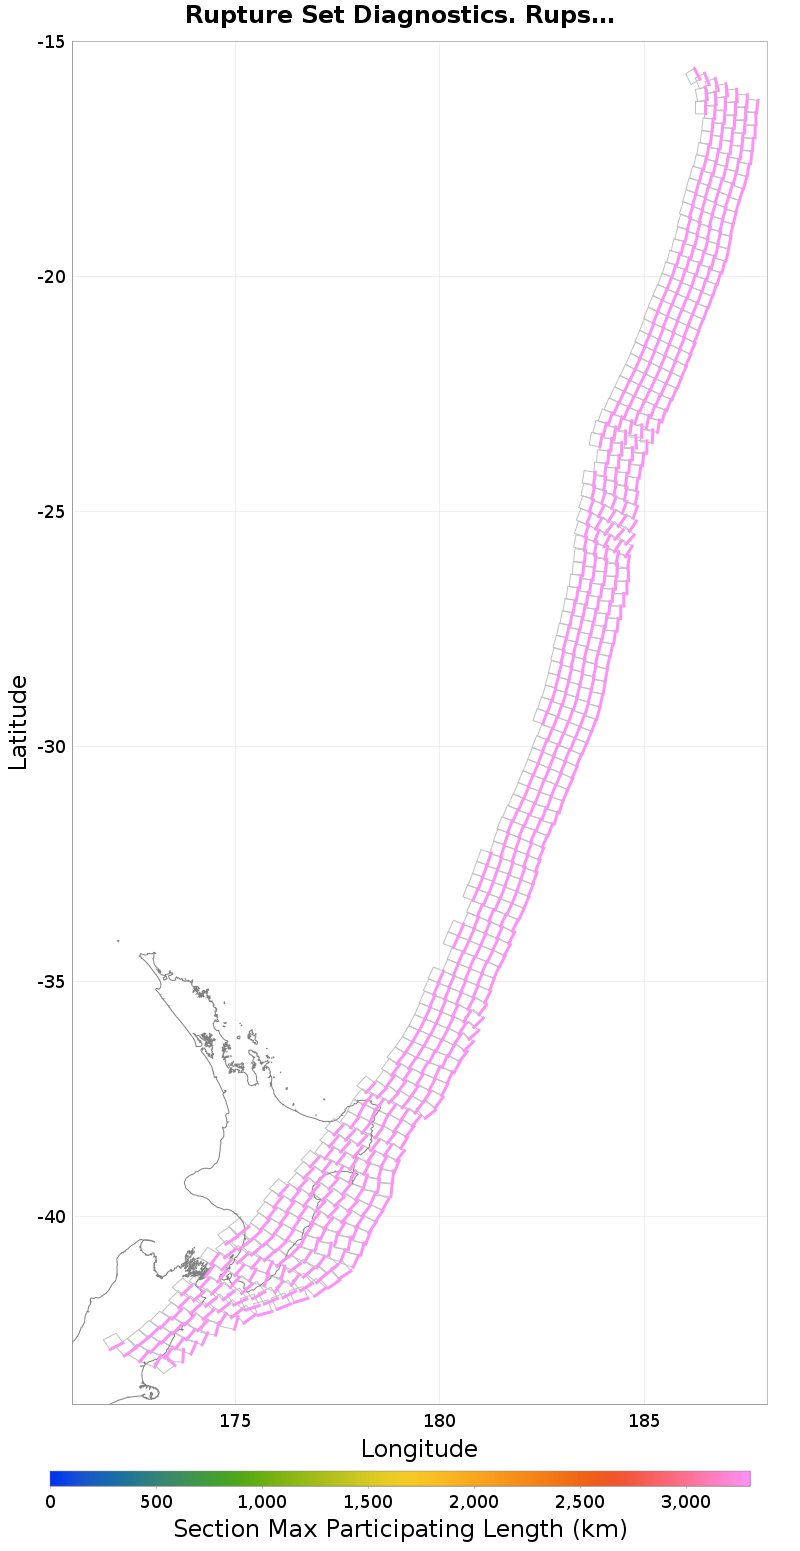
Subsection Maximum Values
(top)
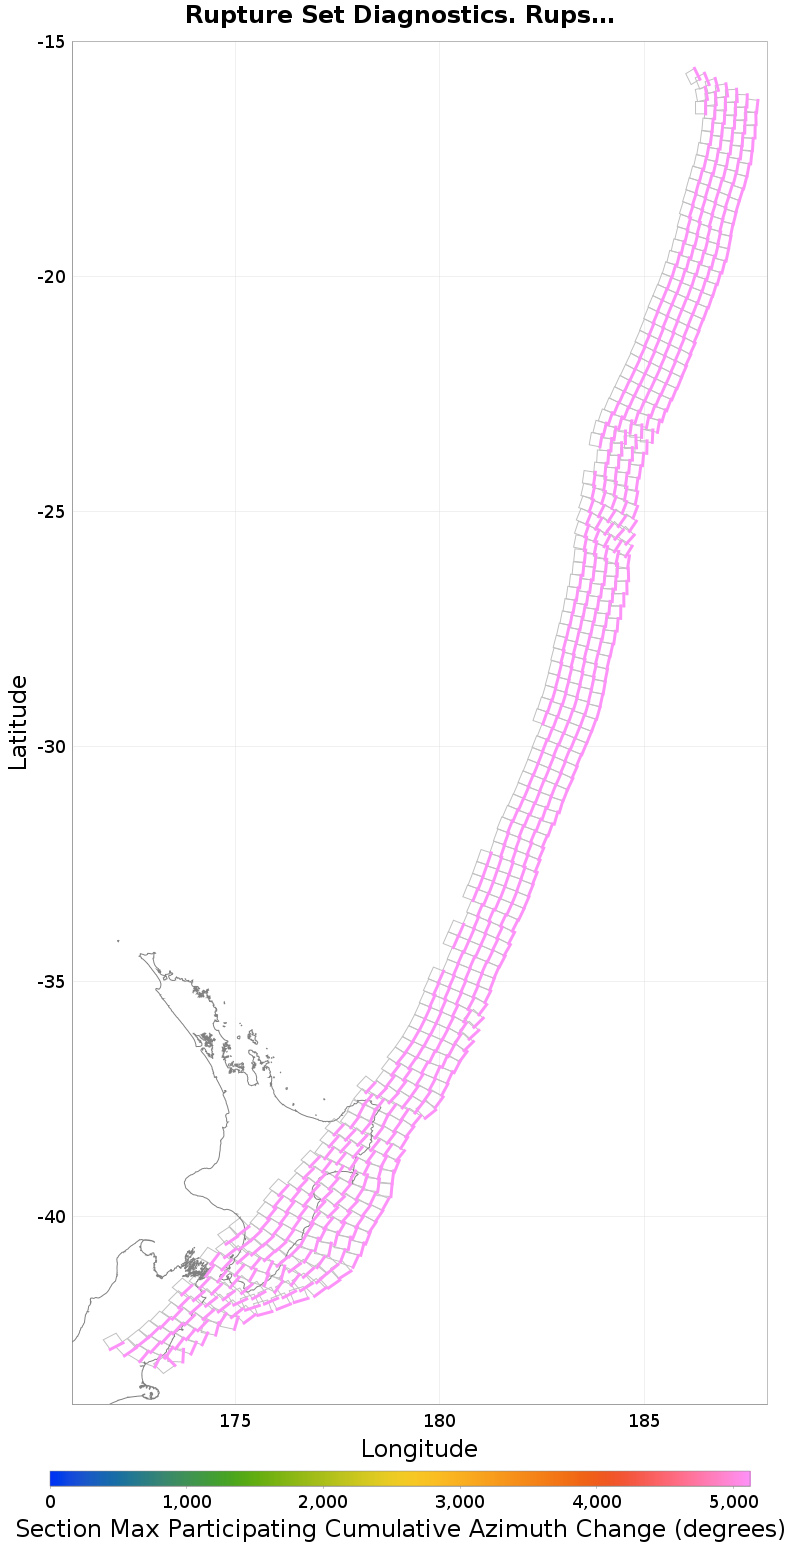
These plots show the maximum value of various quantities across all ruptures for which each individual subsection participates. This is useful, for example, to find sections with low maximum magnitudes (due to low or no connectivity).
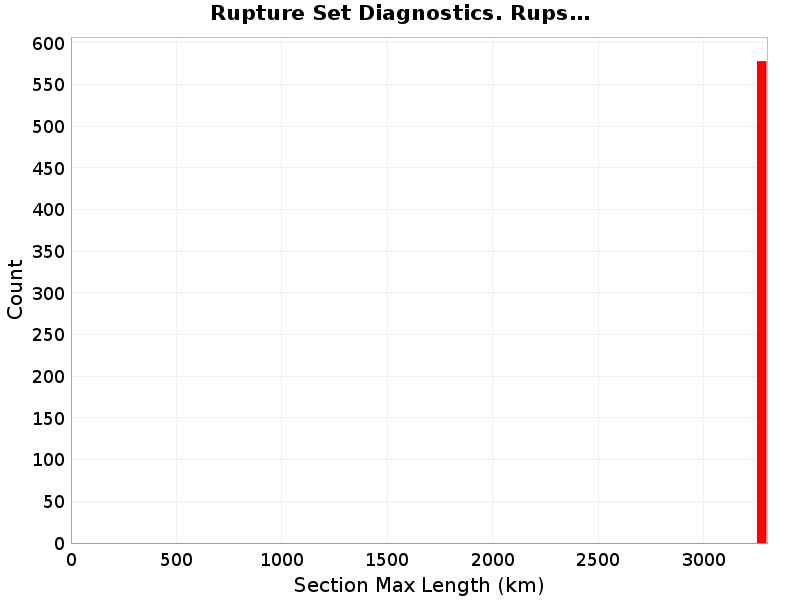
Subsection Maximum Rupture Length
(top)
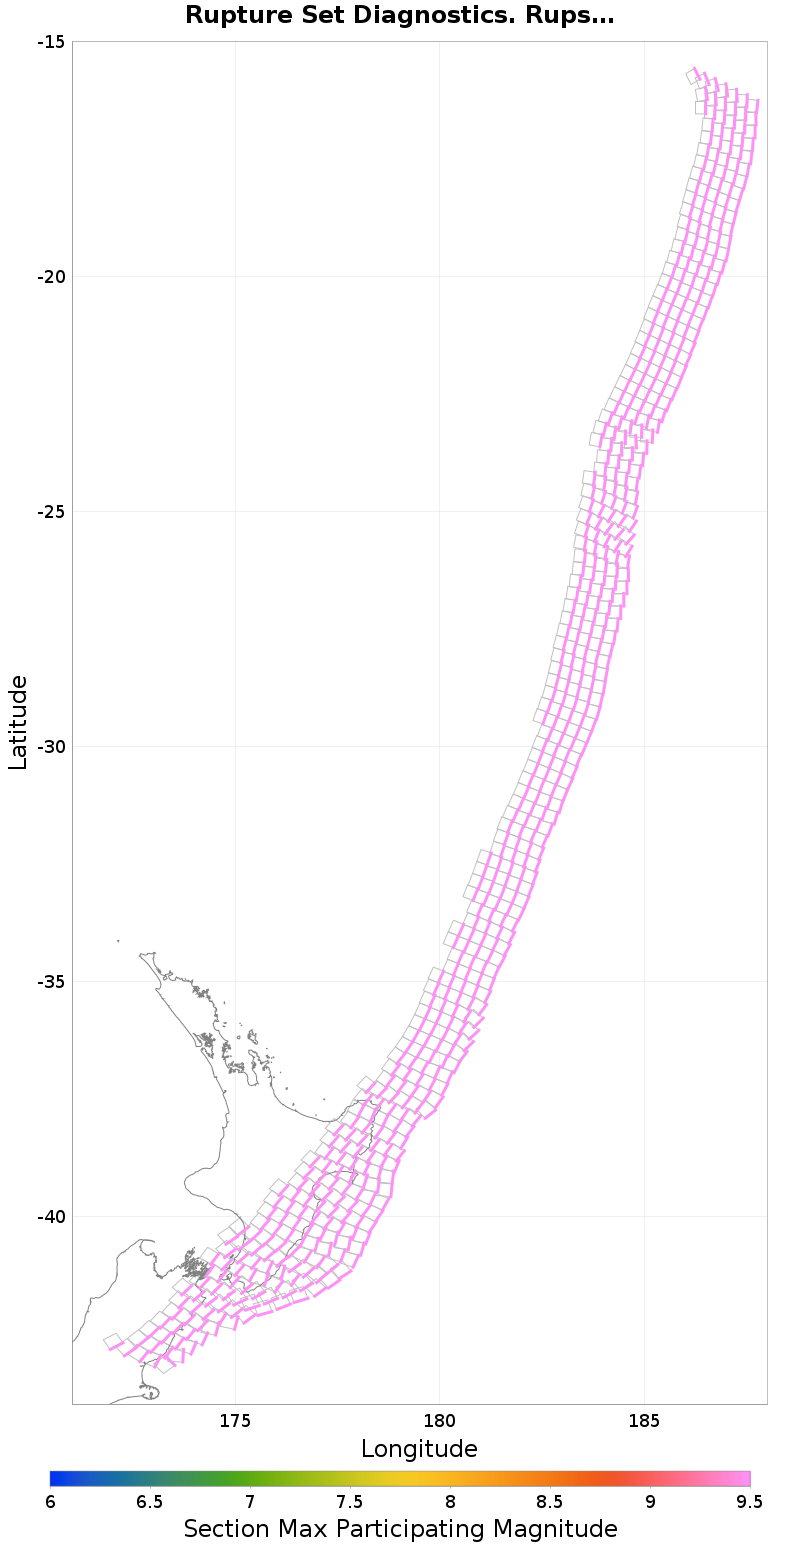
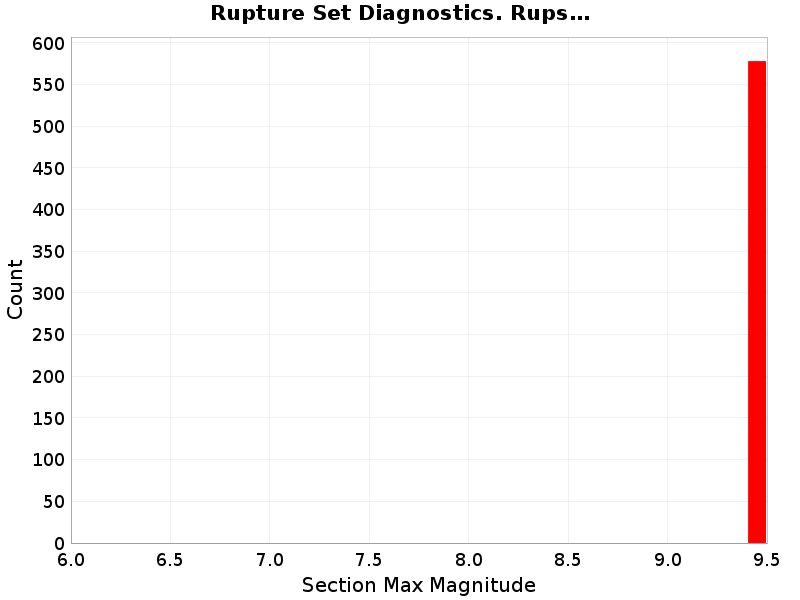
Subsection Maximum Rupture Magnitude
(top)
Subsection Maximum Cumulative Jump Dist
(top)
Subsection Maximum Cumulative Rake Change
(top)
Subsection Maximum Cumulative Azimuth Change
(top)
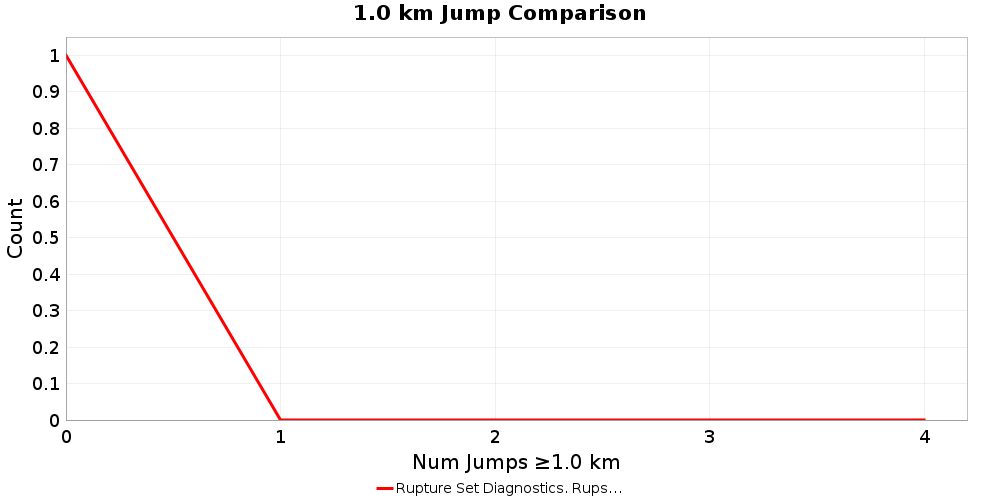
Jump Counts Over Distance
(top)
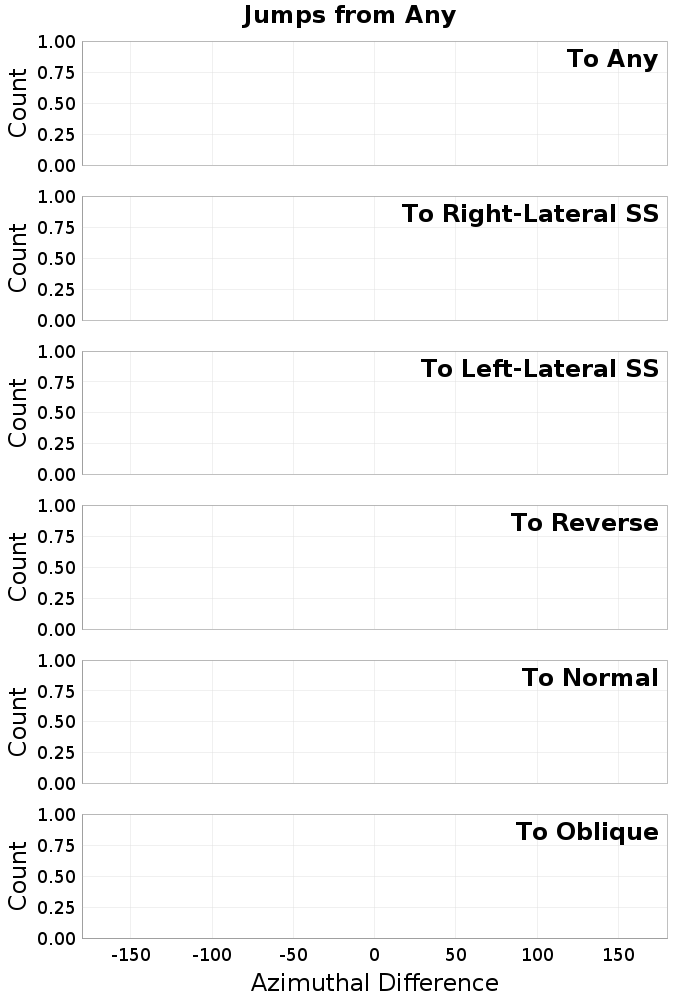
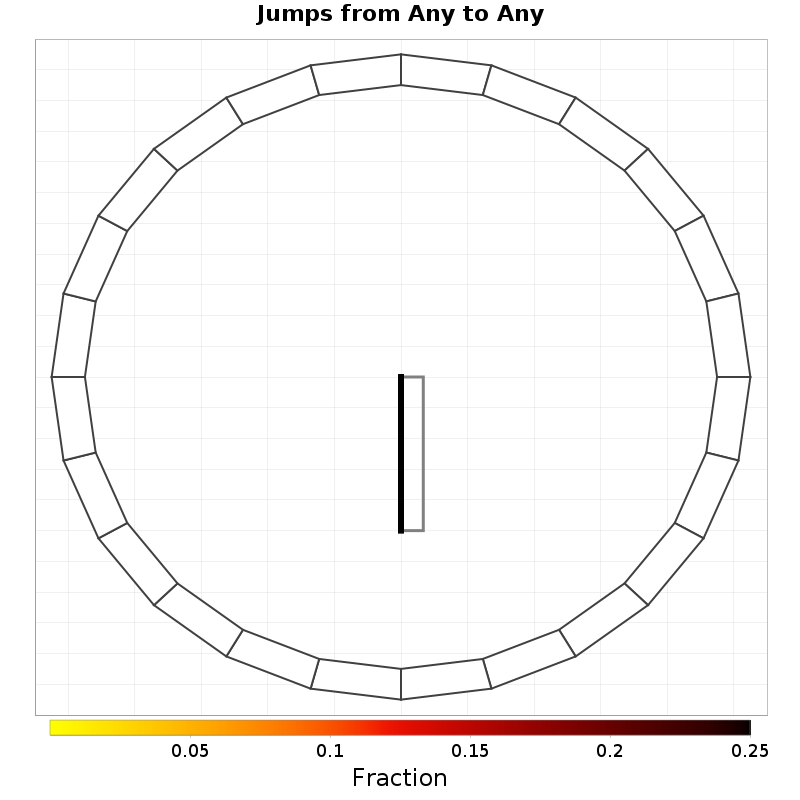
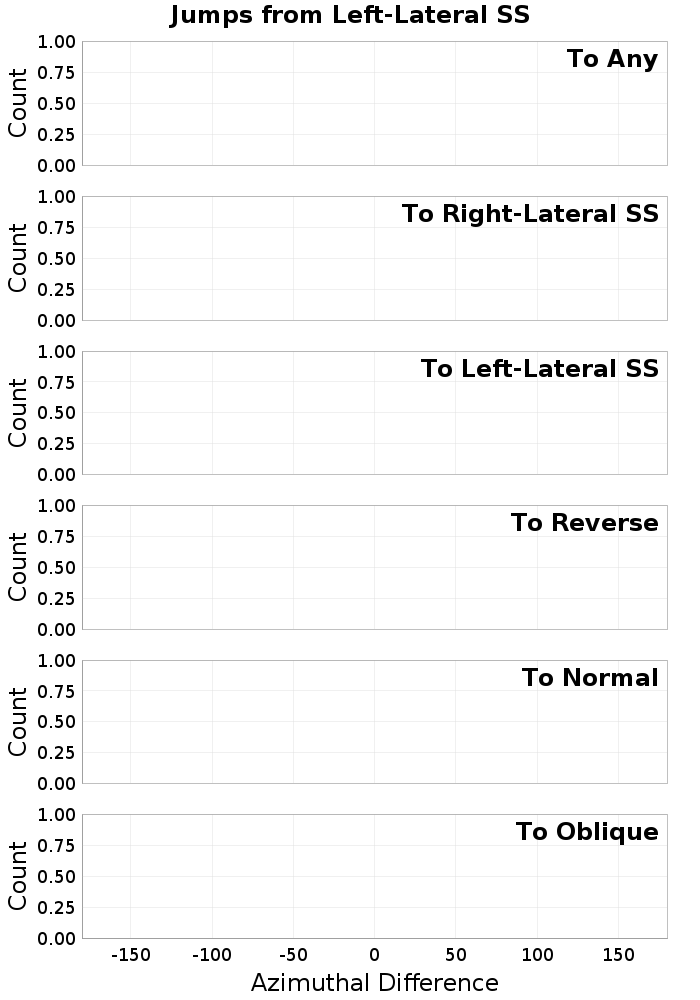
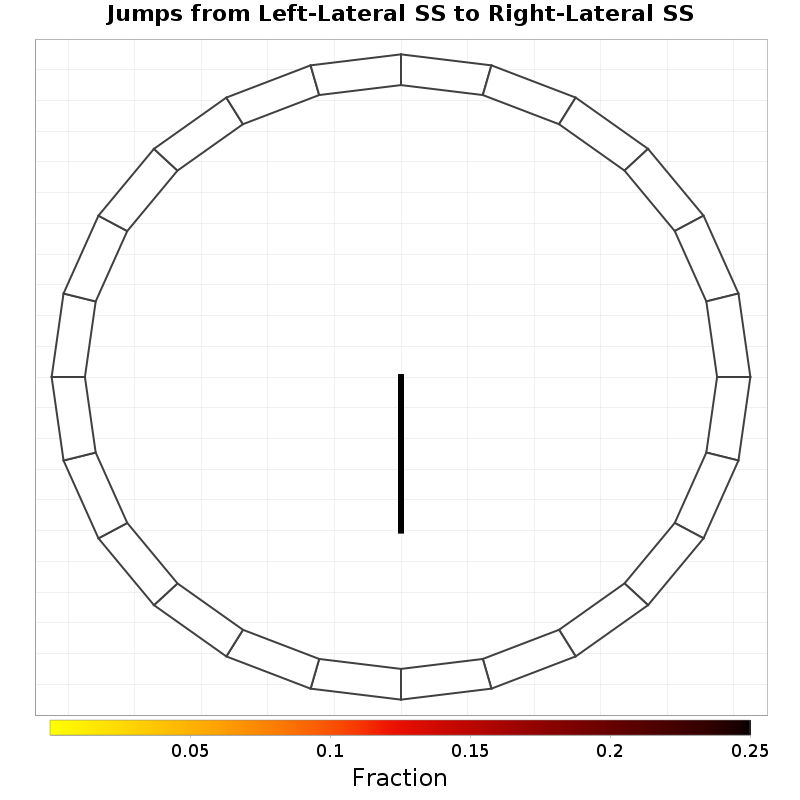
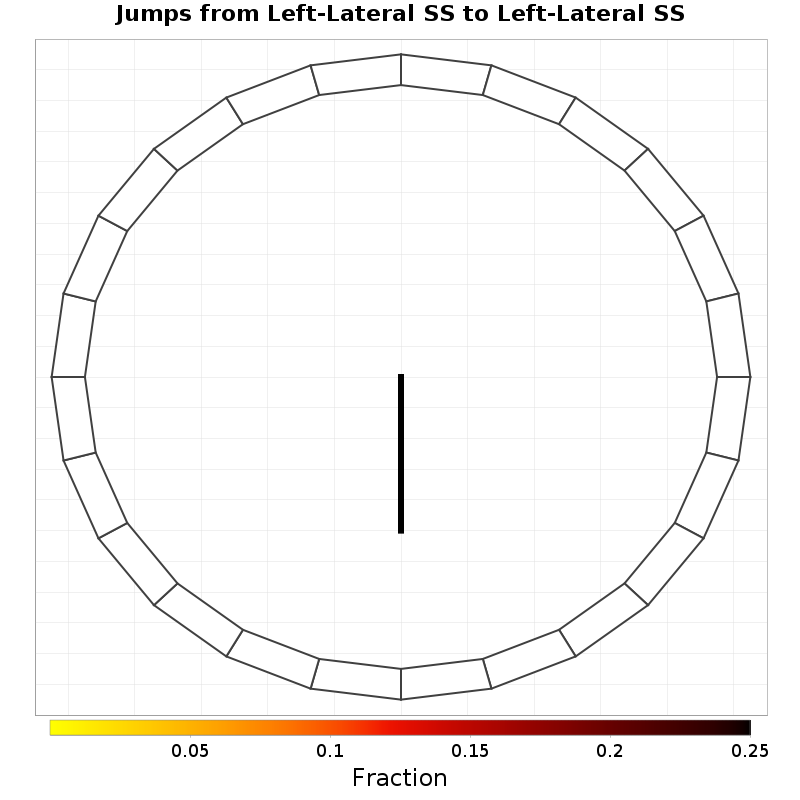
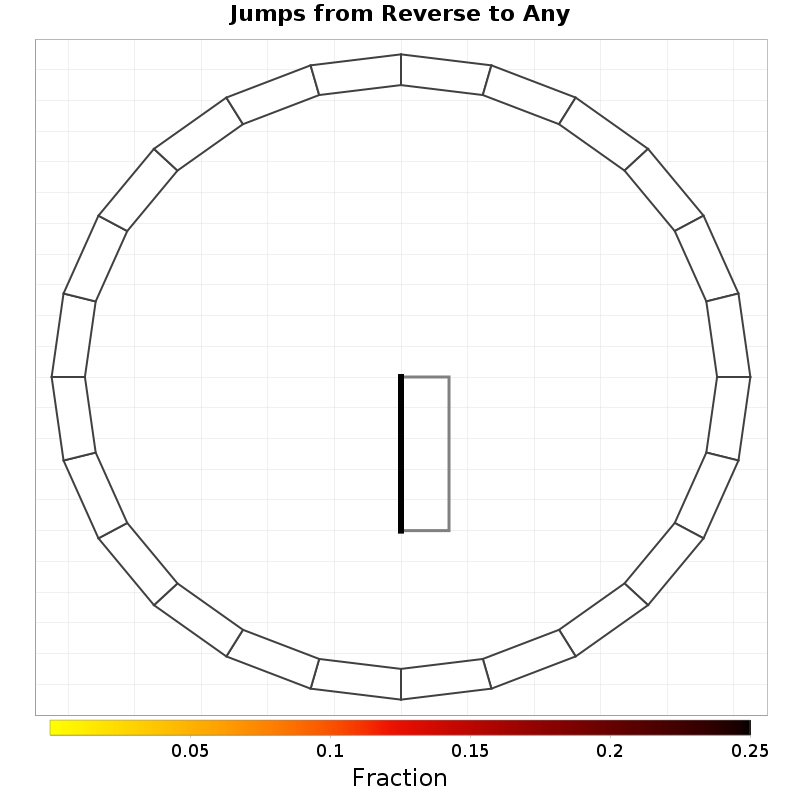
Jump Azimuths
(top)
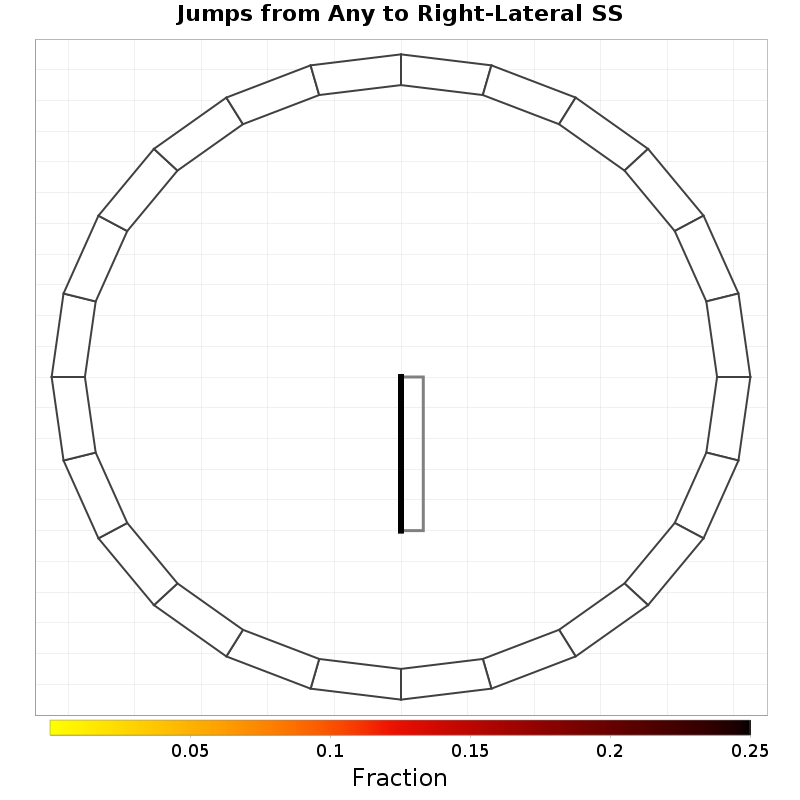
Jump Azimuths From Any
(top)
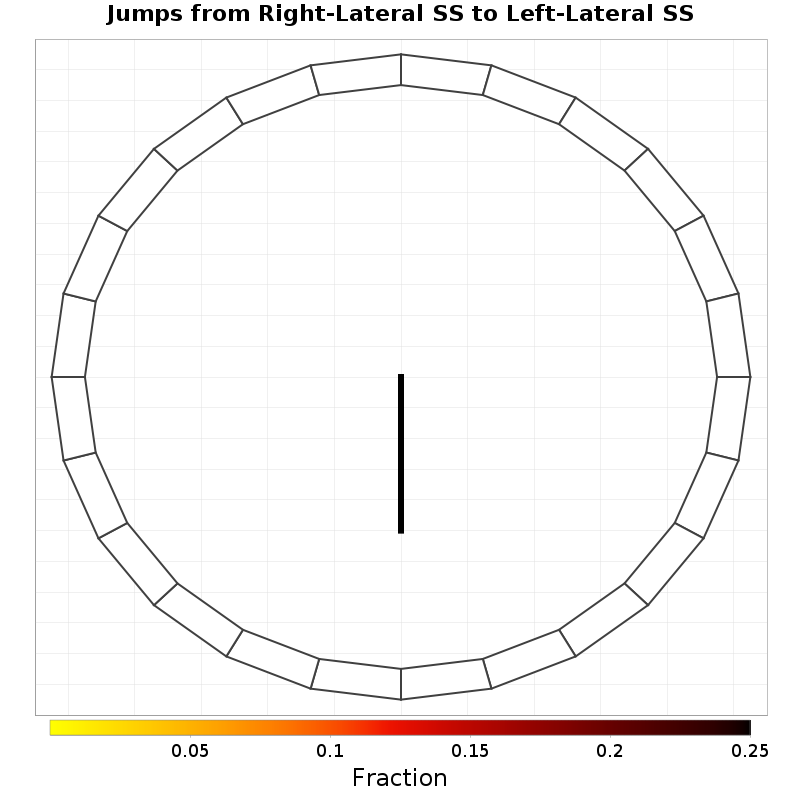
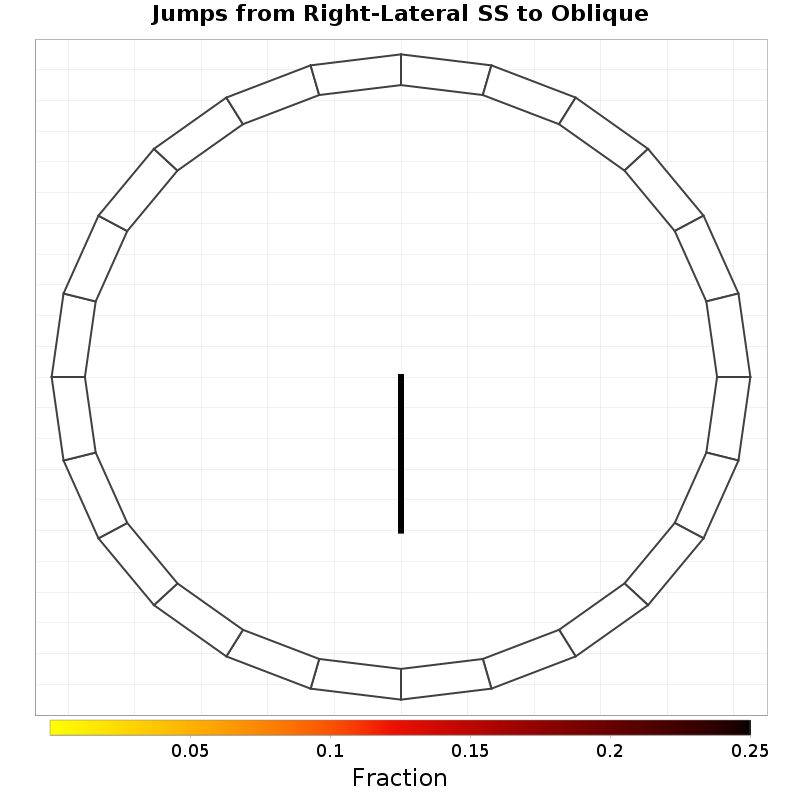
Jump Azimuths From Right-Lateral SS
(top)
Jump Azimuths From Left-Lateral SS
(top)
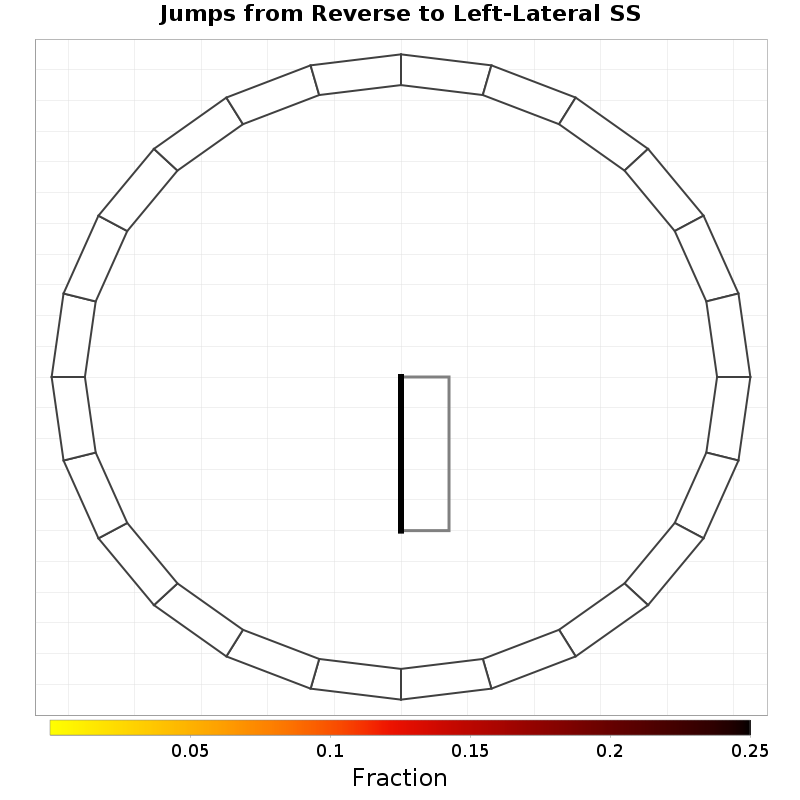
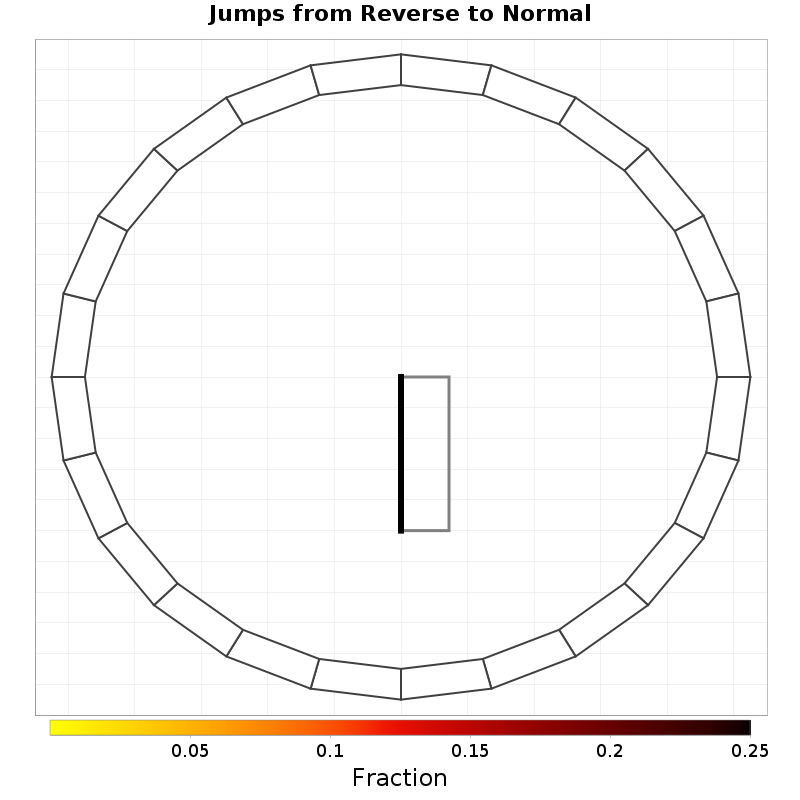
Jump Azimuths From Reverse
(top)
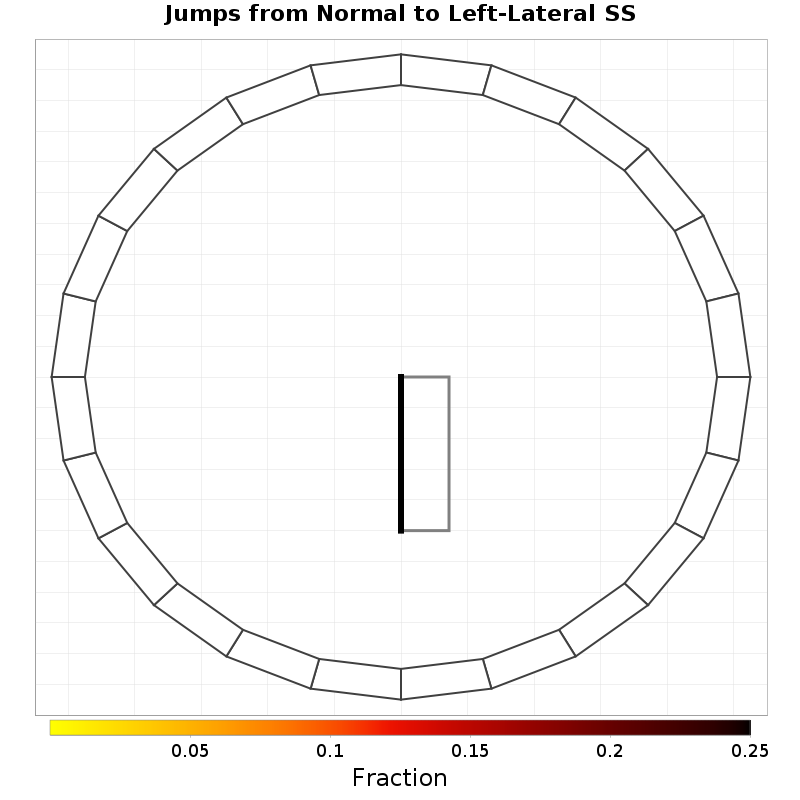
Jump Azimuths From Normal
(top)
Jump Azimuths From Oblique
(top)
Biasi & Wesnousky (2016,2017) Comparisons
(top)
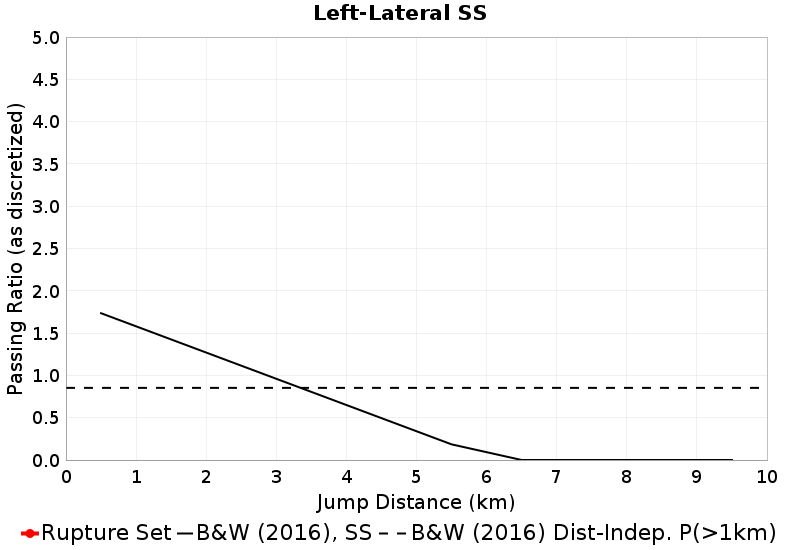
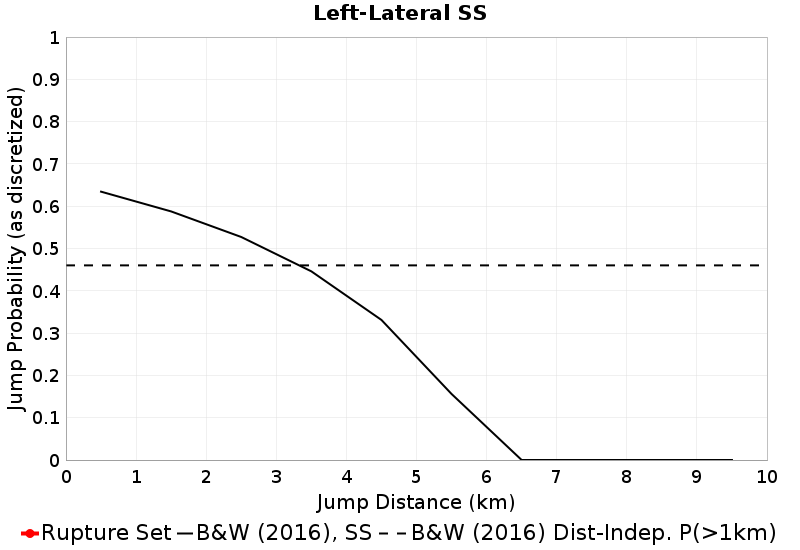
Jump Distance Comparisons
(top)
These plots express the chances of taking an available jump of a given distance between two faults of the same type (SS, Normal, Reverse). Passing ratios give the ratio of times a jump was taken to the number of times a rupture ended without taking an available jump of that distance. NOTE: Only as-discretized rates are included, as we don't have a fault system solution.
| Right-Lateral SS Passing Ratio | Right-Lateral SS Probability |
|---|
 | 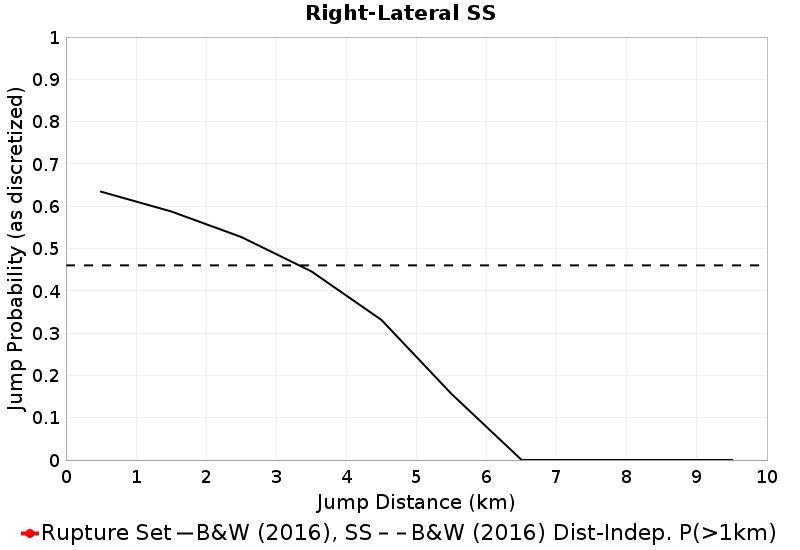 |
| Left-Lateral SS Passing Ratio | Left-Lateral SS Probability |
 |  |
| Reverse Passing Ratio | Reverse Probability |
 |  |
| Normal Passing Ratio | Normal Probability |
 |  |
| Oblique Passing Ratio | Oblique Probability |
 | 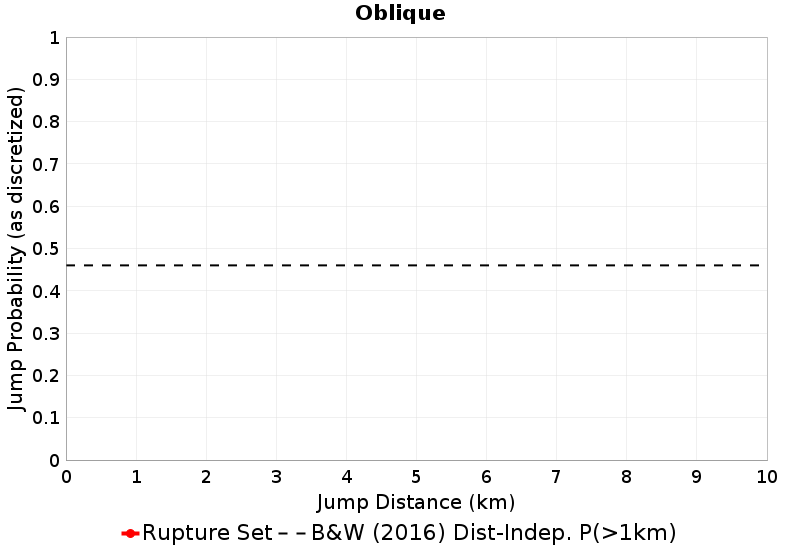 |
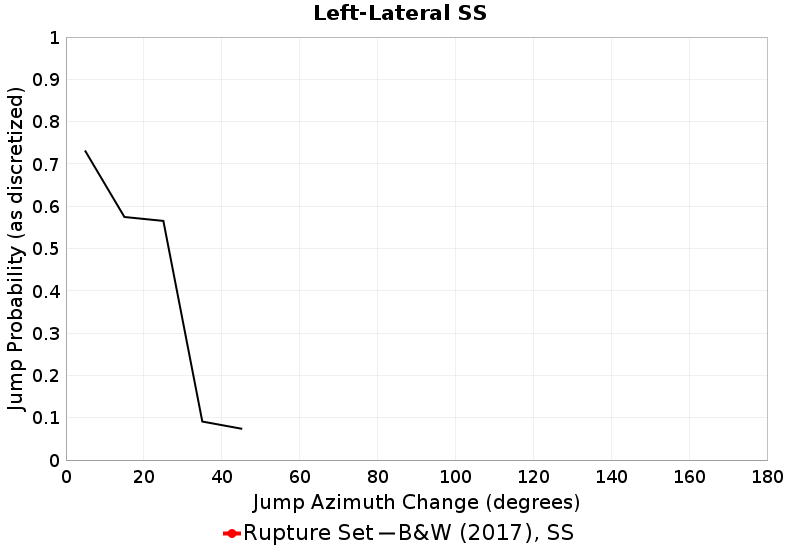
Jump Azimuth Change Comparisons
(top)
These plots express the chances of taking an available jump of a given azimuth change between two faults of the same type (SS, Normal, Reverse). Passing ratios give the ratio of times a jump was taken to the number of times a rupture ended without taking an available jump of that azimuth change. NOTE: Only as-discretized rates are included, as we don't have a fault system solution.
| Right-Lateral SS Passing Ratio | Right-Lateral SS Probability |
|---|
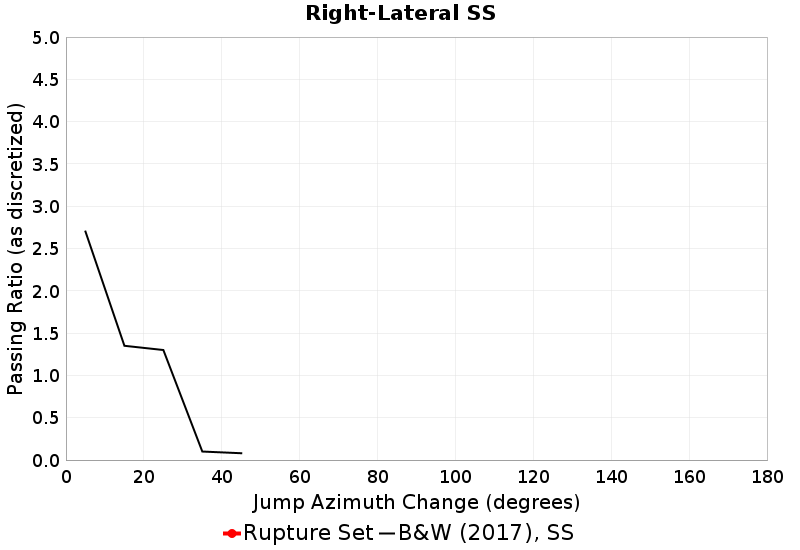 | 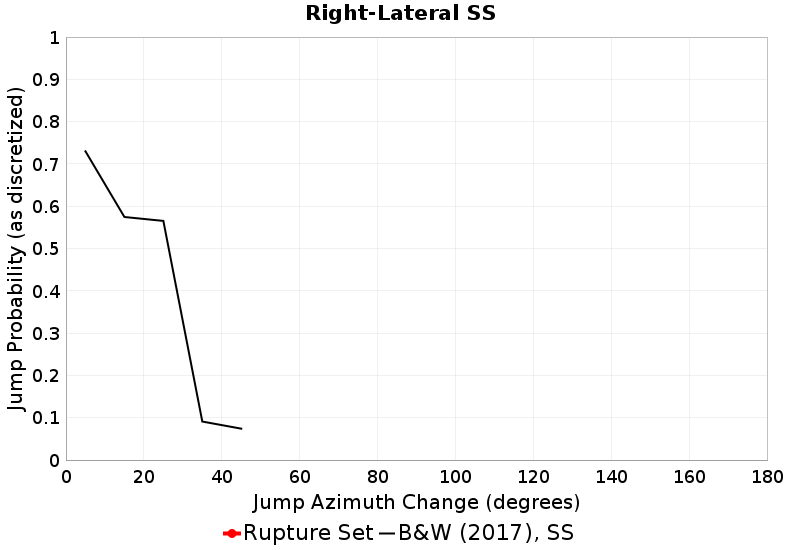 |
| Left-Lateral SS Passing Ratio | Left-Lateral SS Probability |
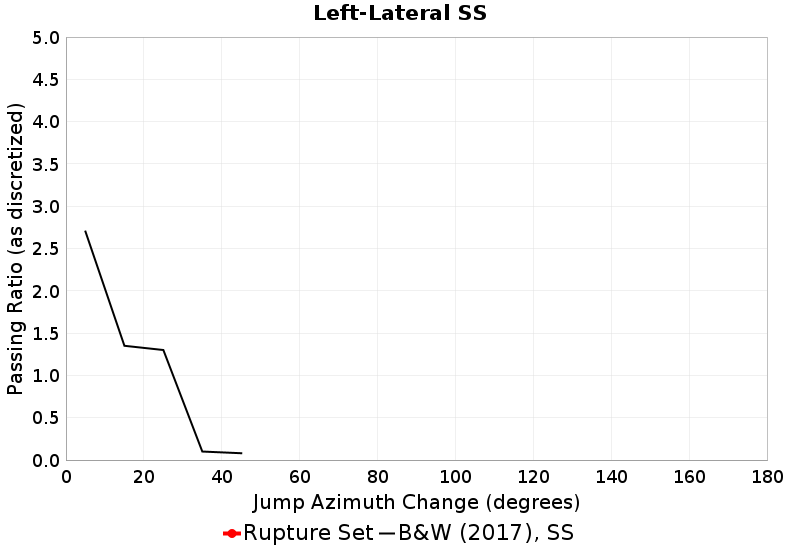 |  |
| Reverse Passing Ratio | Reverse Probability |
 |  |
| Normal Passing Ratio | Normal Probability |
 |  |
| Oblique Passing Ratio | Oblique Probability |
 |  |
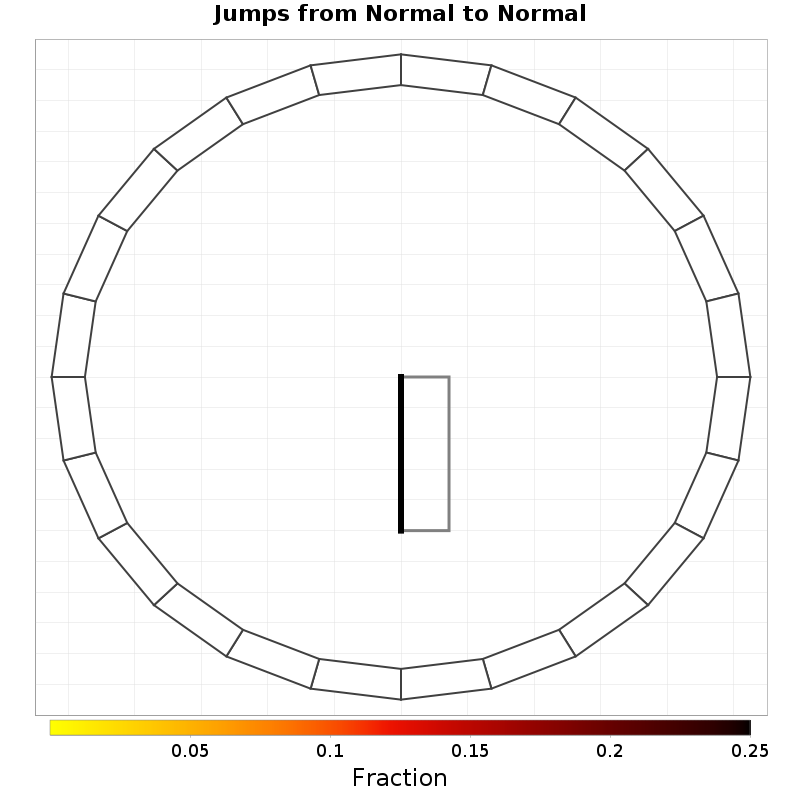
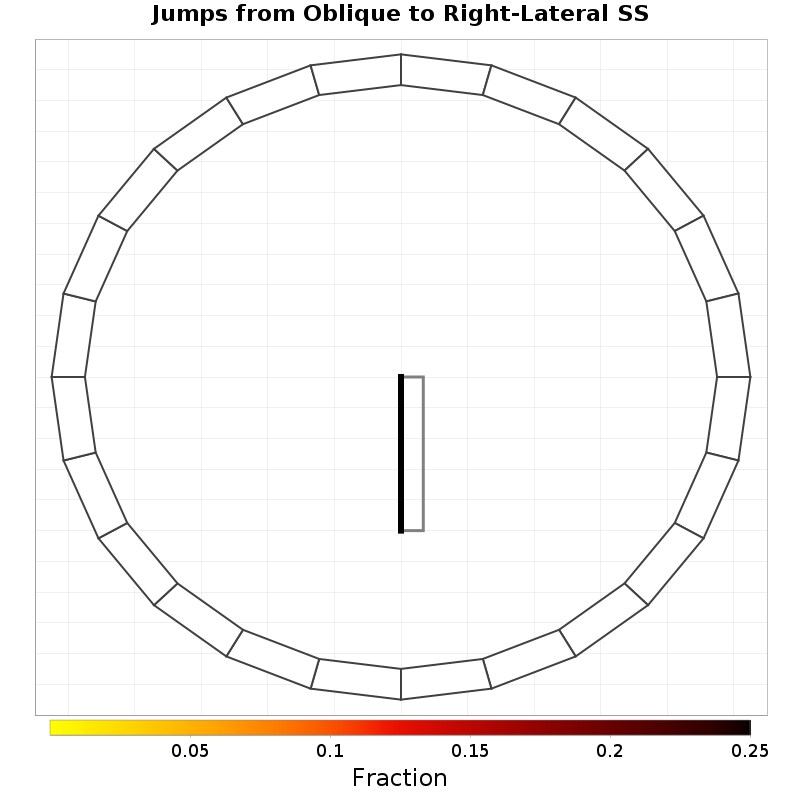
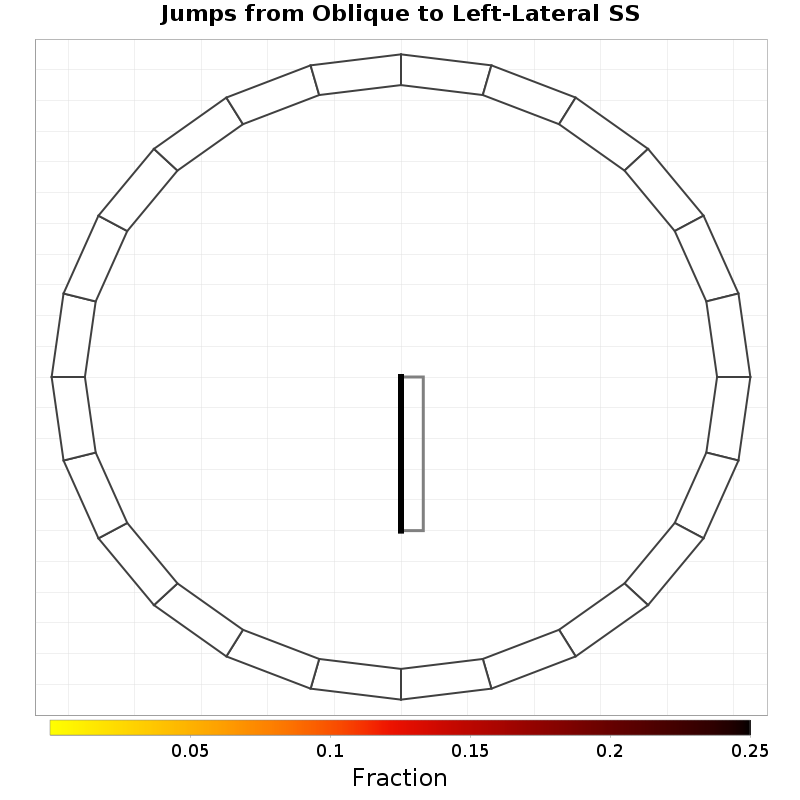
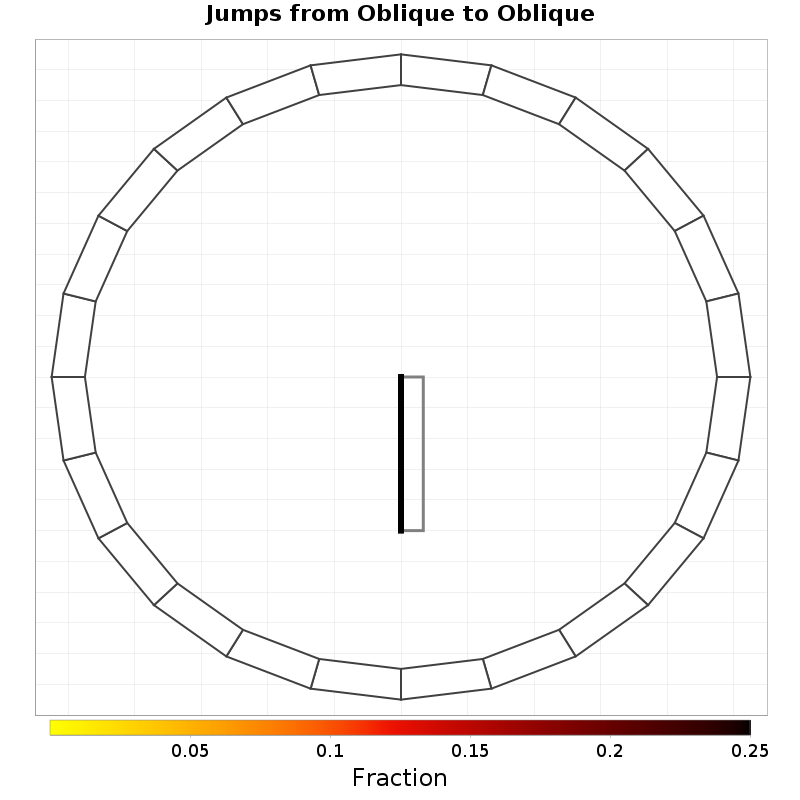
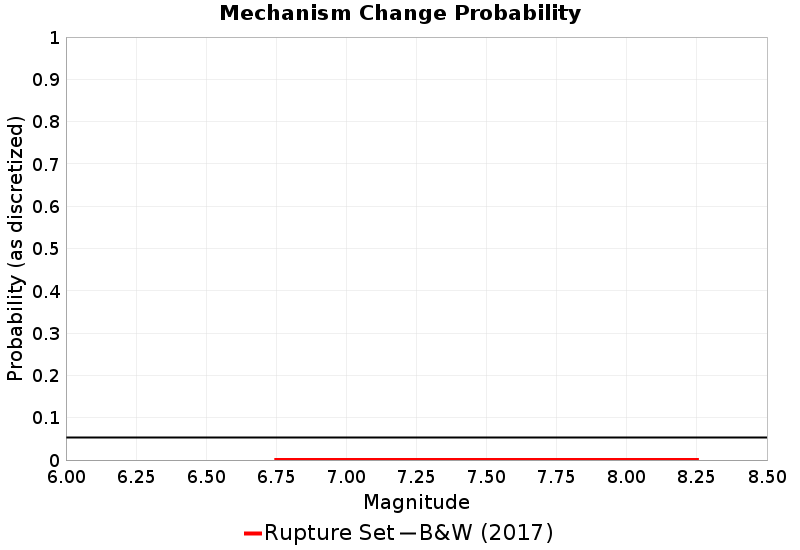
Mechanism Change Comparisons
(top)
These plots express the probability of a rupture changing mechanism (e.g., strike-slip to reverse, or right-lateral to left-lateral) at least once, as a function of magnitude. NOTE: Only as-discretized rates are included, as we don't have a fault system solution.