Rupture Set Report: Combined
| Num Sections | 305 |
|---|
| Num Ruptures | 37,721 |
| Num Single-Stranded Ruptures | 18,369 (48.70%) |
| Target Total Moment Rate | 1.8417089e19 N-m/yr |
| Deformation Model Creep-Reduced Total Moment Rate | 1.8417089e19 N-m/yr |
| Deformation Model Original Total Moment Rate | 1.8417089e19 N-m/yr |
| Magnitude Range | [6.63,9.00] |
| Length Range | [10.02,4166.48] km |
| Rupture Section Count Range | [2,281] |
Table Of Contents
(top)
Rupture Set File Path: C:\Users\user\GNS\nzshm-opensha\TEST\ruptures\combined-fixed-puy.zip
| Description | Value |
|---|
| Rupture Set Creation Time | 2024-03-19 14:38:15 NZDT |
| Report Creation Time | 2024-03-19 14:42:08 NZDT |
Logic Tree Branch
(top)
| Level | Choice |
|---|
| Fault Model | Puysegur, 30km, 50% coupling |
| Fault Regime | Fault Regime |
| NZSHM22_SpatialSeisPDF | (N/A) |
| Slip Along Rupture Model (Dsr) | Uniform |
| Inversion Model | (N/A) |
| NZSHM22_ScalingRelationship | NZSHM22_ScalingRelationship |
| NZSHM22_FaultPolyParameters | (N/A) |
| NZSHM22_MagBounds | (N/A) |
| NZSHM22_SlipRateFactors | (N/A) |
| NZSHM22_Regions | (N/A) |
| NZSHM22_DeformationModel | (N/A) |
Rupture Scaling
(top)
Magnitude Scaling
(top)
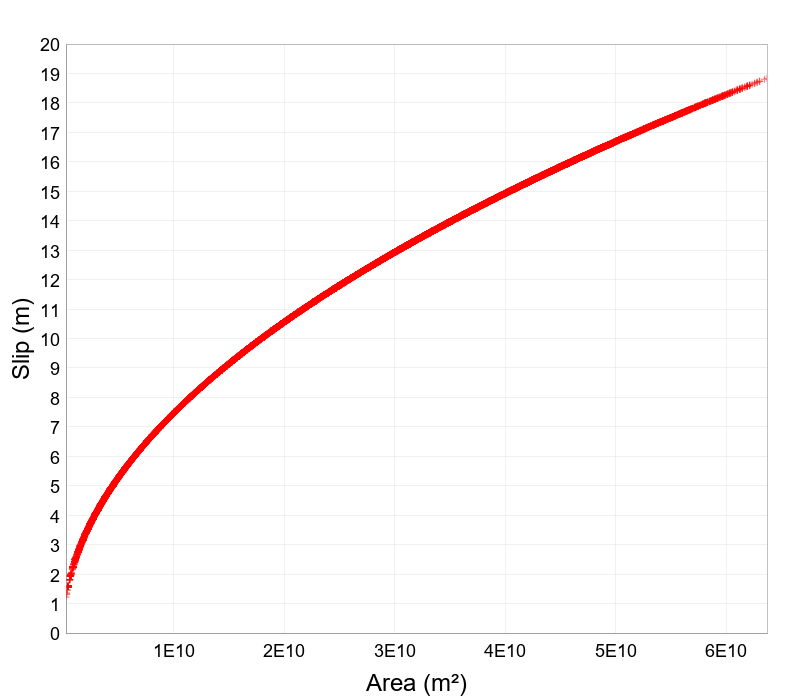
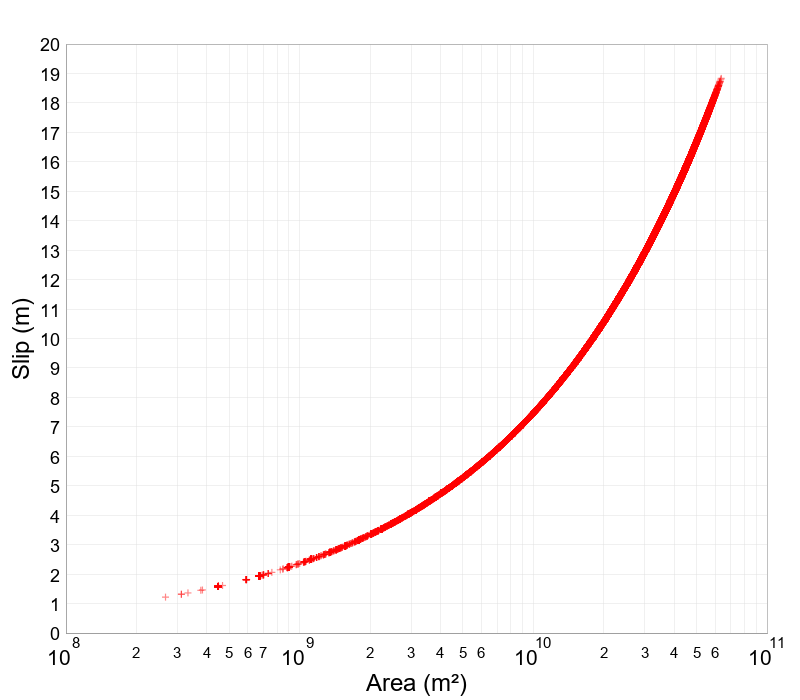
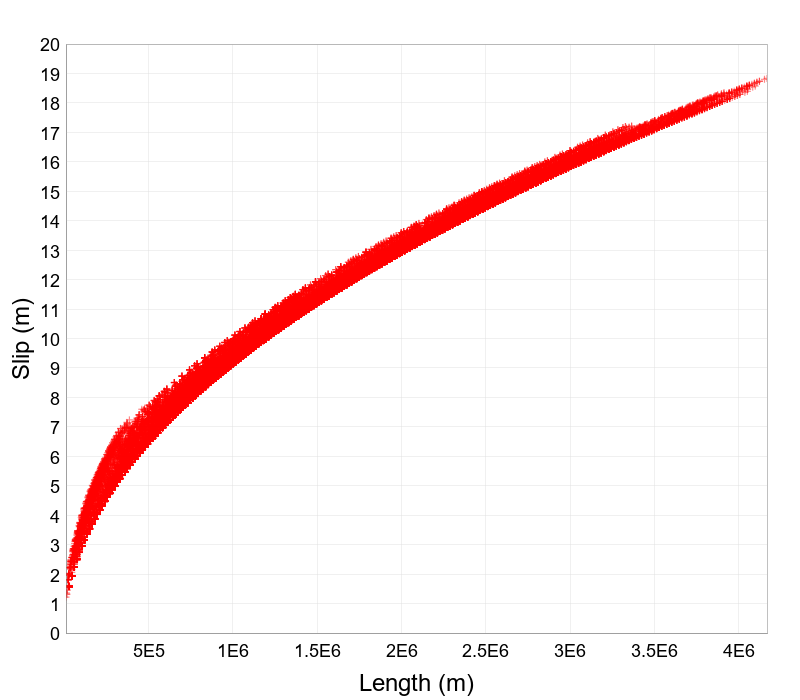
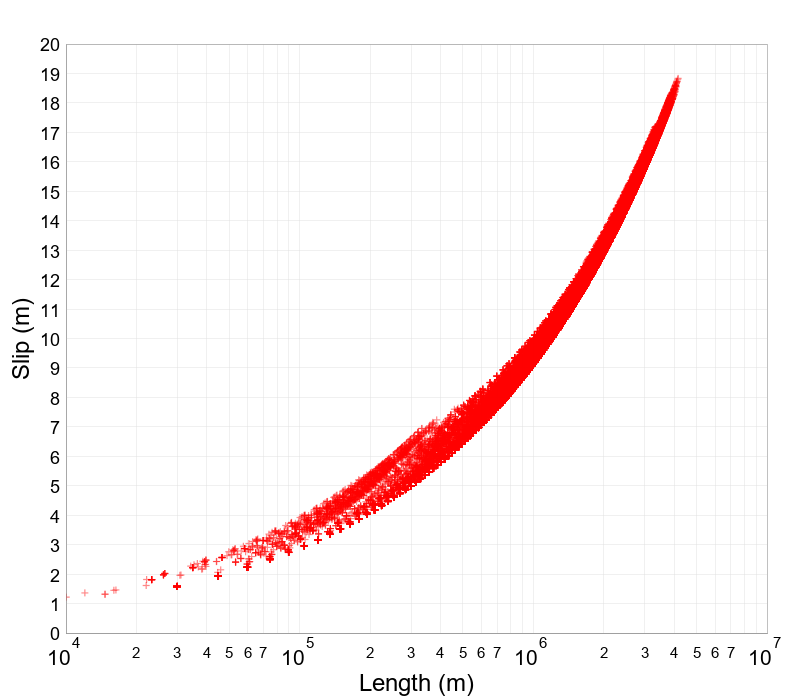
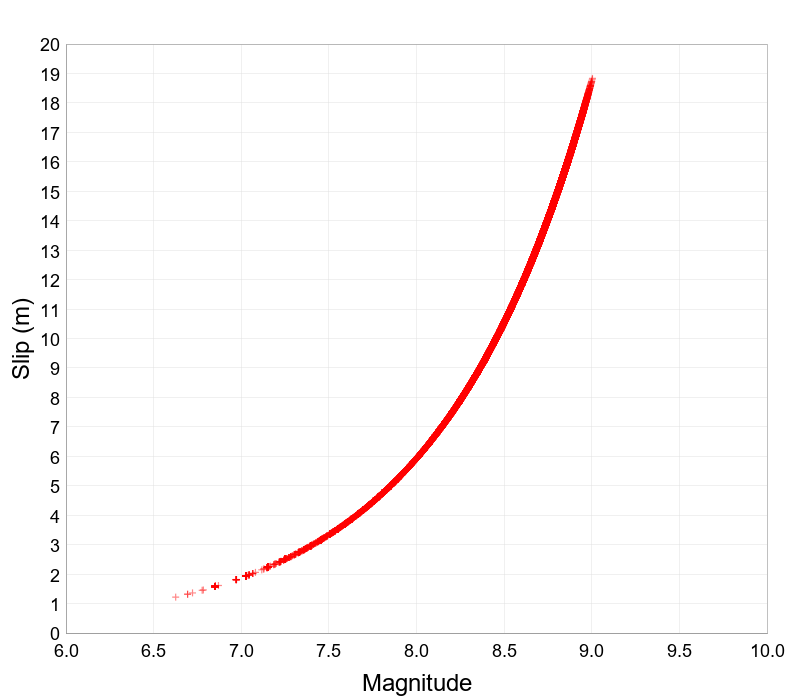
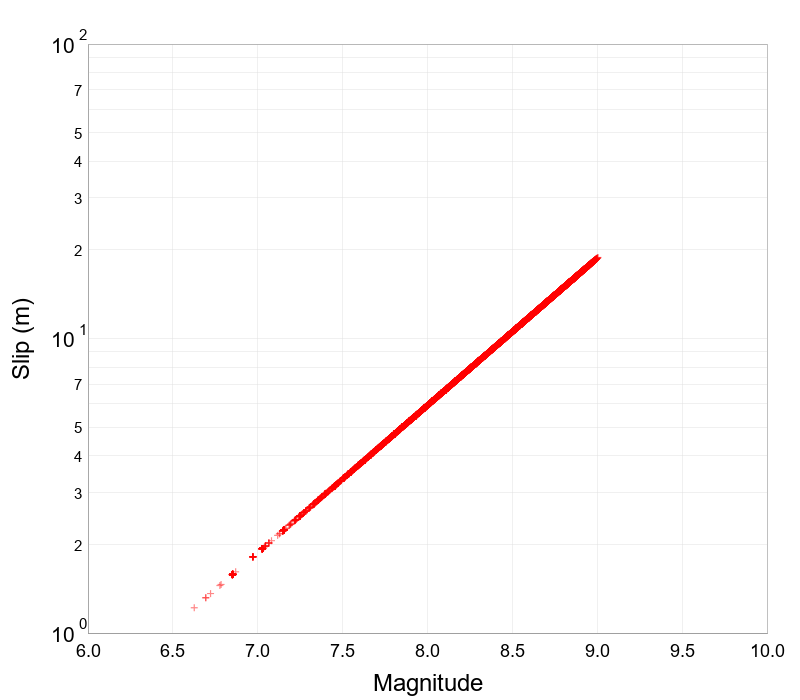
Slip Scaling
(top)
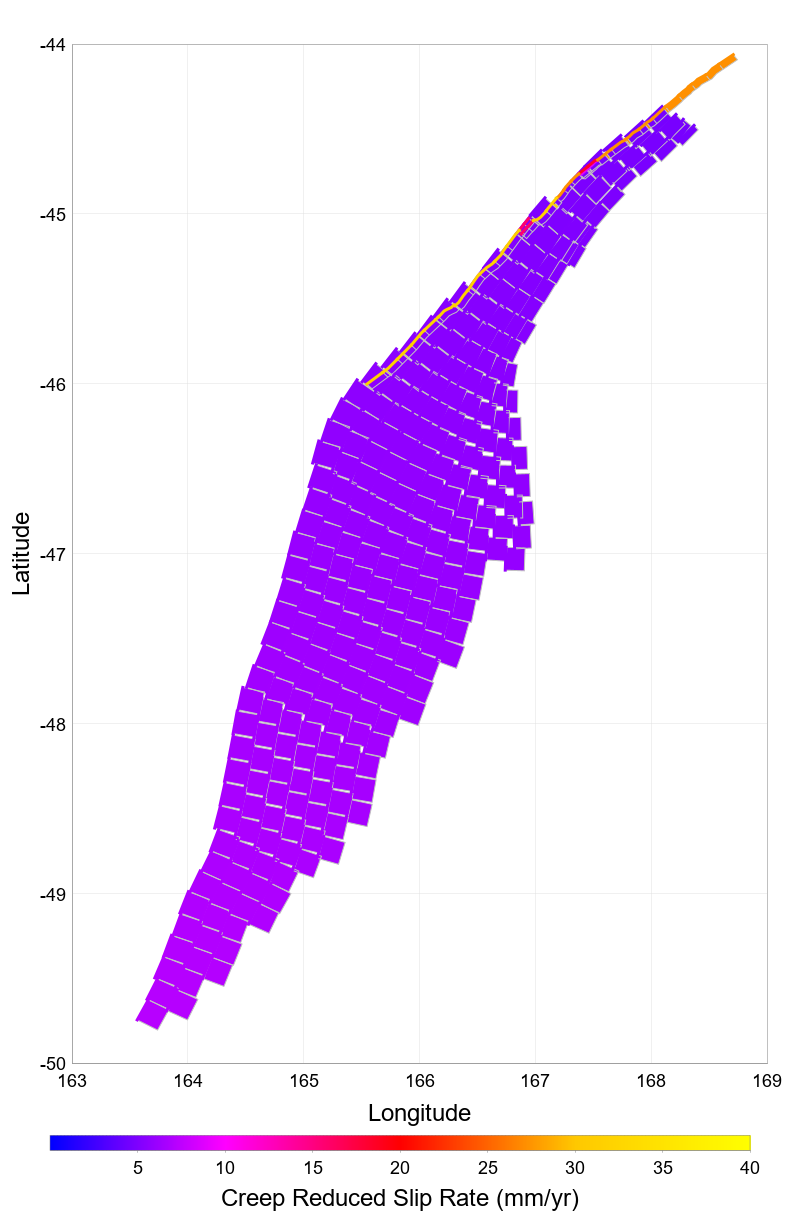
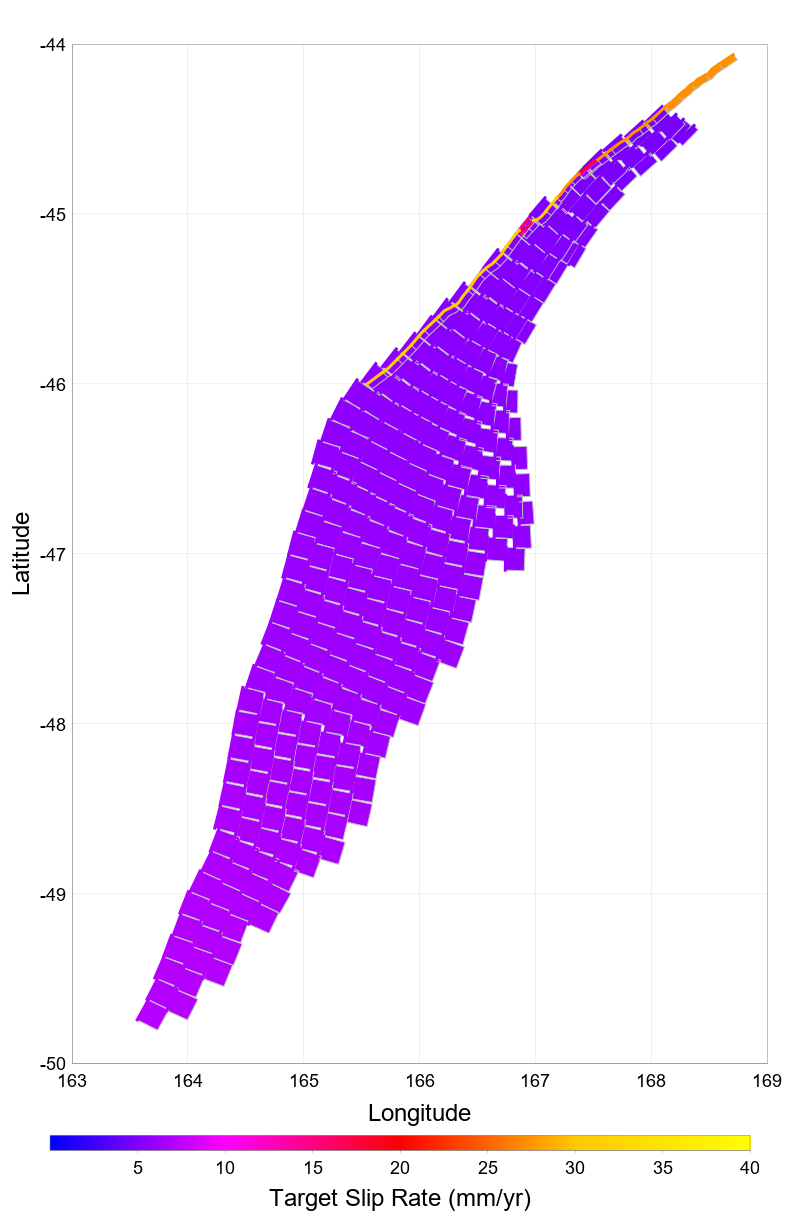
Slip Rates
(top)
Download CSV file with slip rate data: slip_rates.csv
Linear Slip Rate Plots
(top)
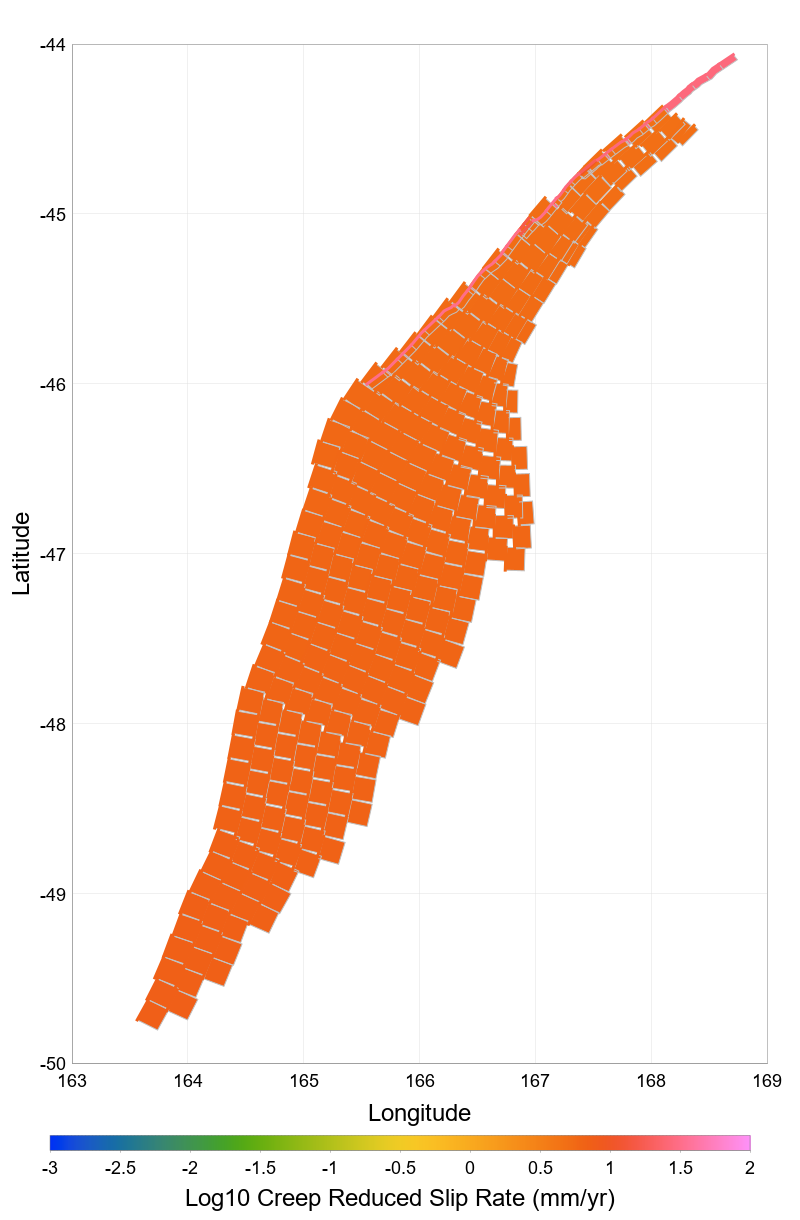
Log10 Slip Rate Plots
(top)
Slip Rate Std Dev Plots
(top)
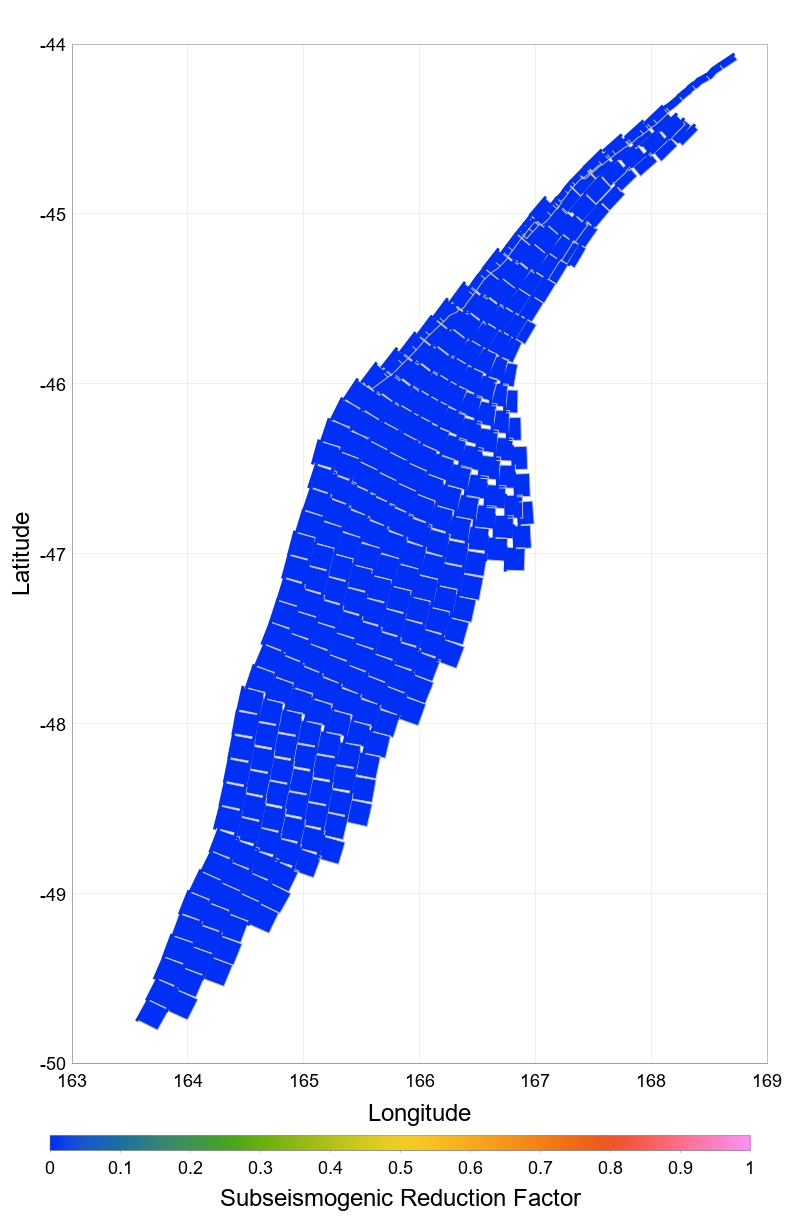
Slip Rate & Area Reductions
(top)
Rupture Scalar Histograms
(top)
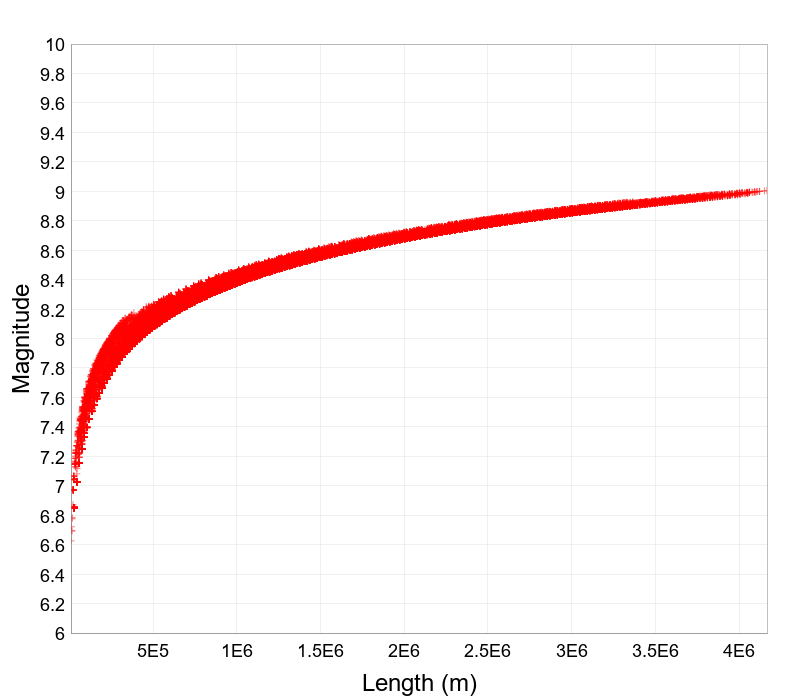
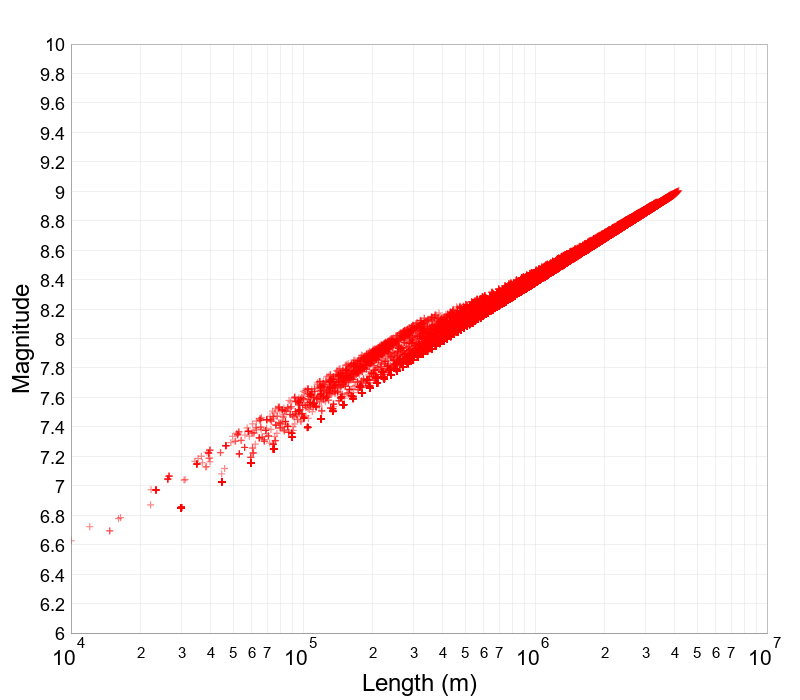
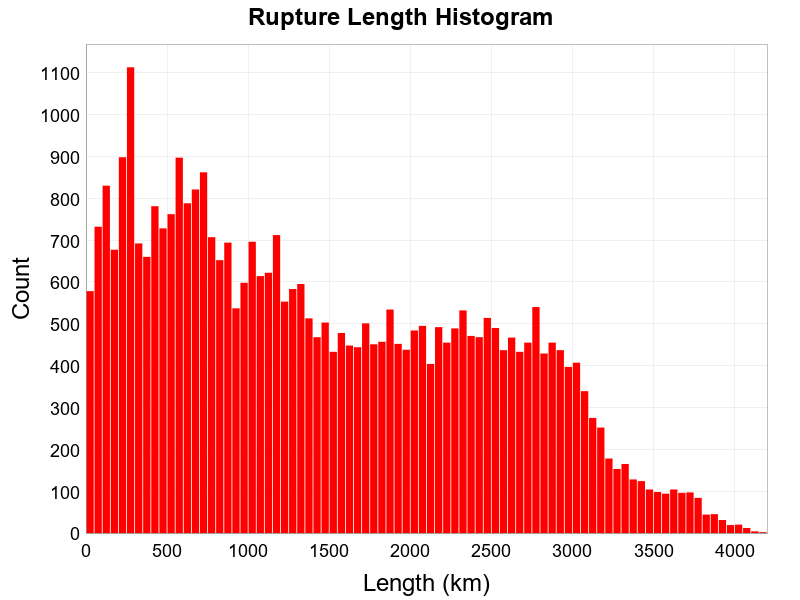
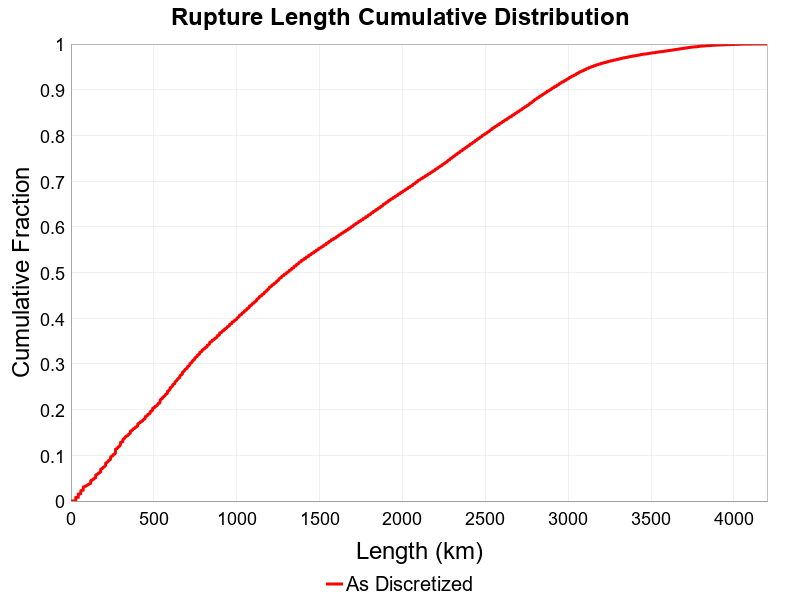
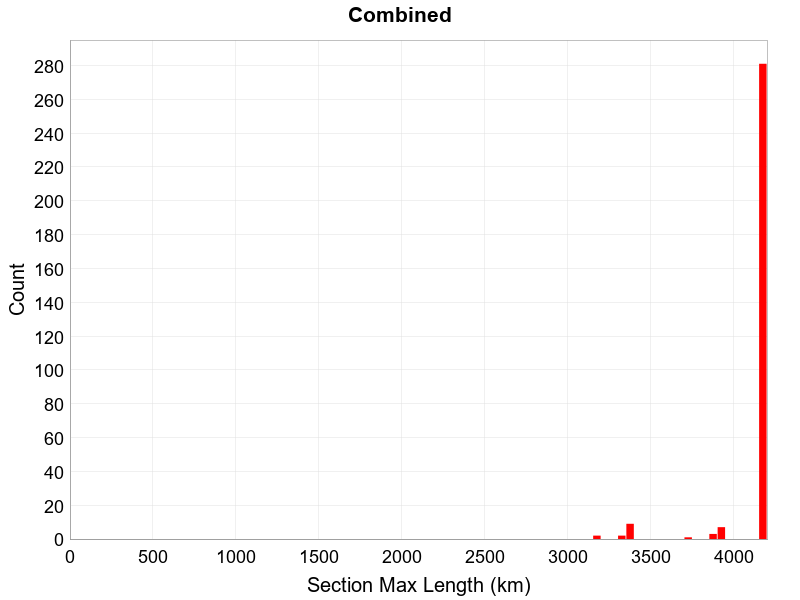
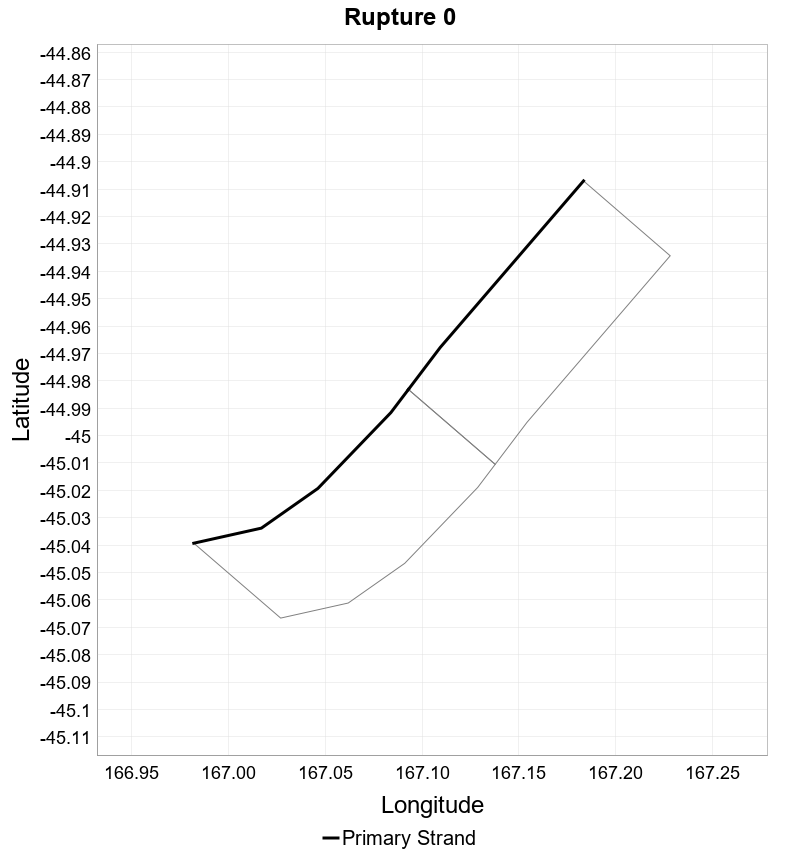
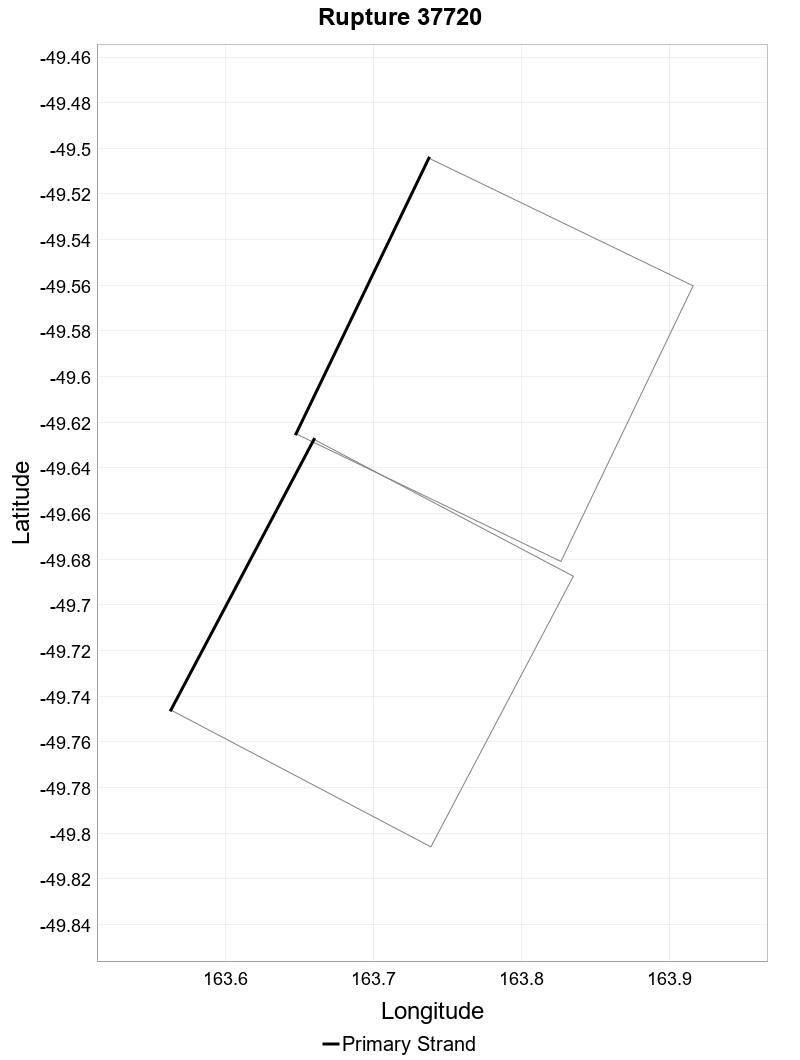
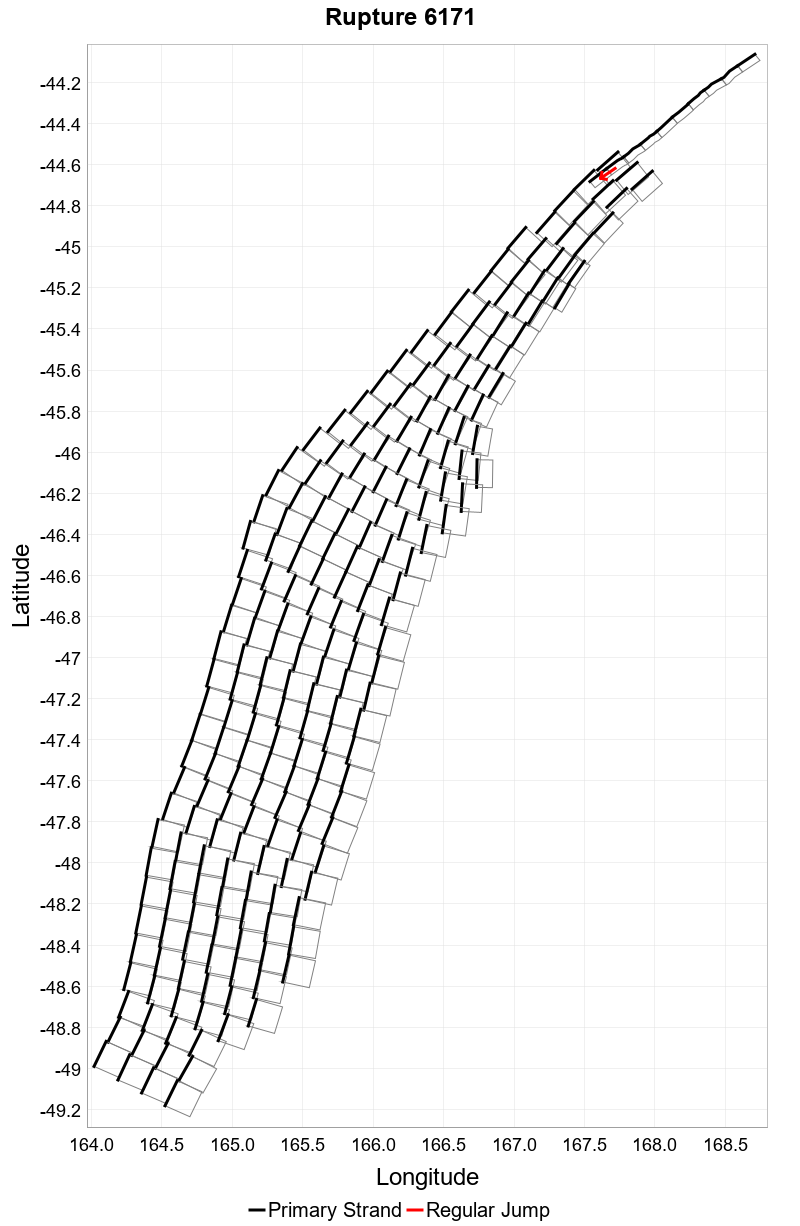
Rupture Length
(top)
Total length (km) of the rupture, not including jumps or gaps.
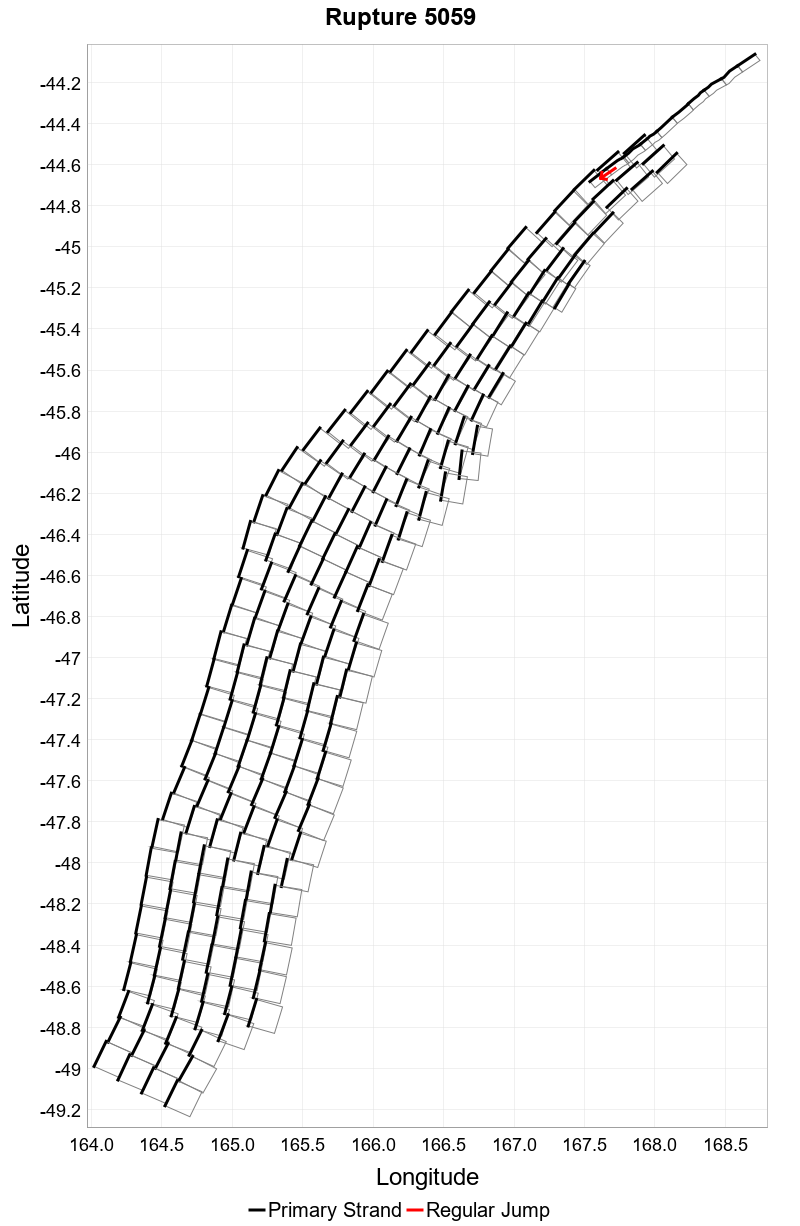
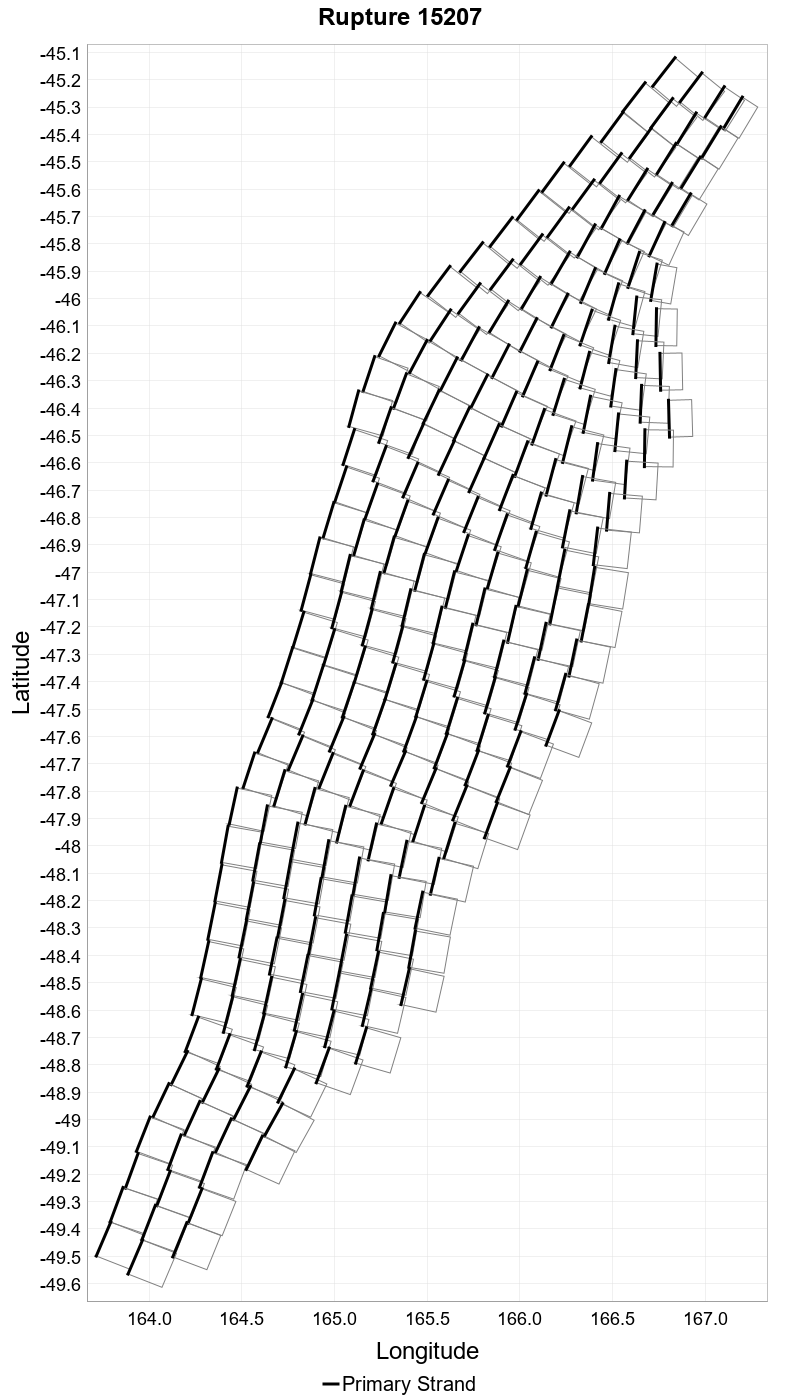
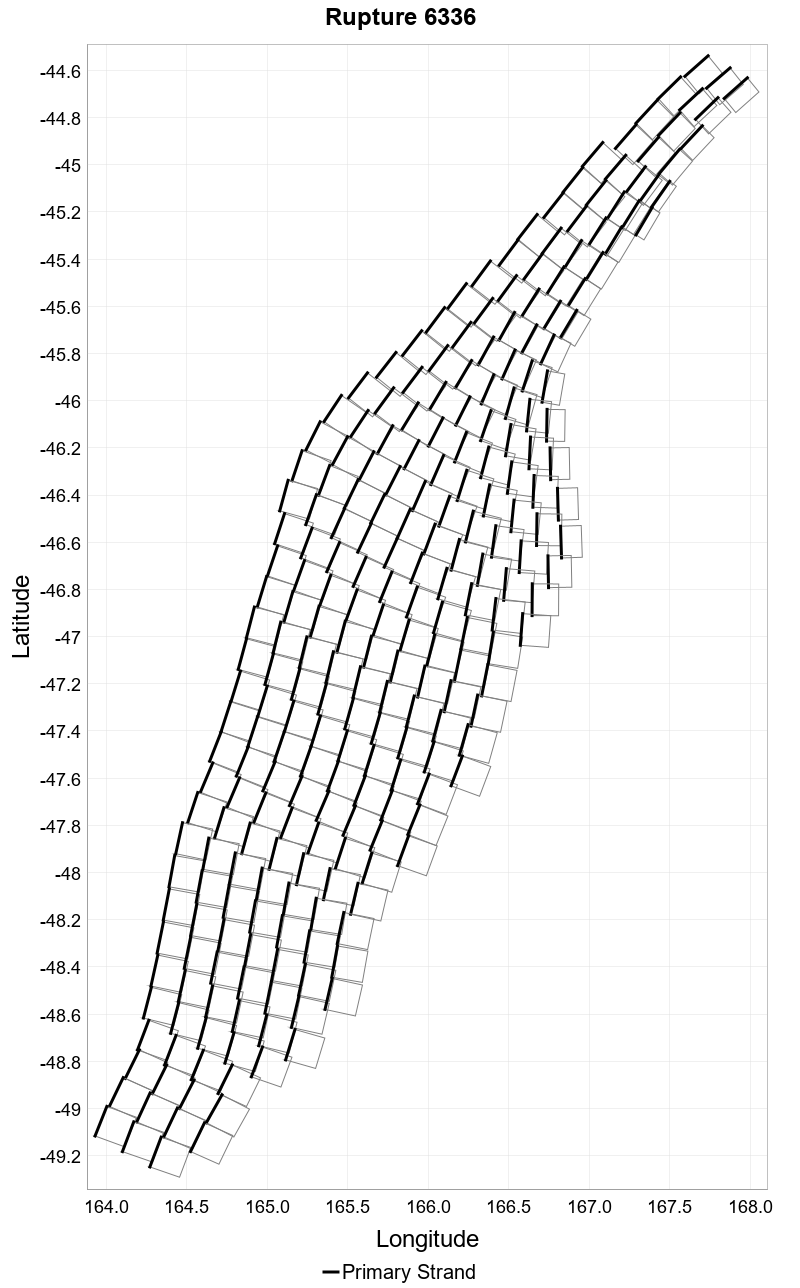
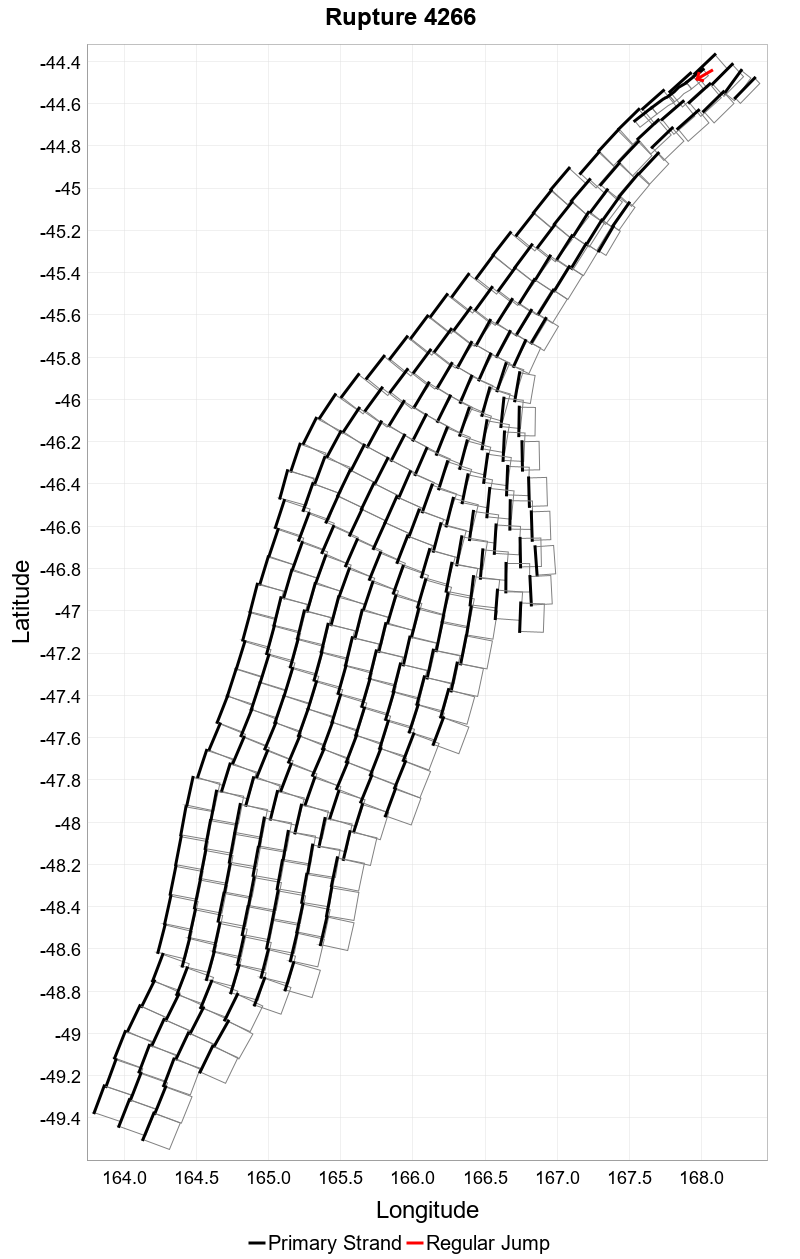
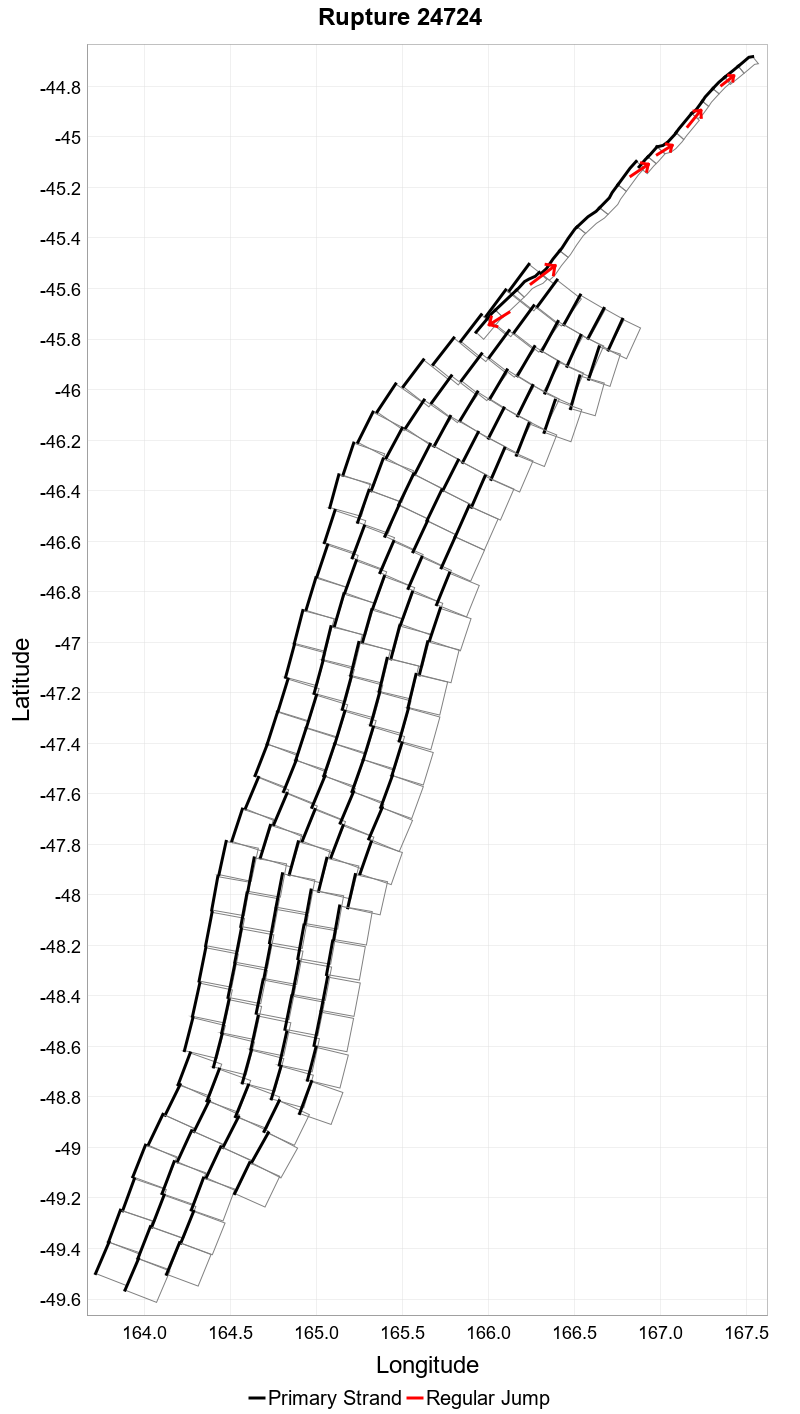
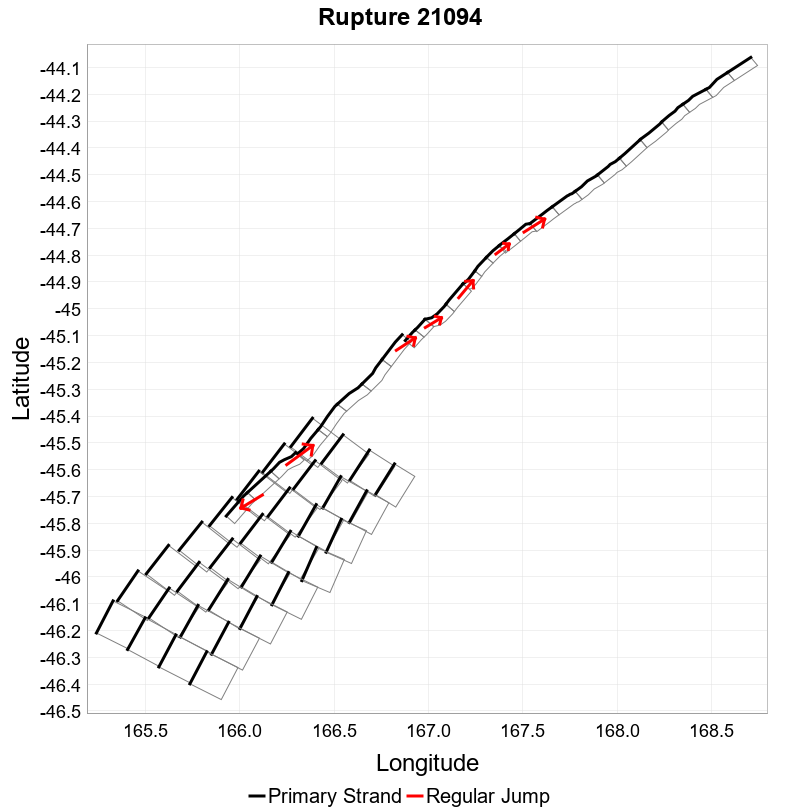
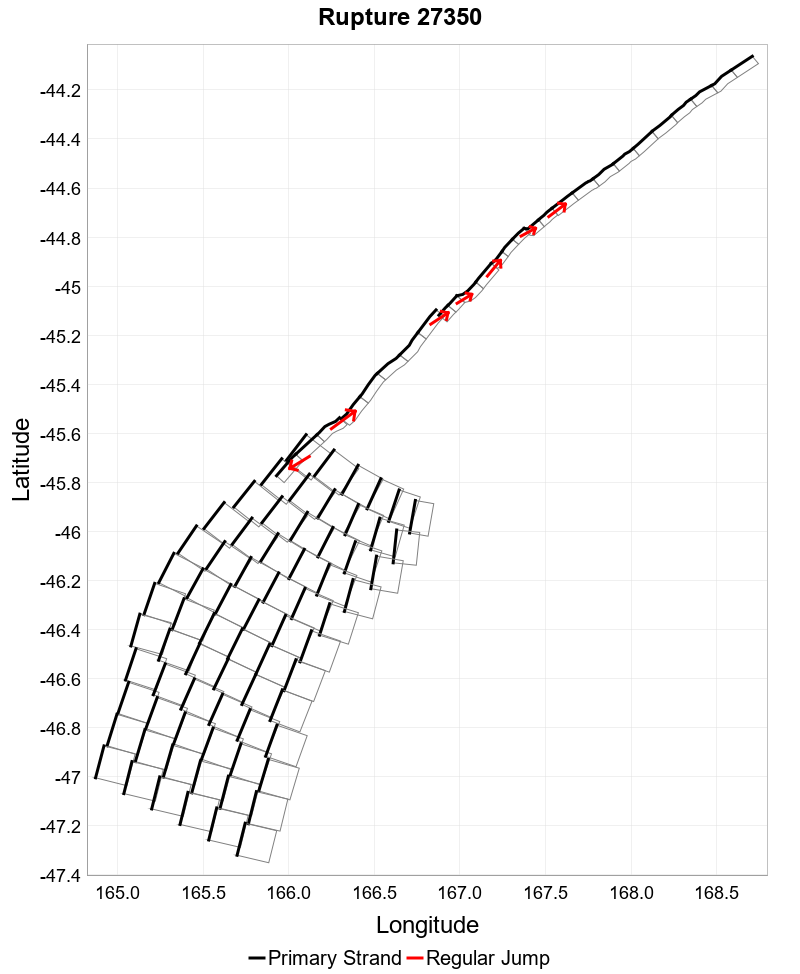
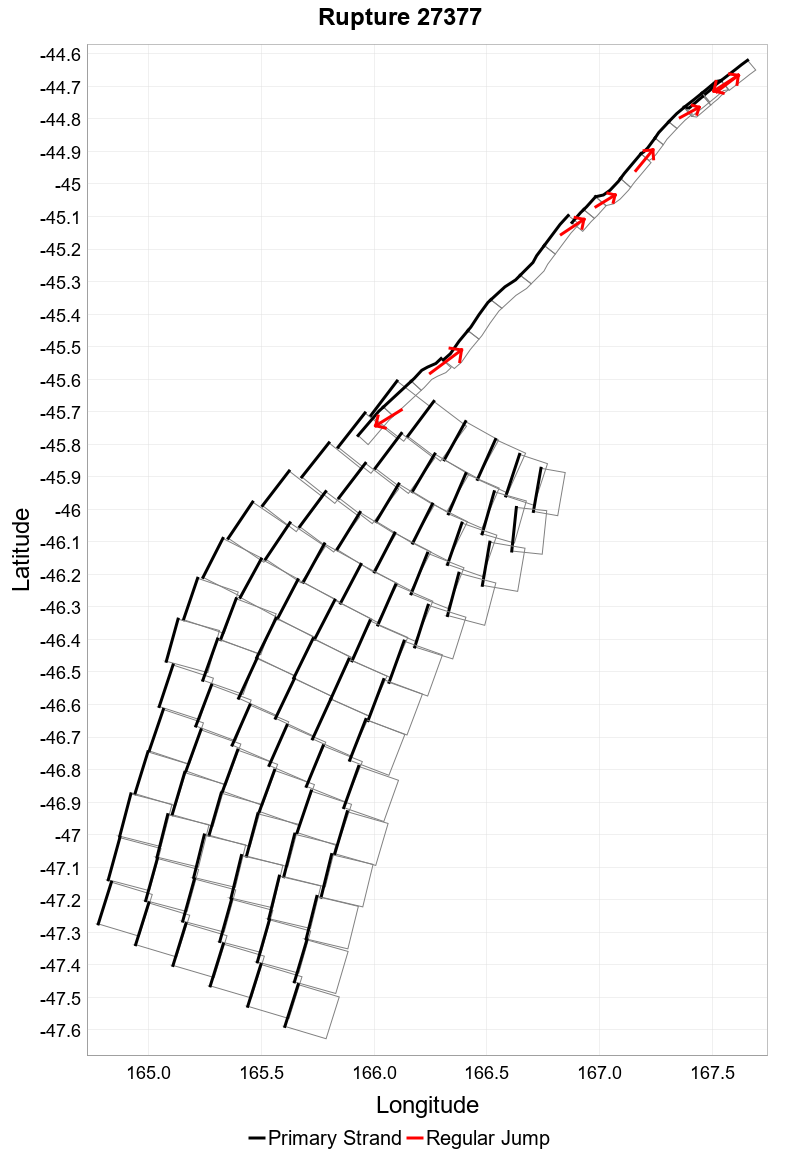
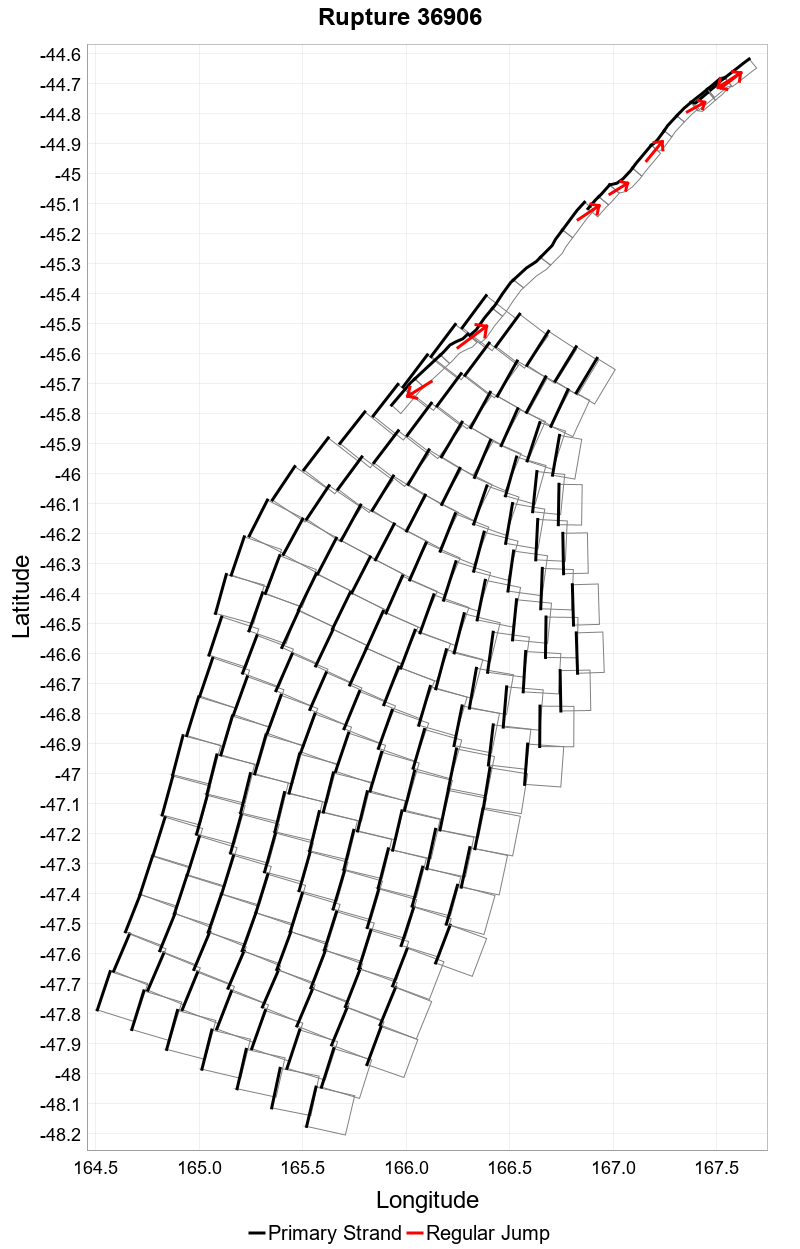
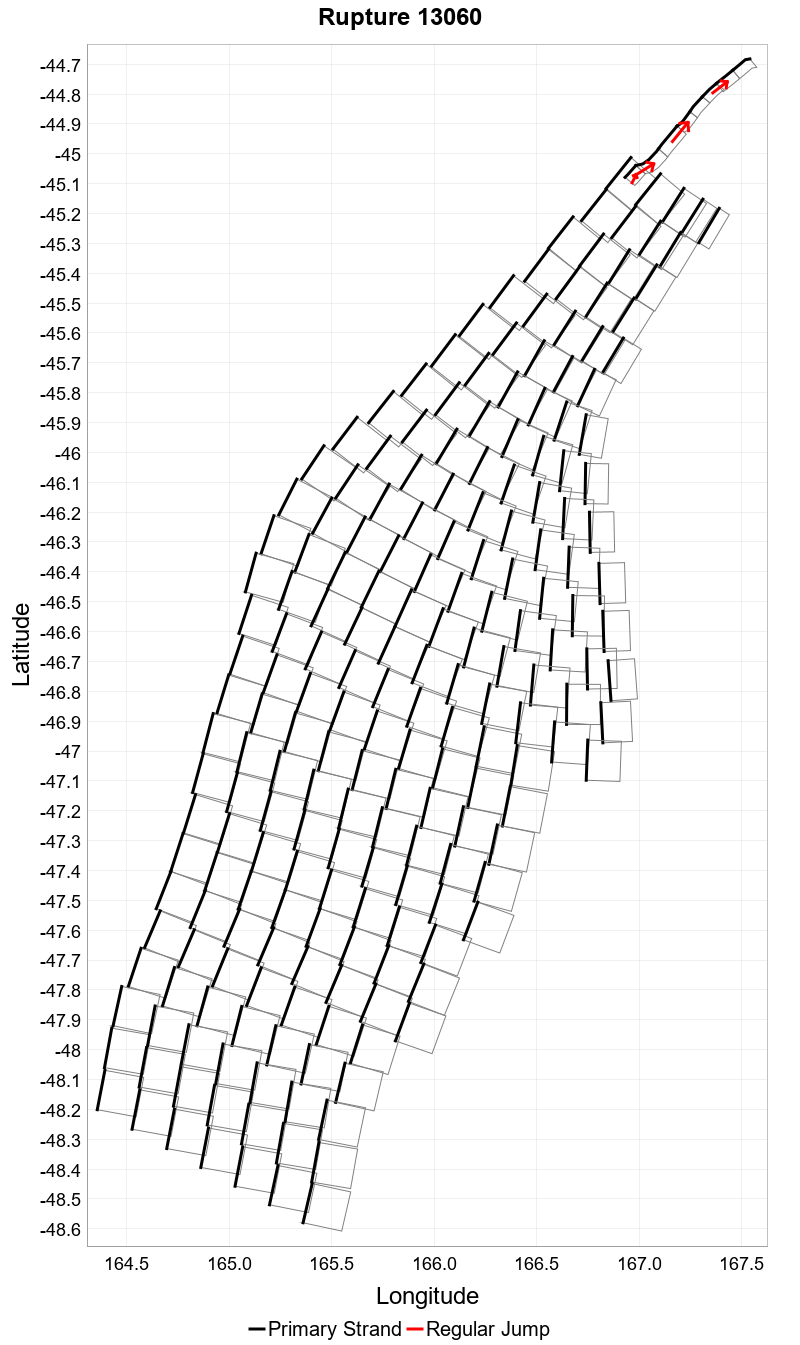
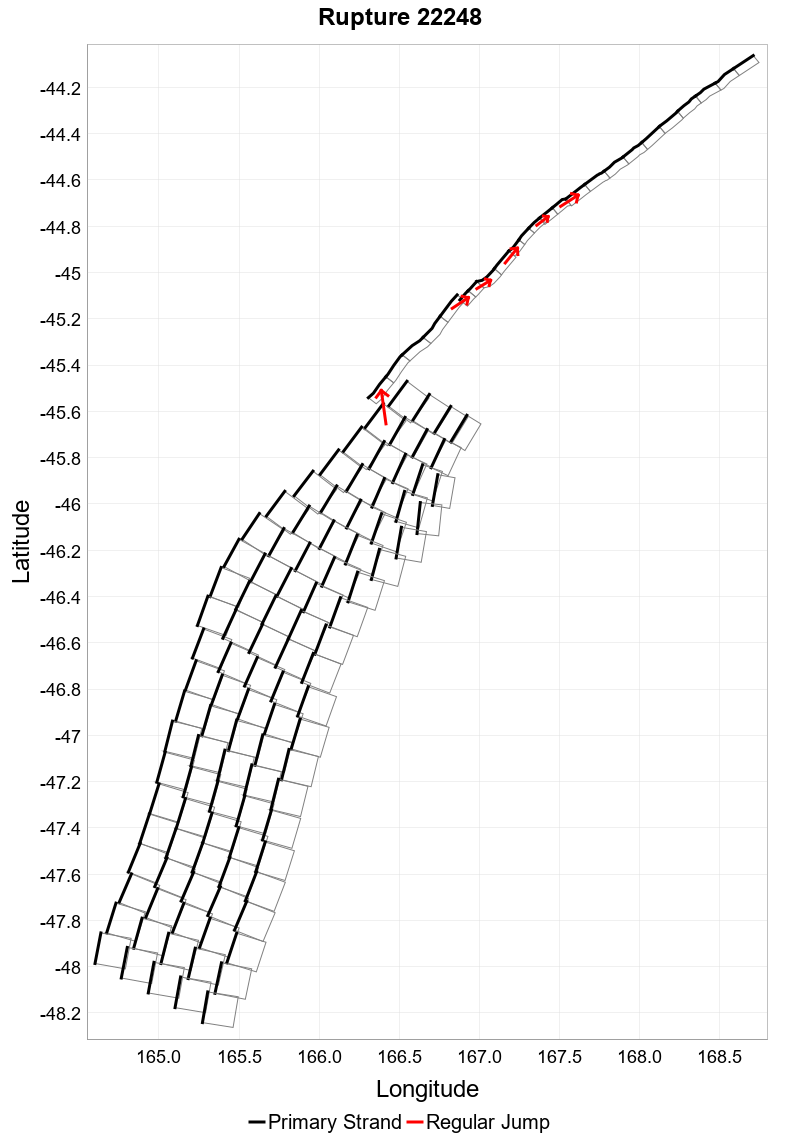
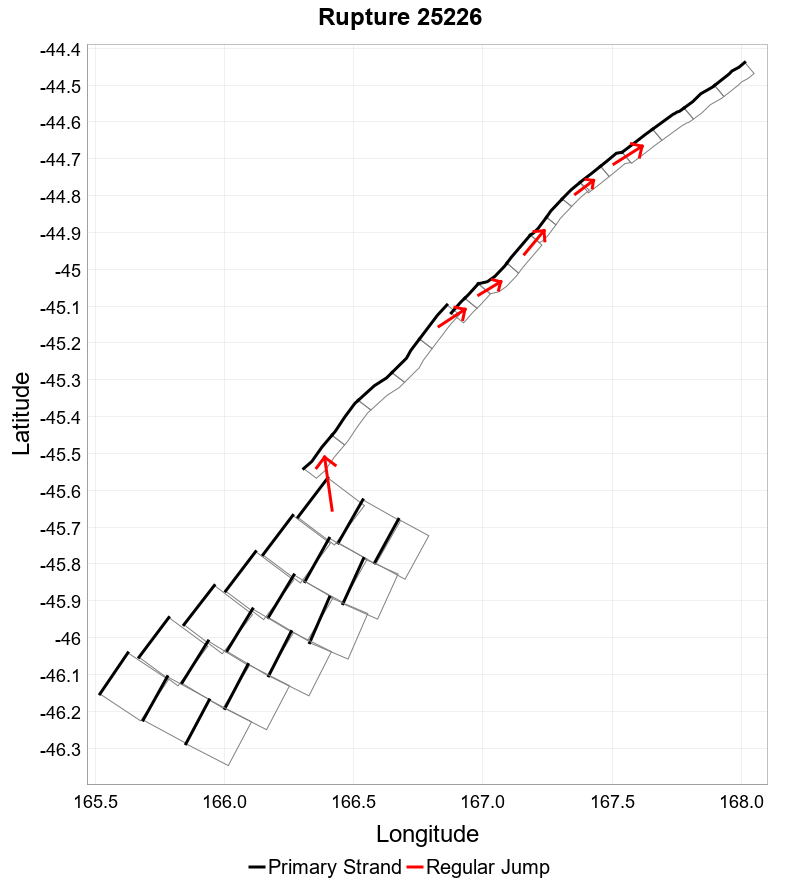
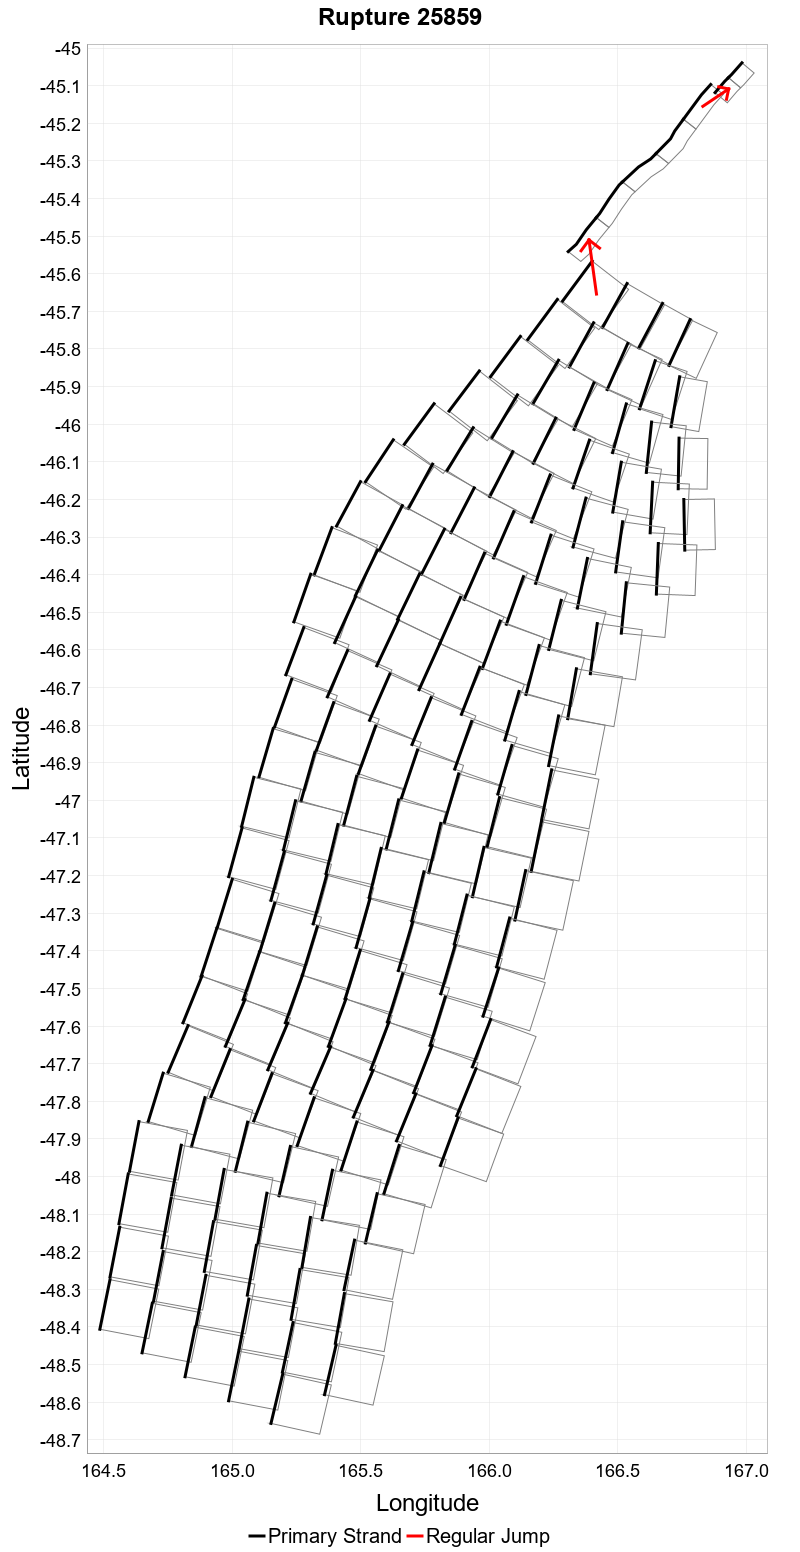
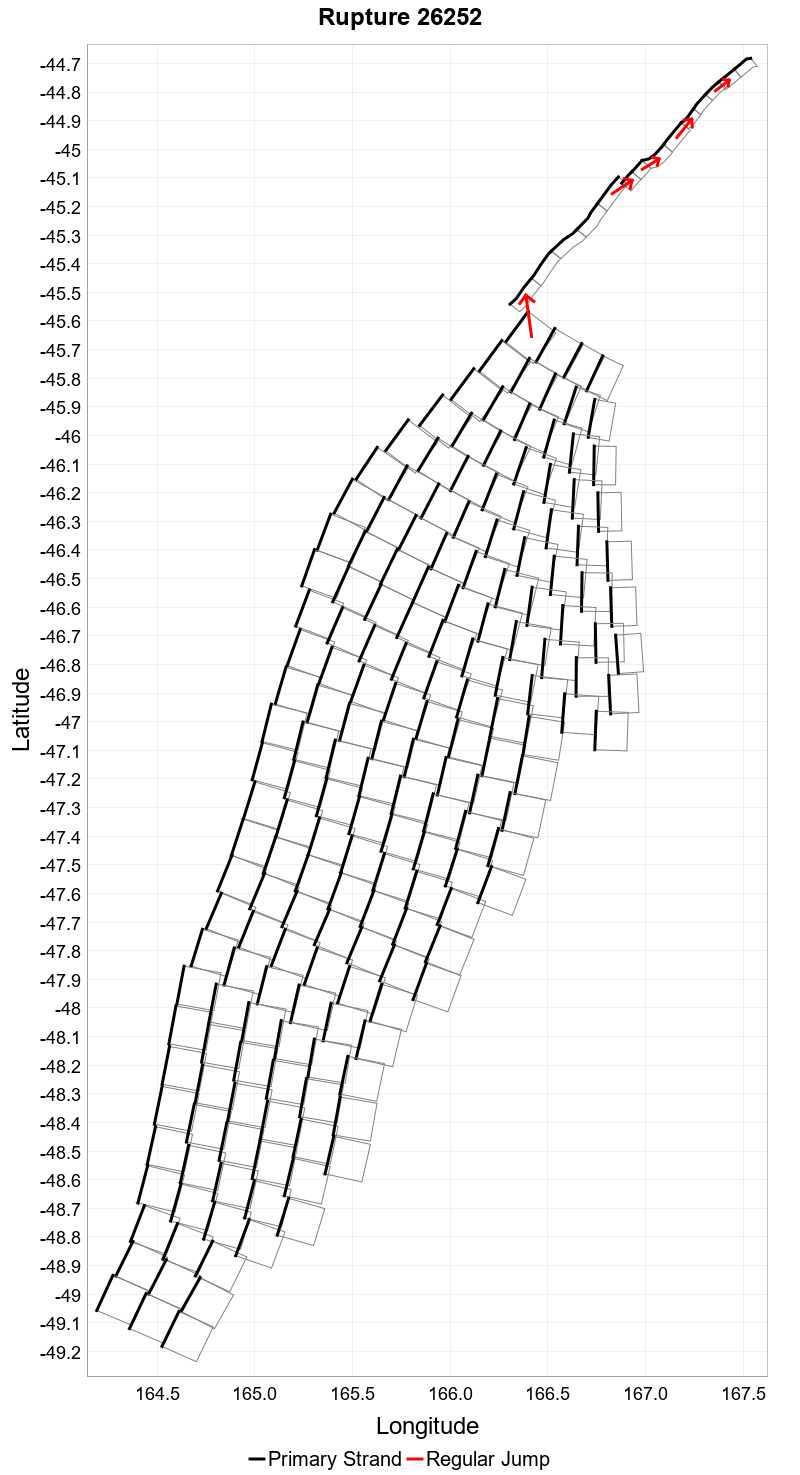
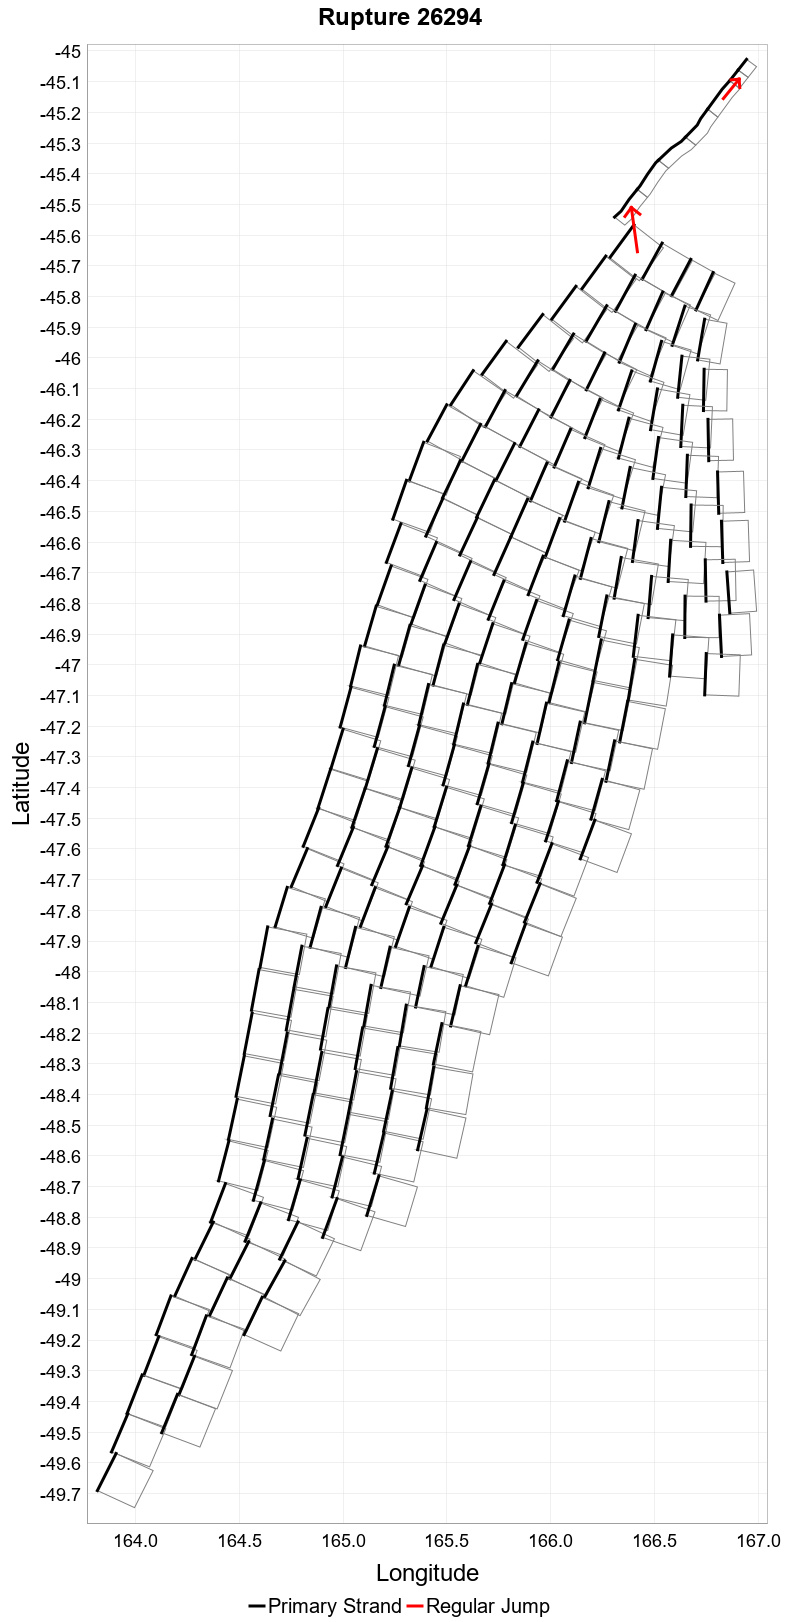
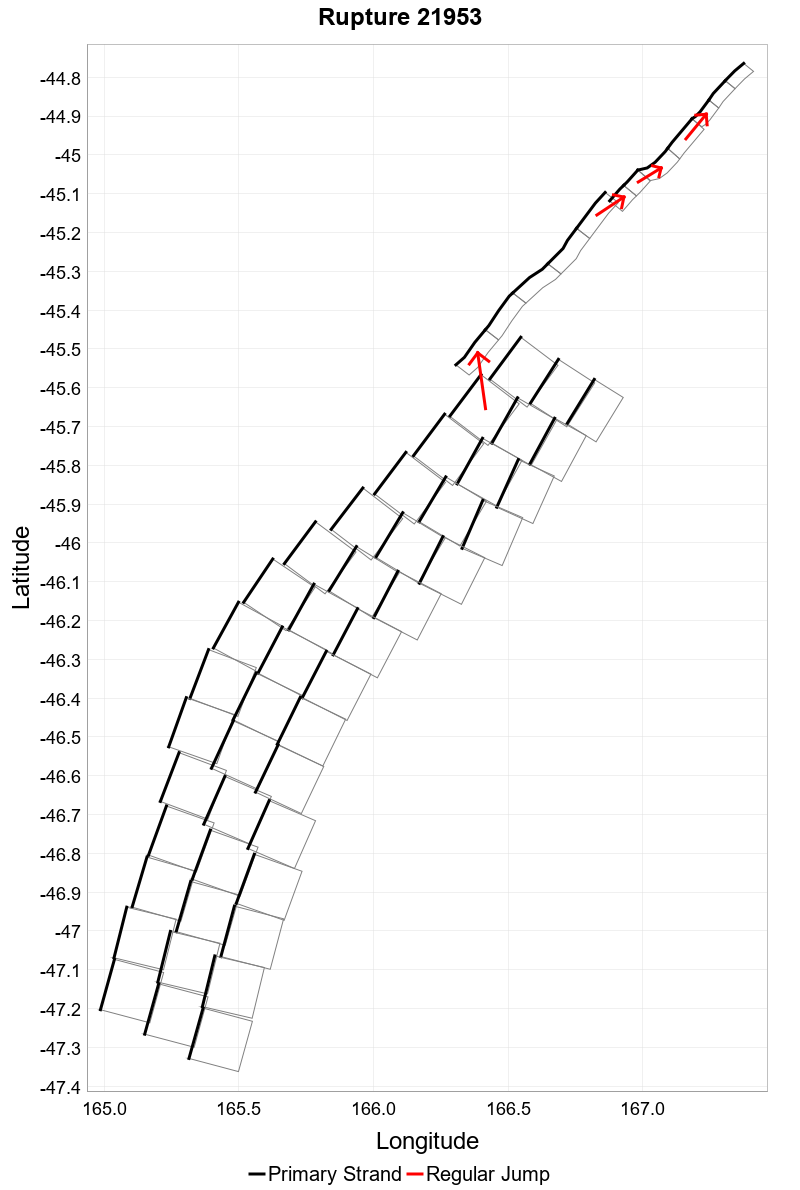
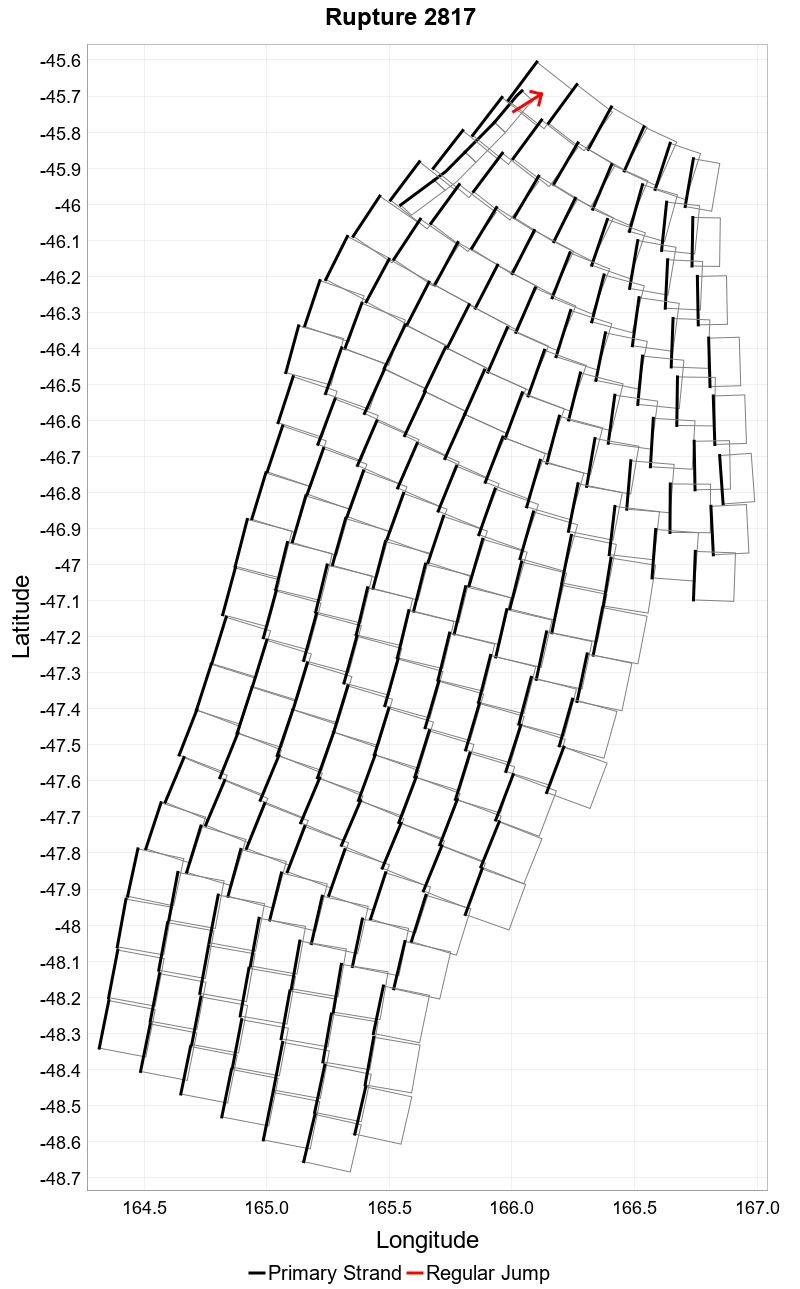
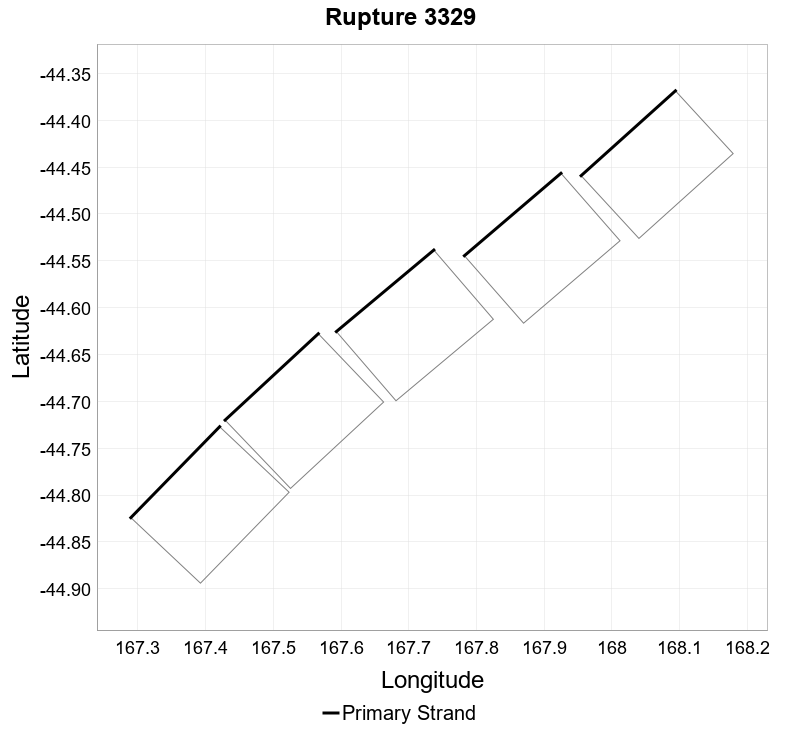
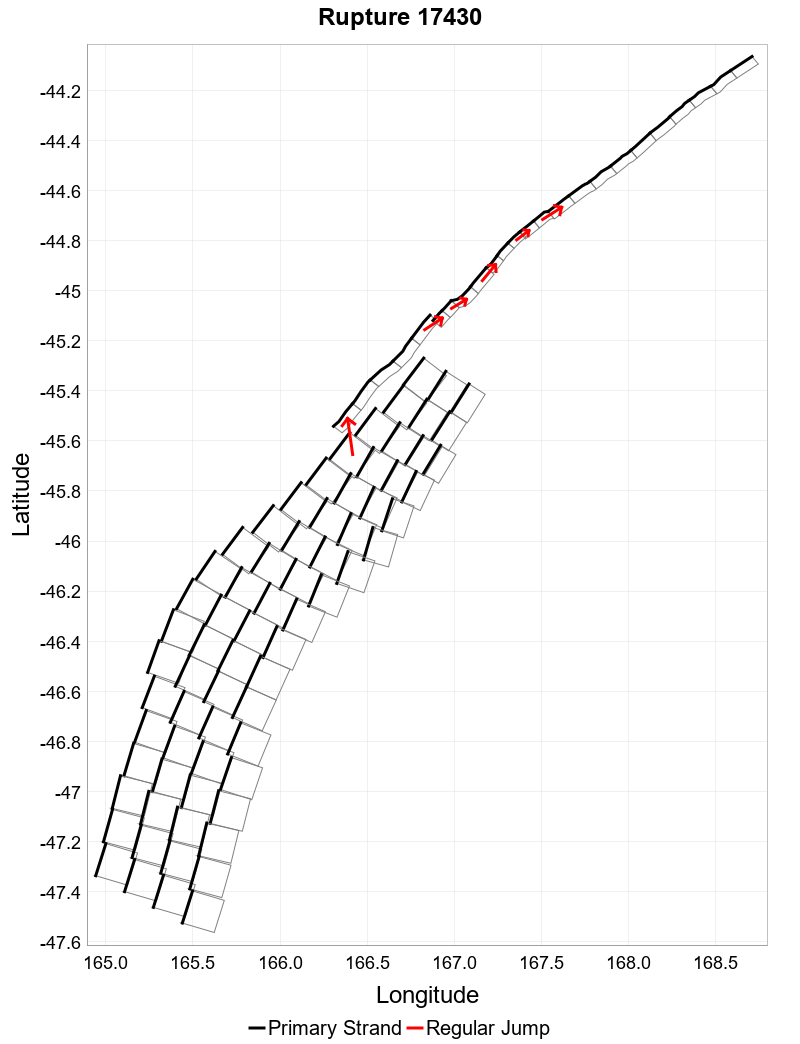
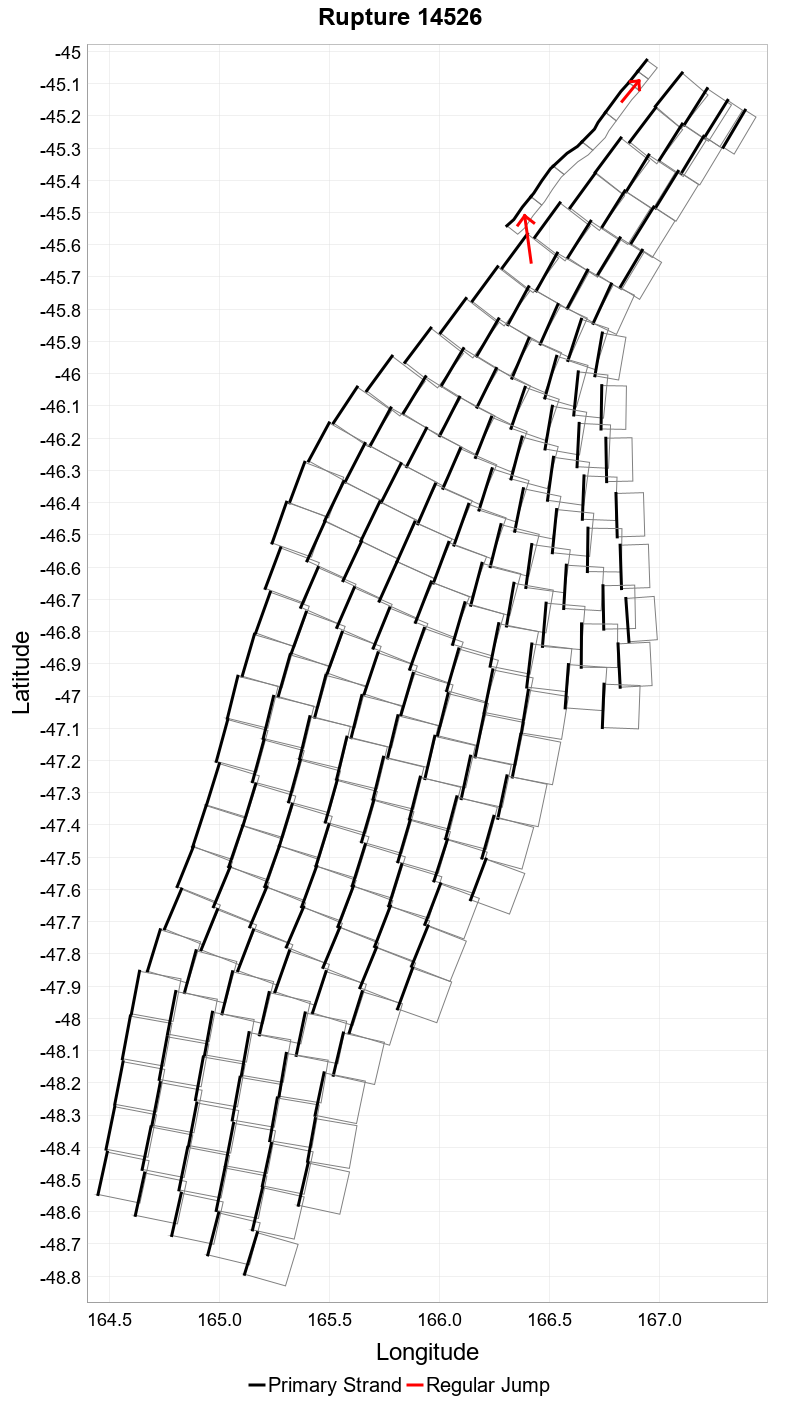
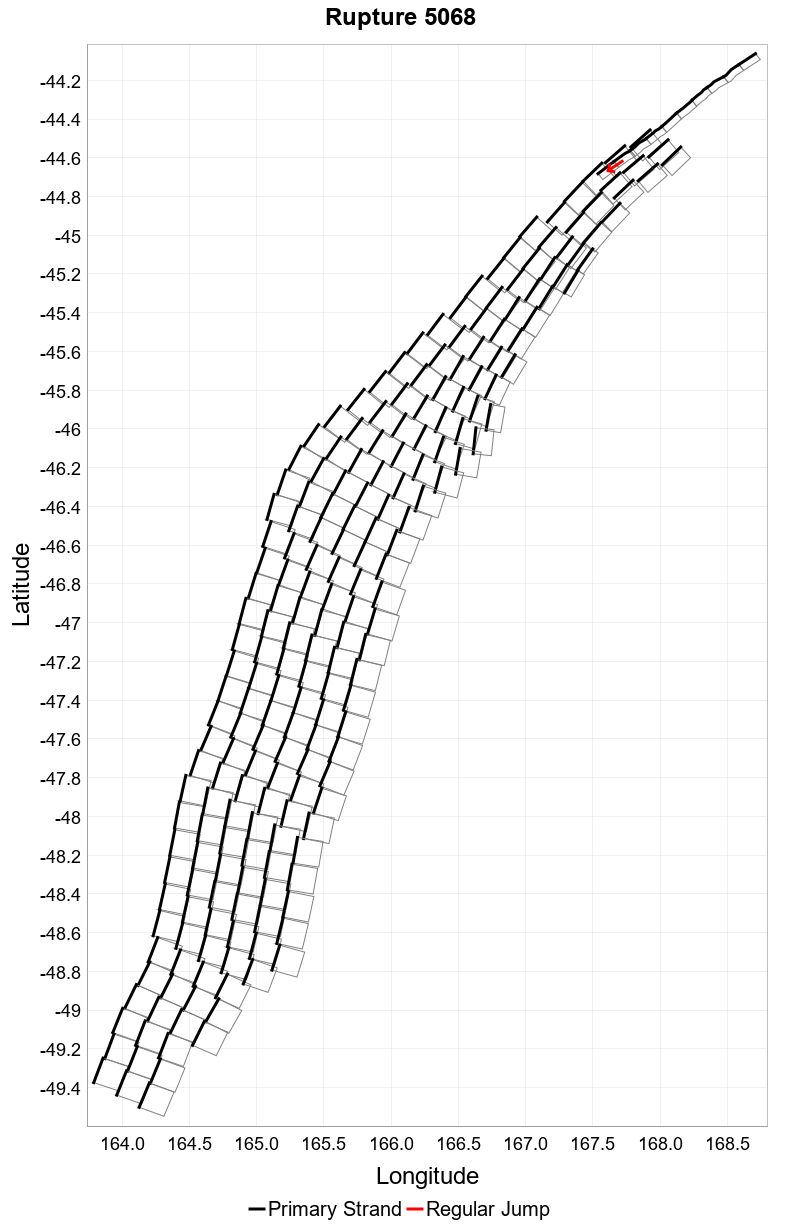
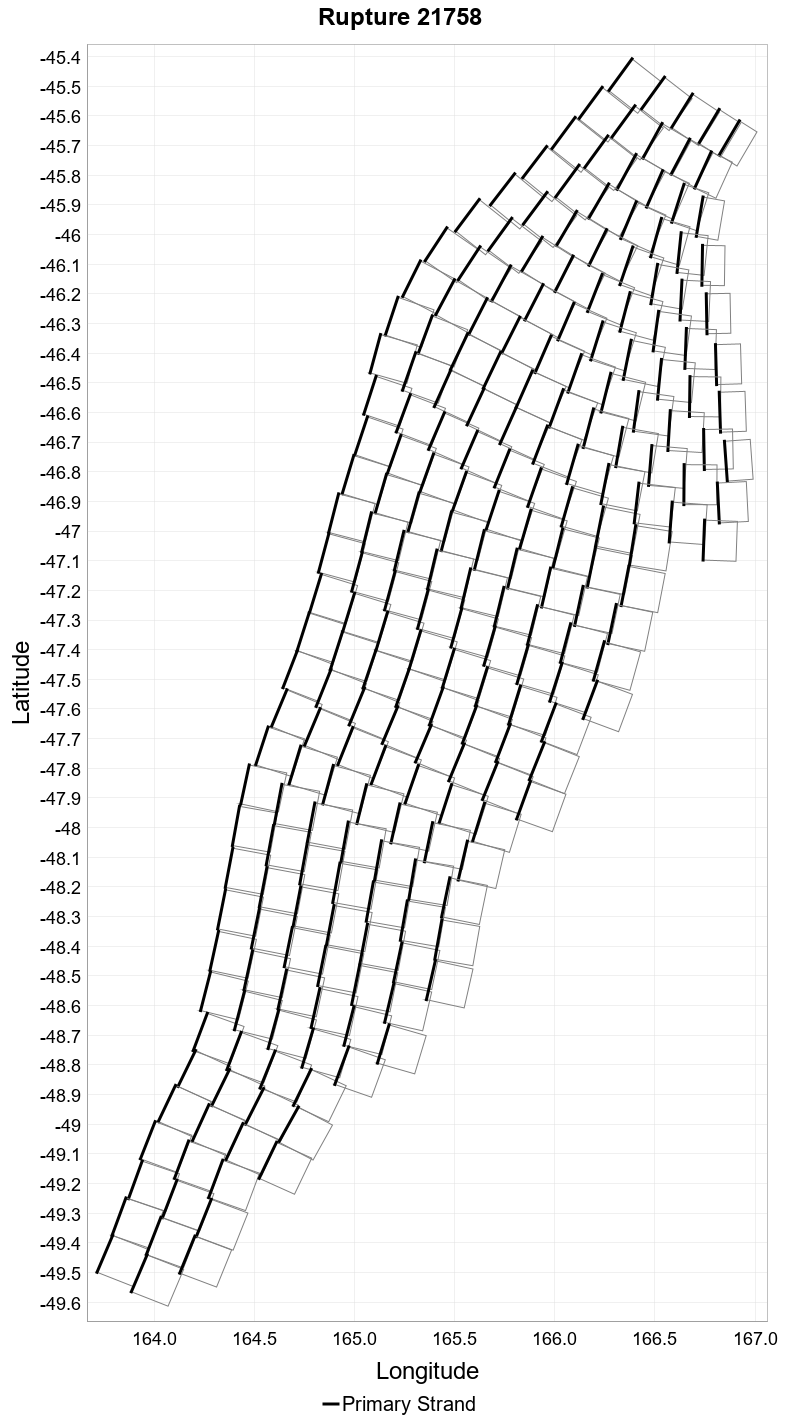
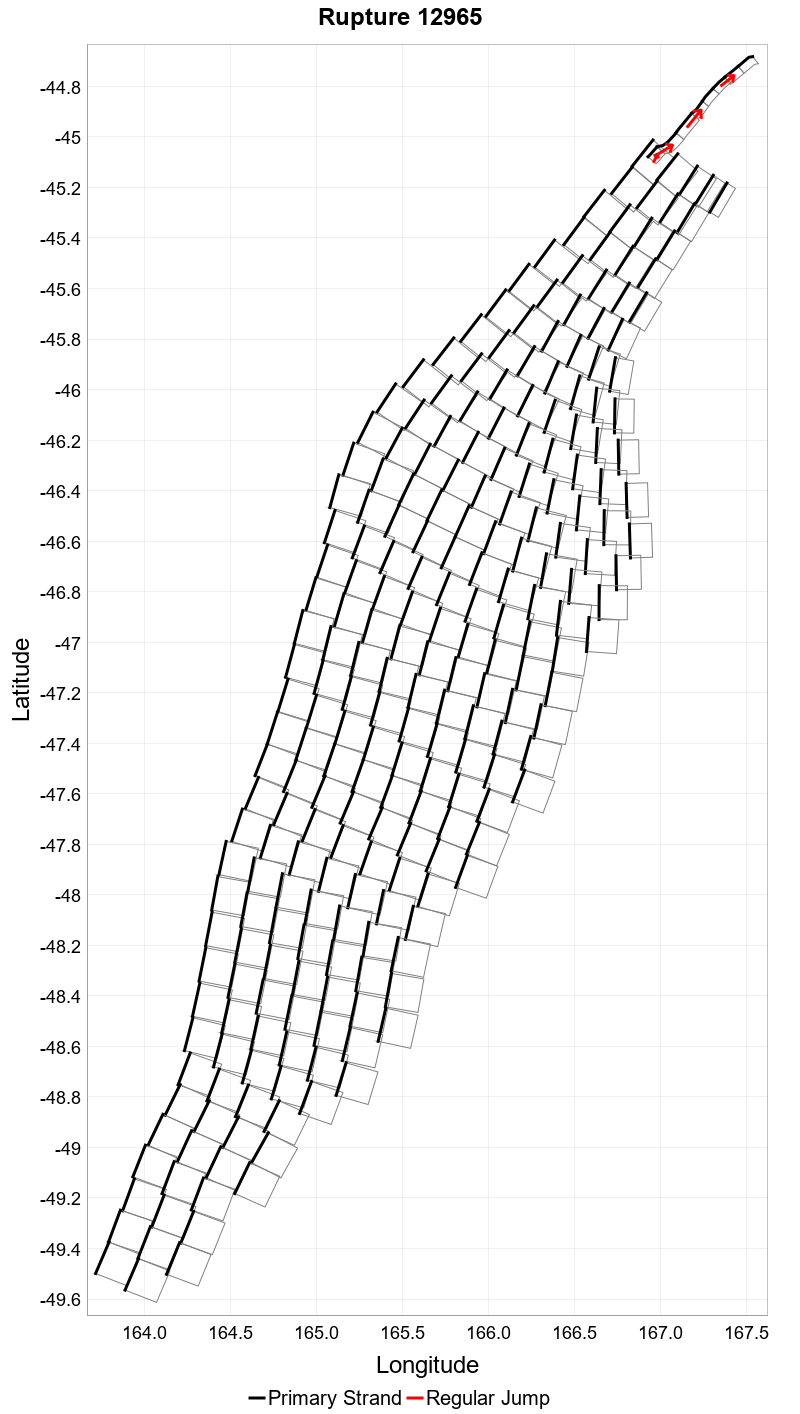
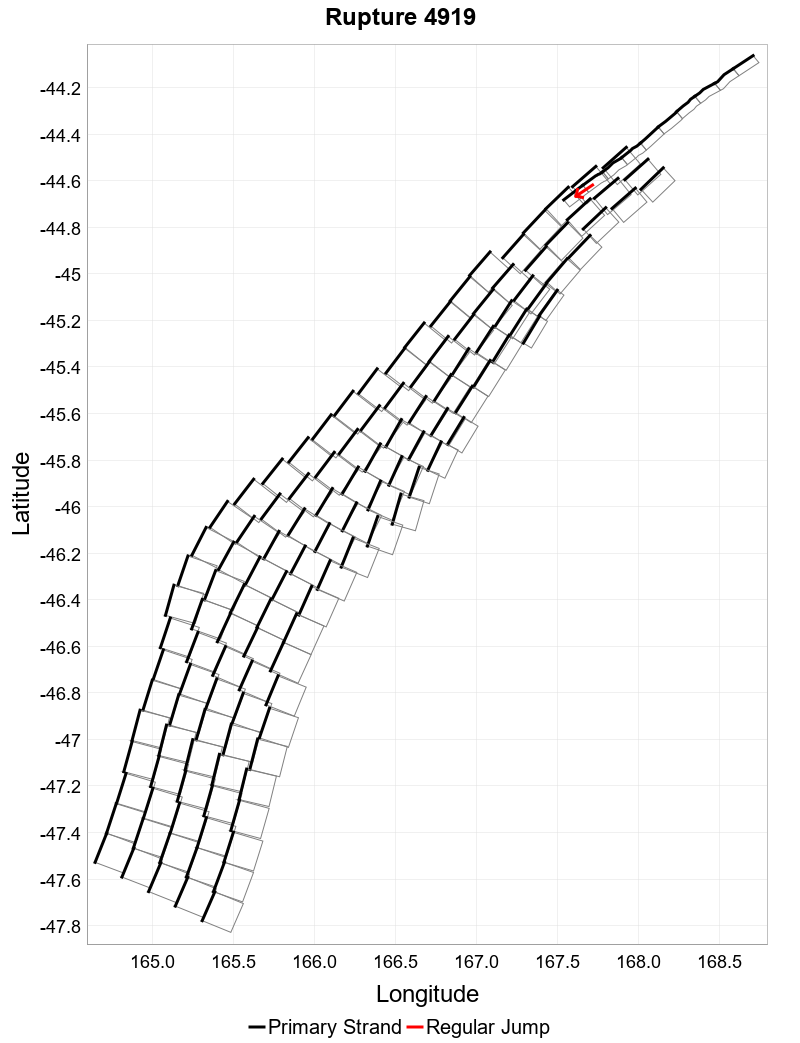
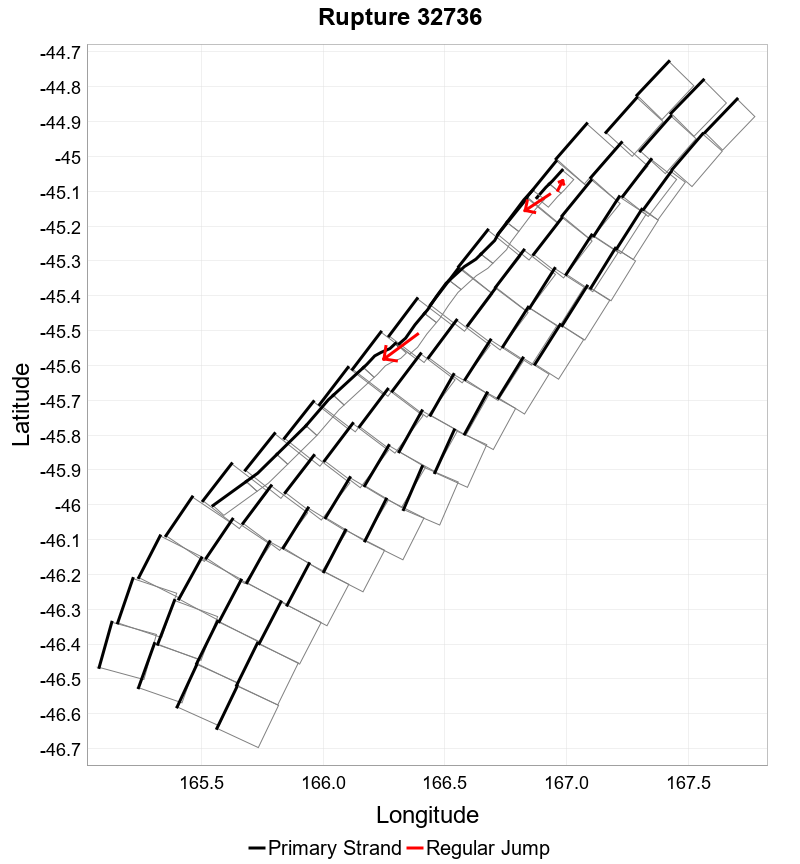
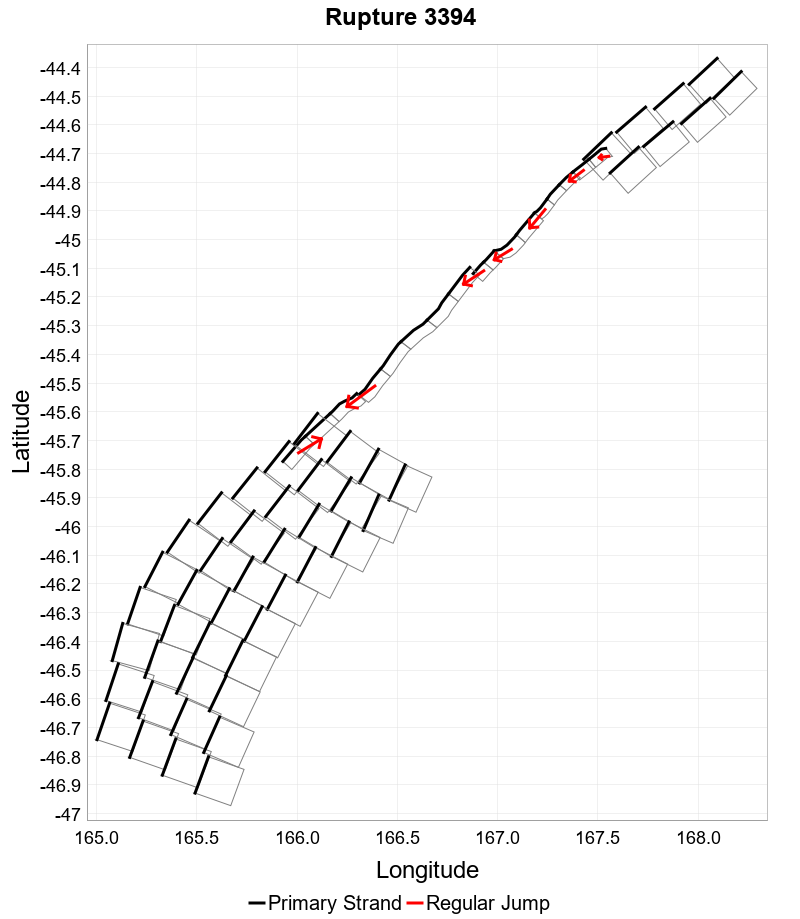
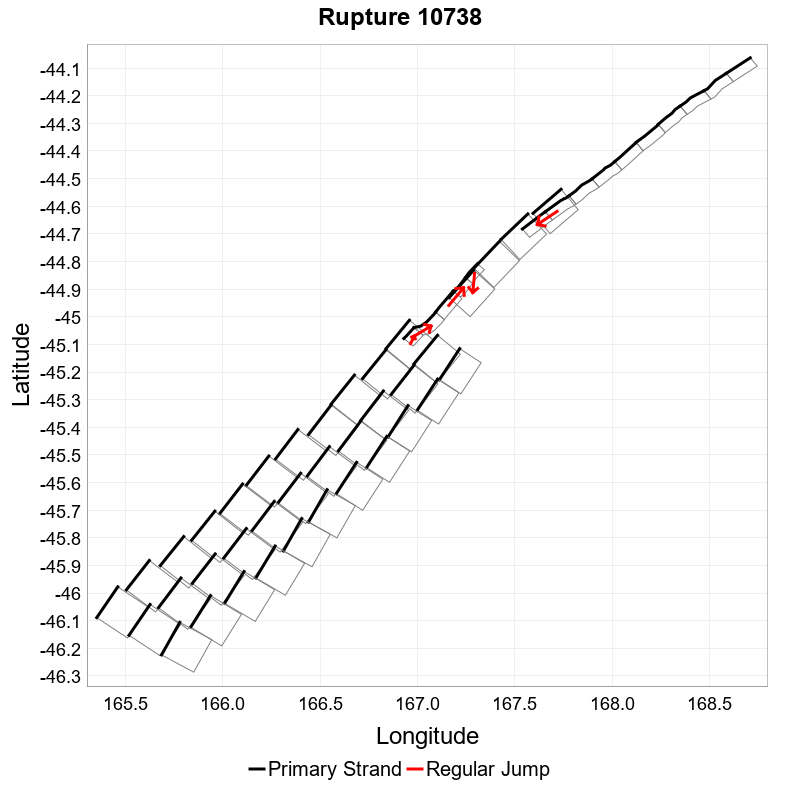
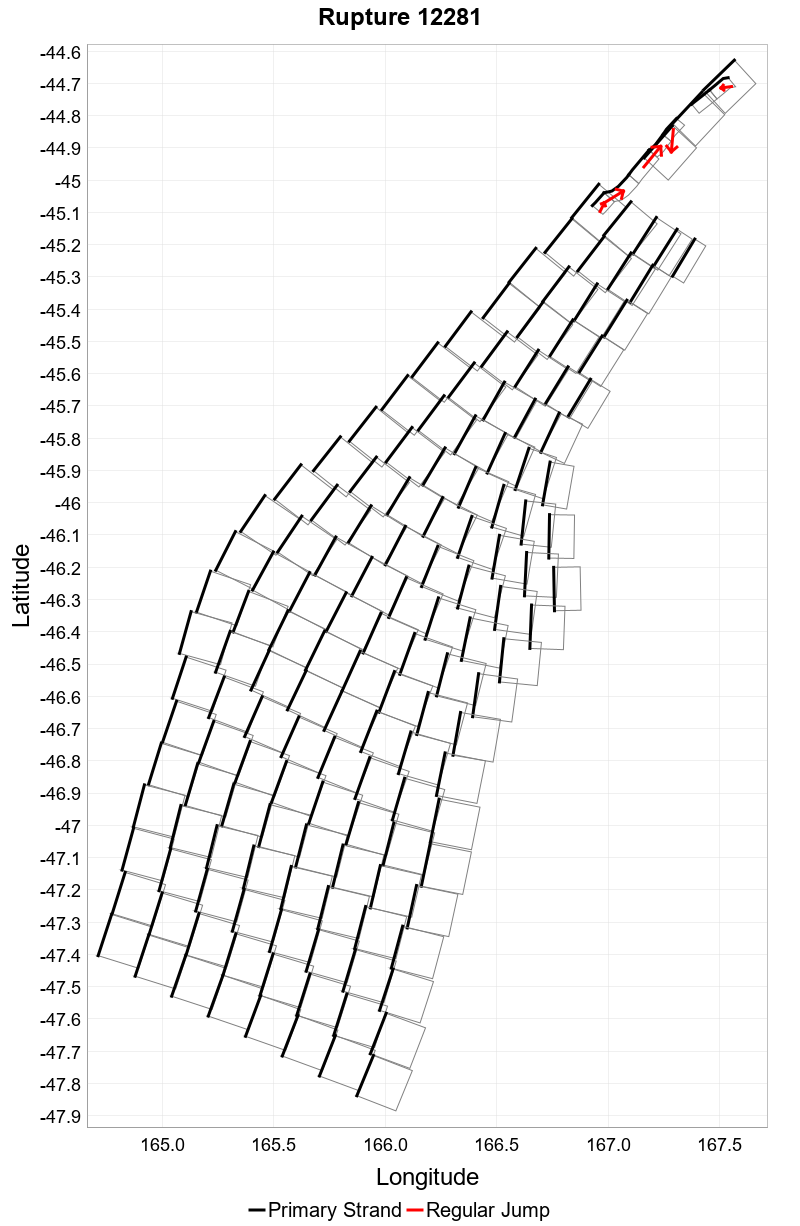
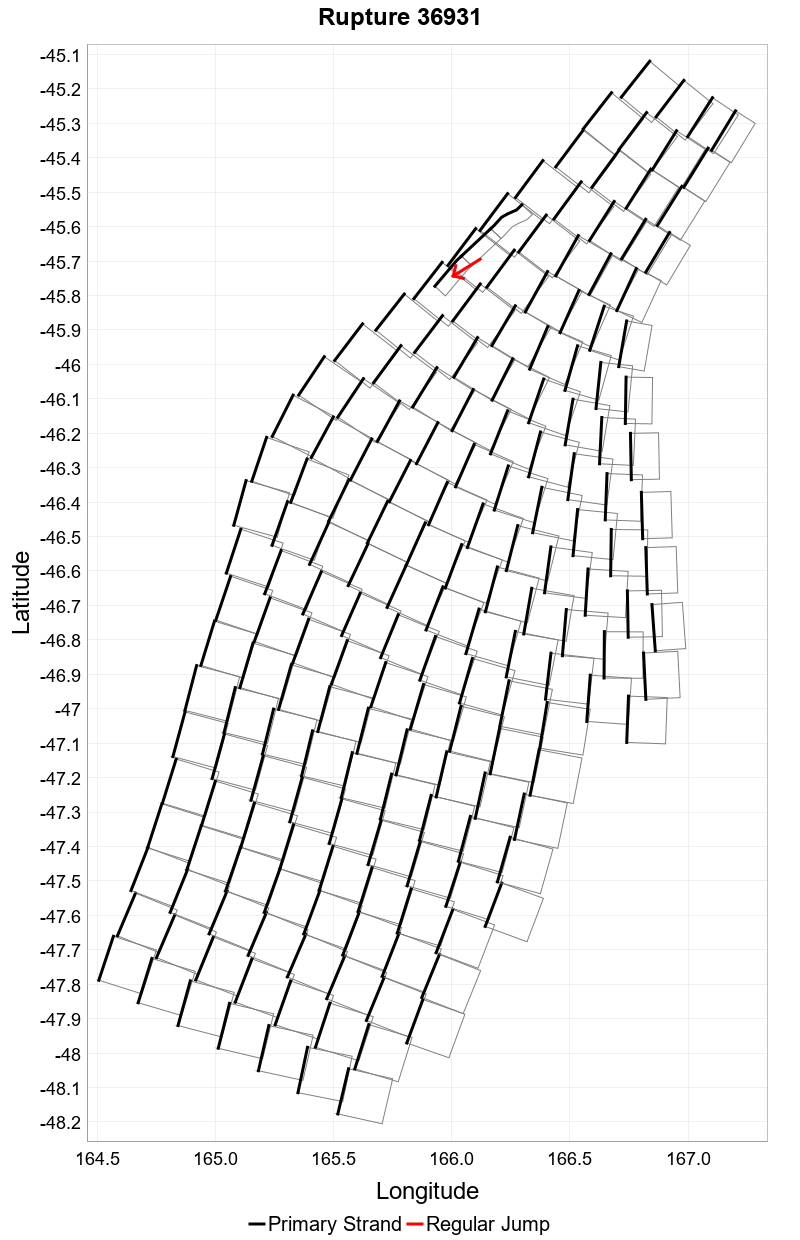
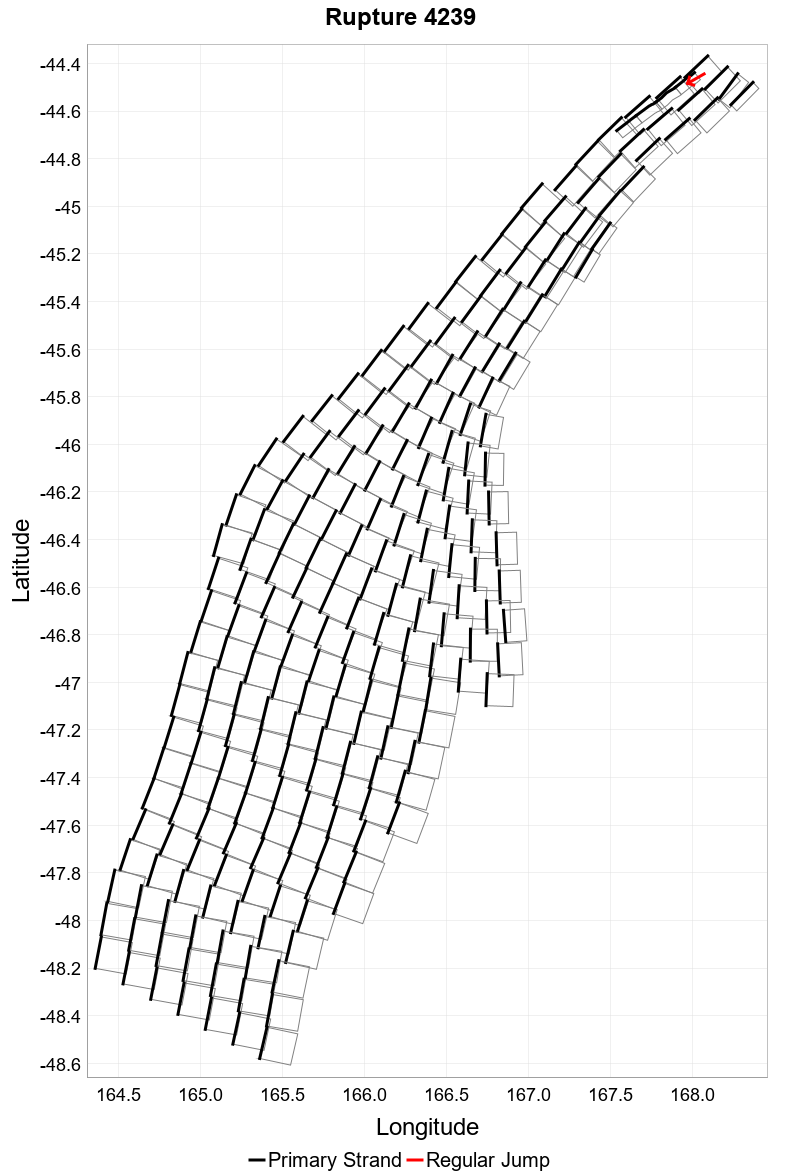
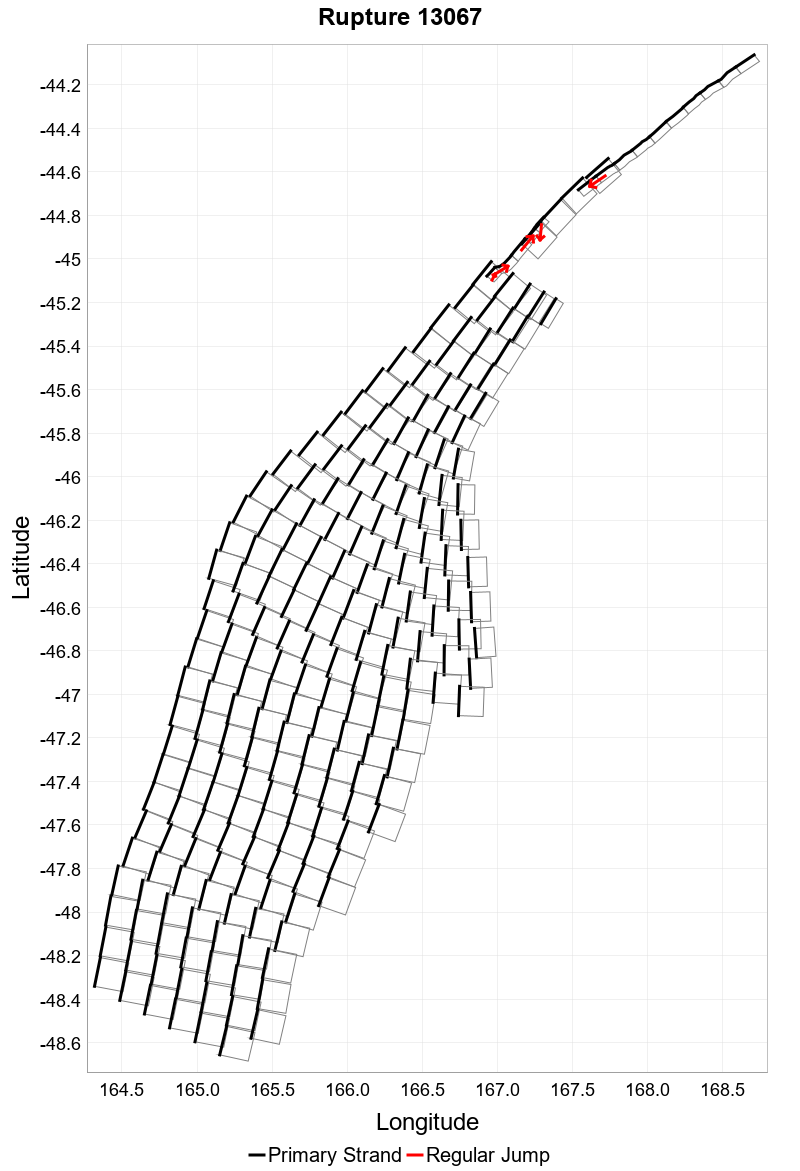
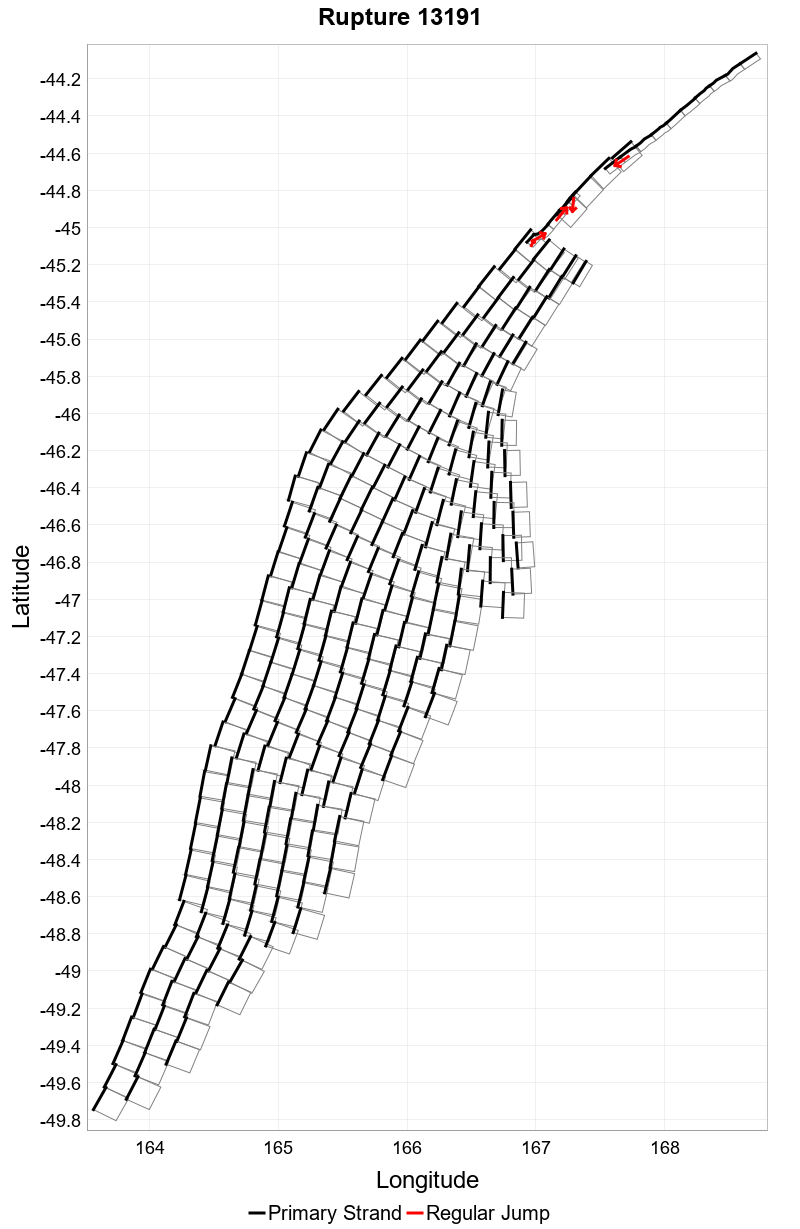
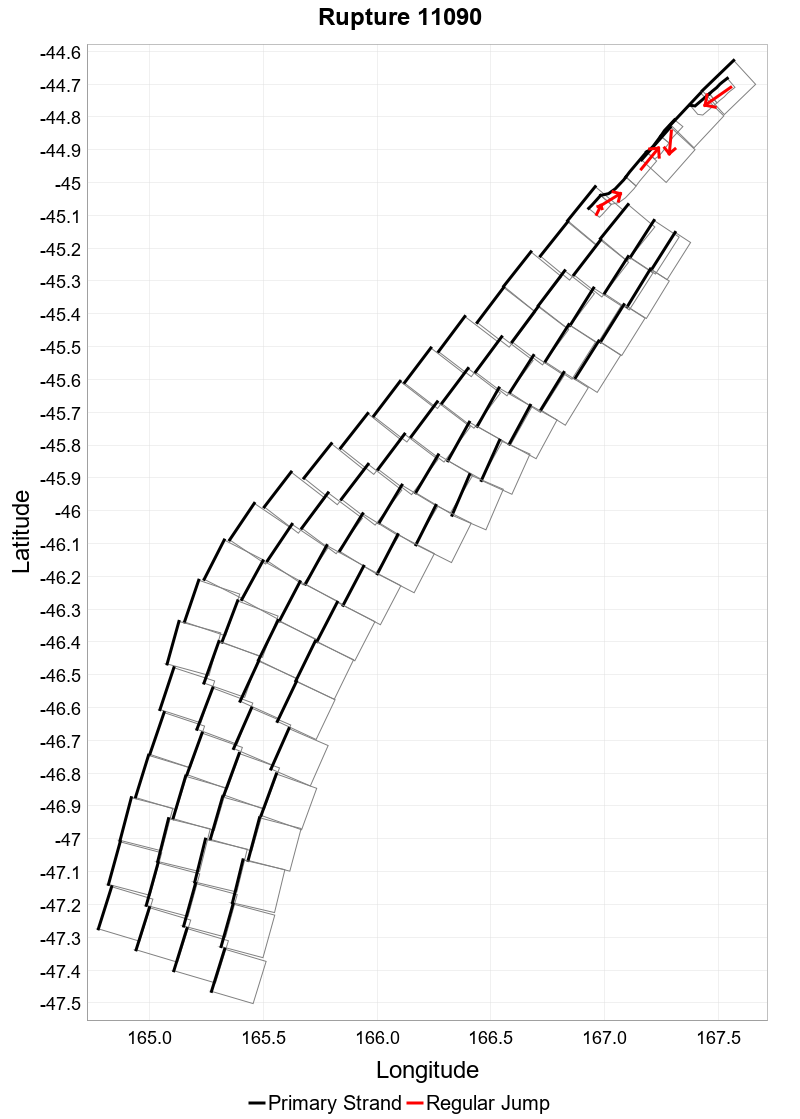
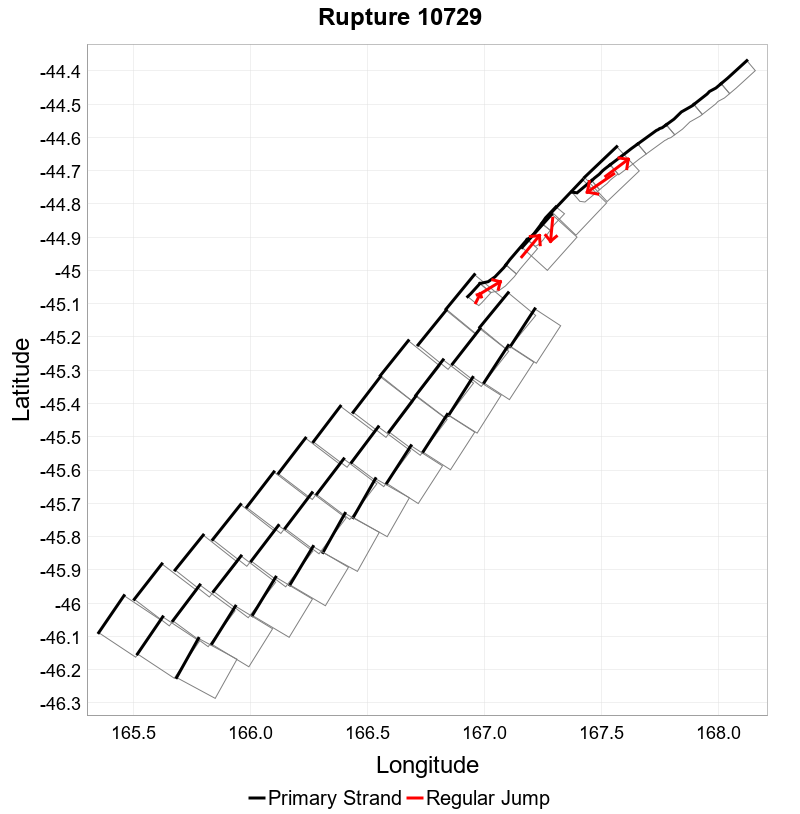
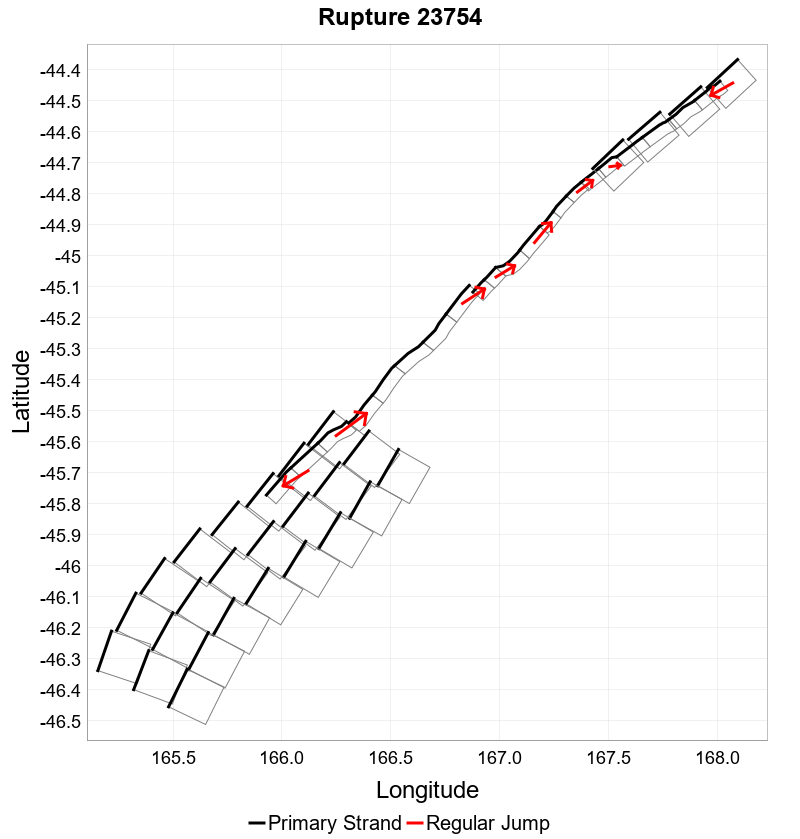
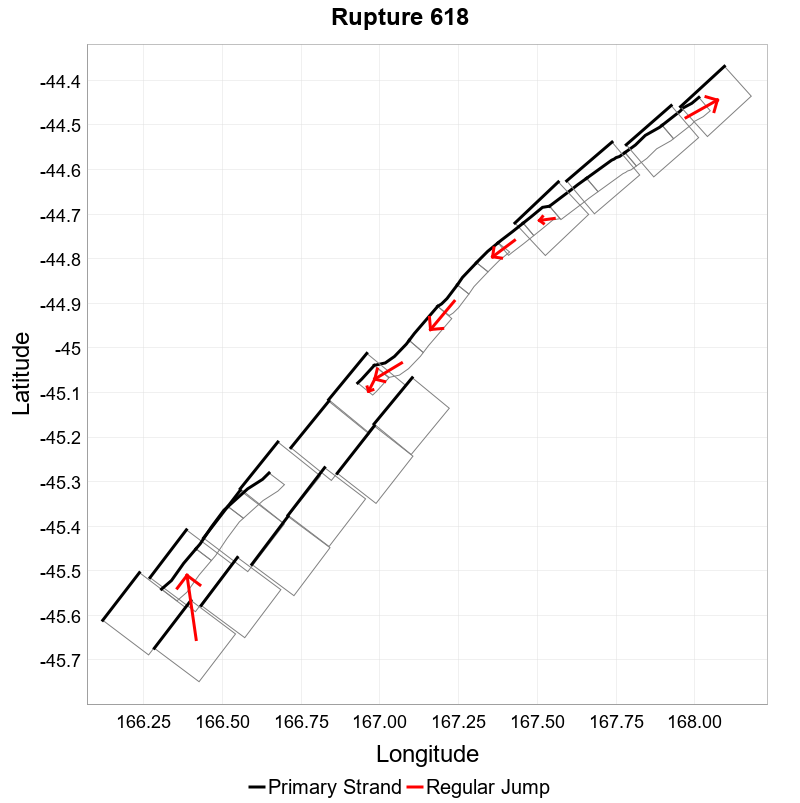
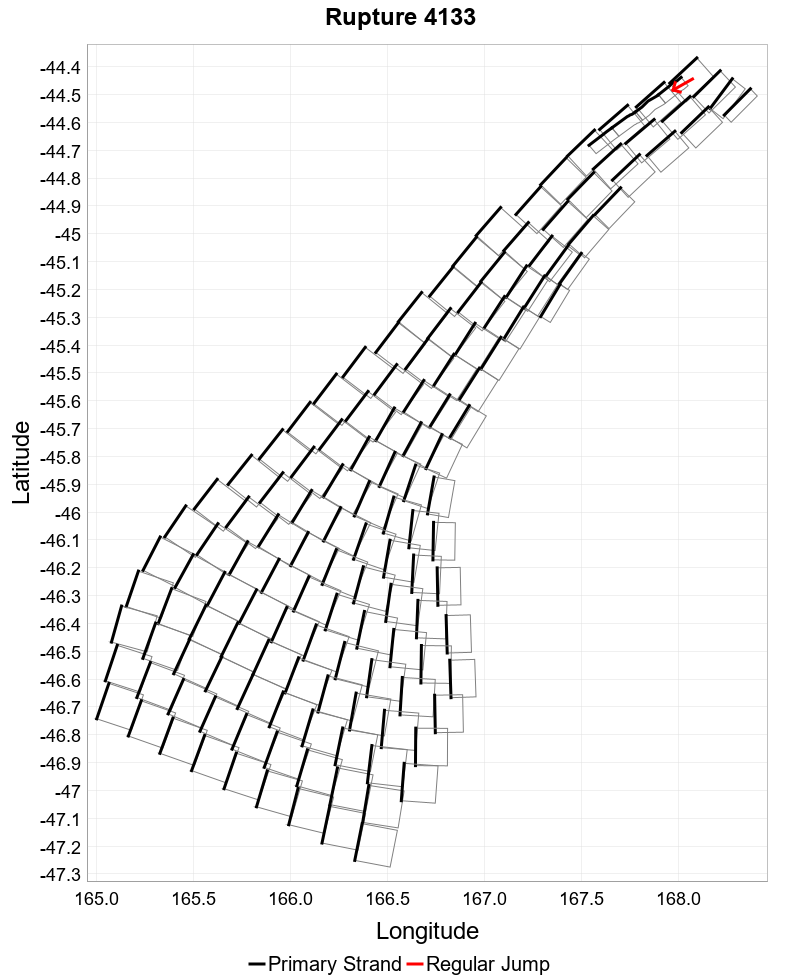
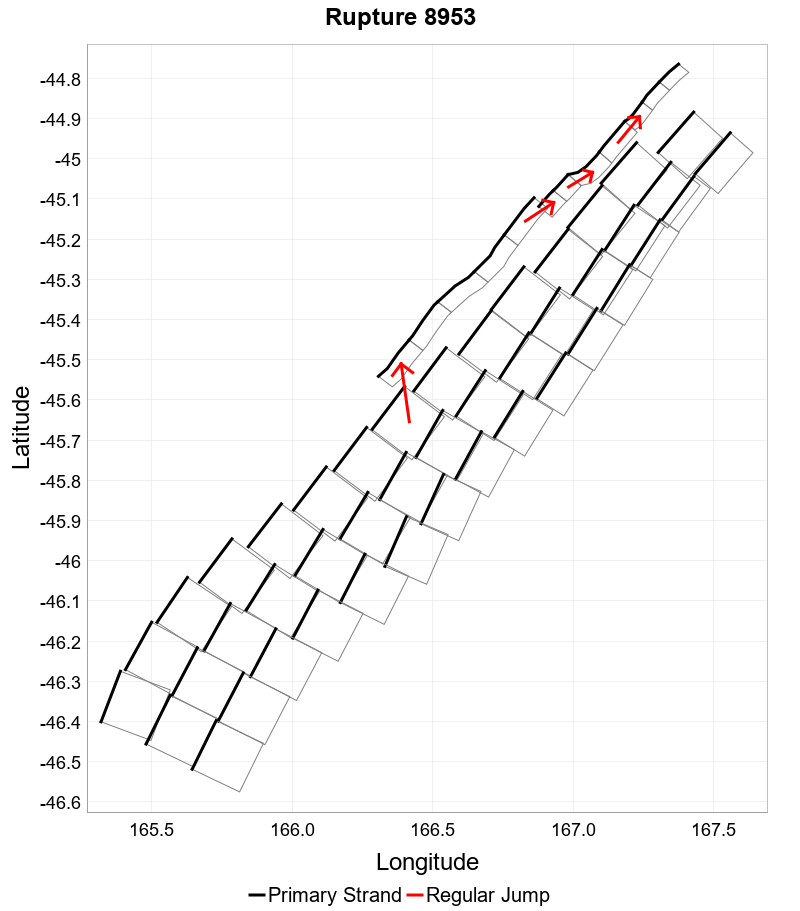
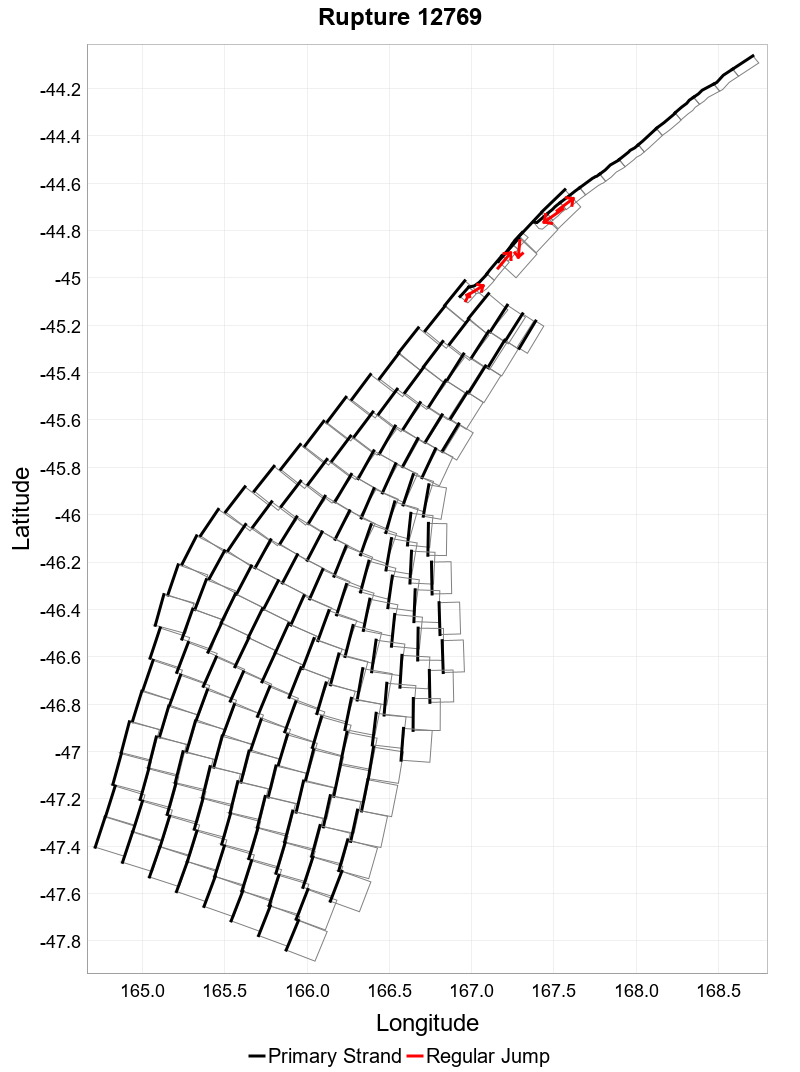
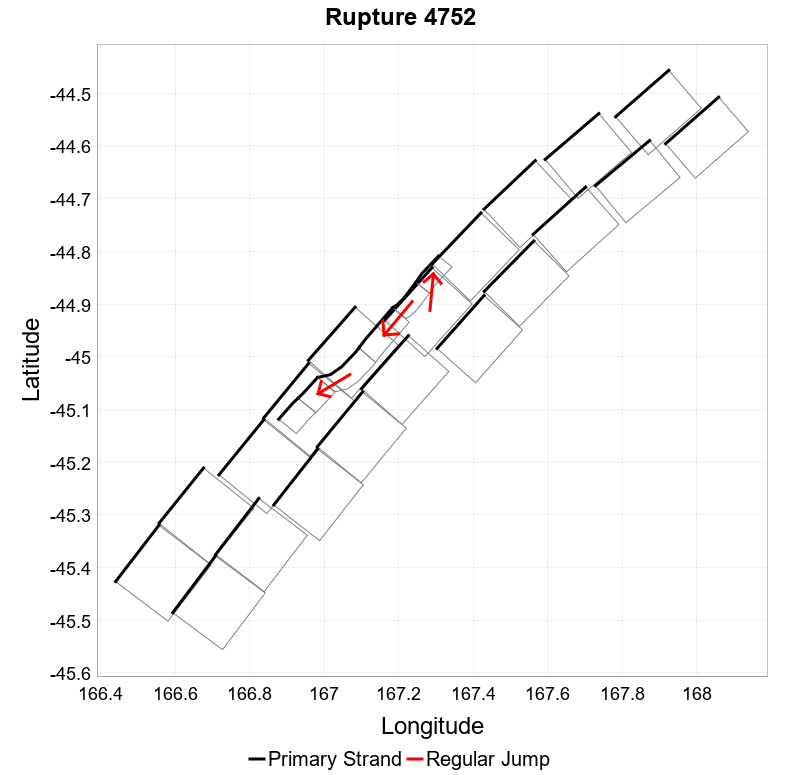
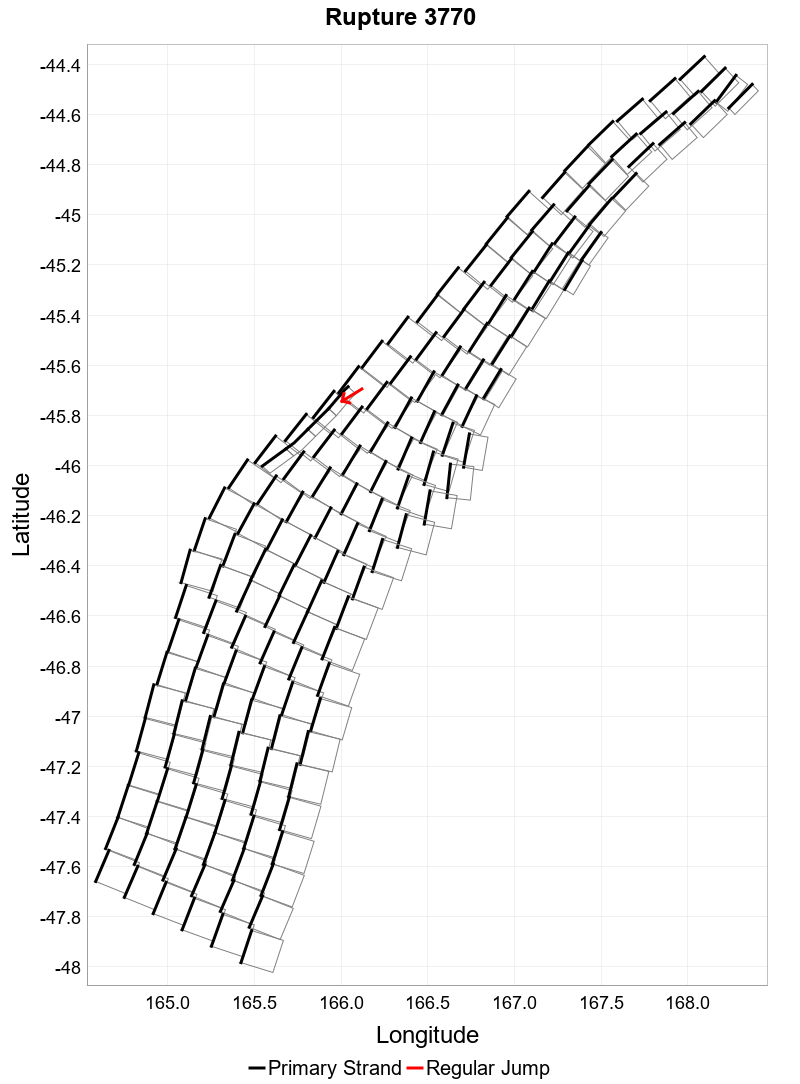
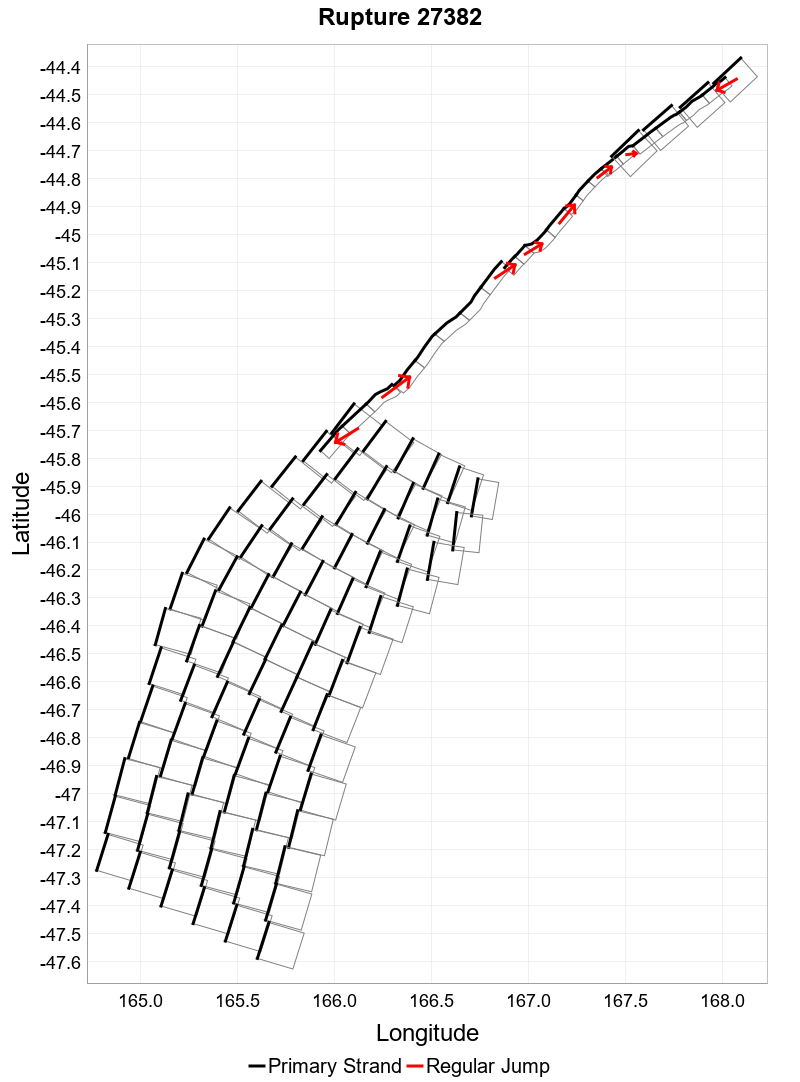
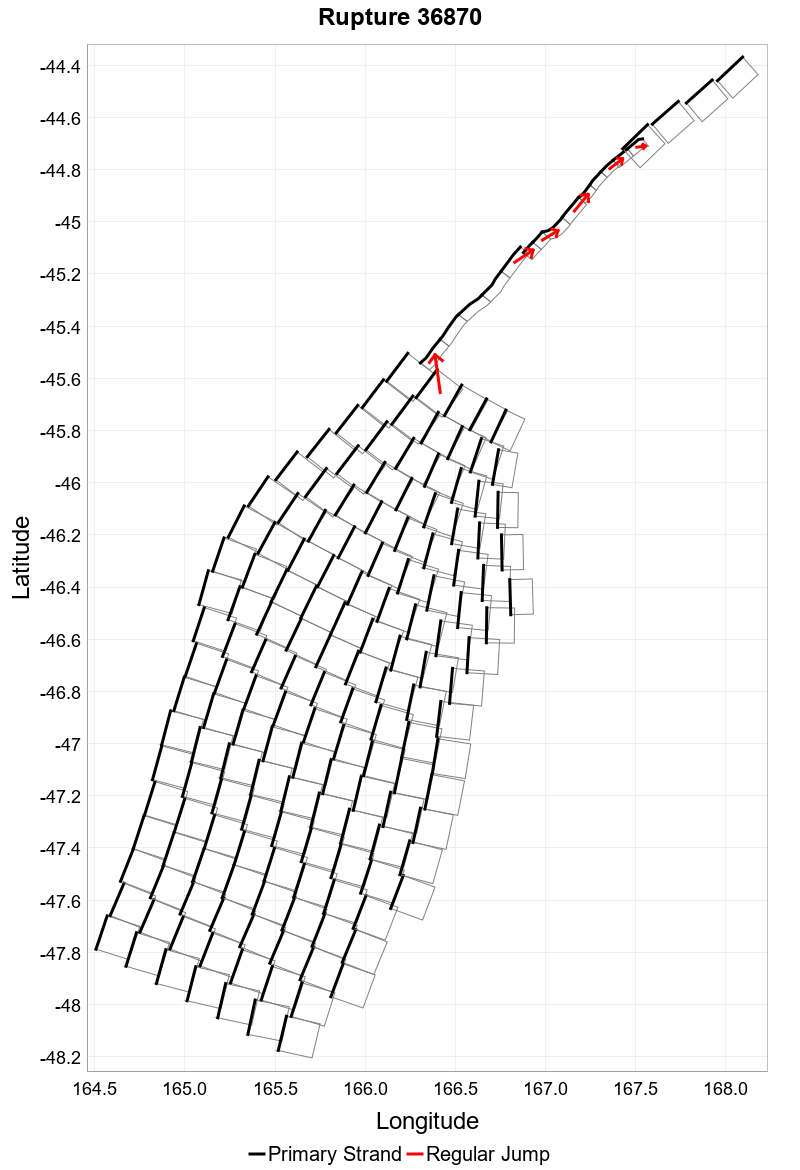
Rupture Length Extremes & Examples
(top)
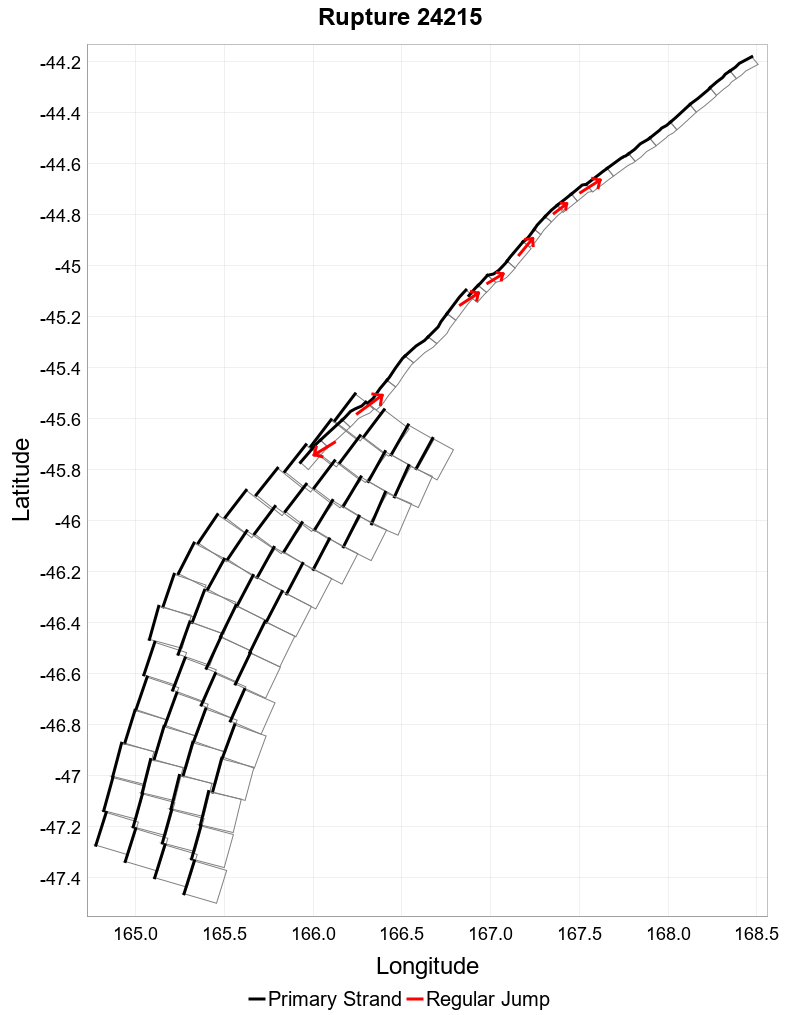
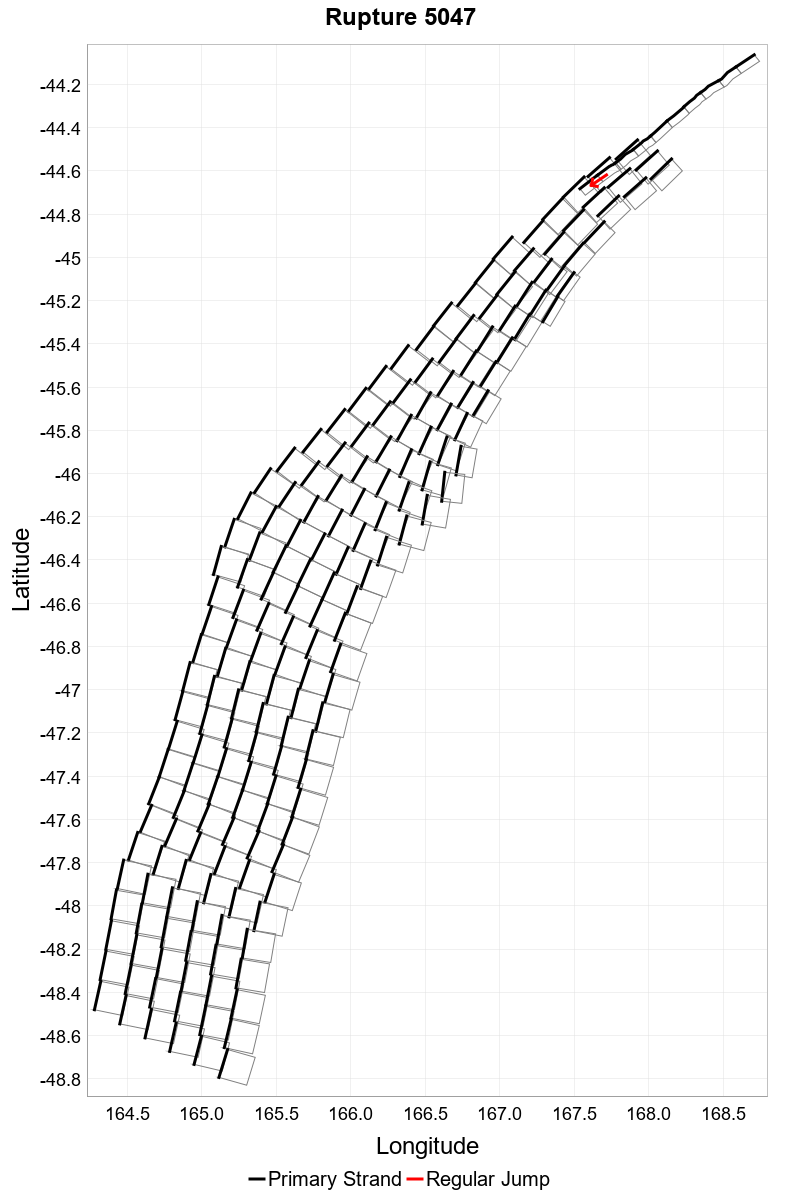
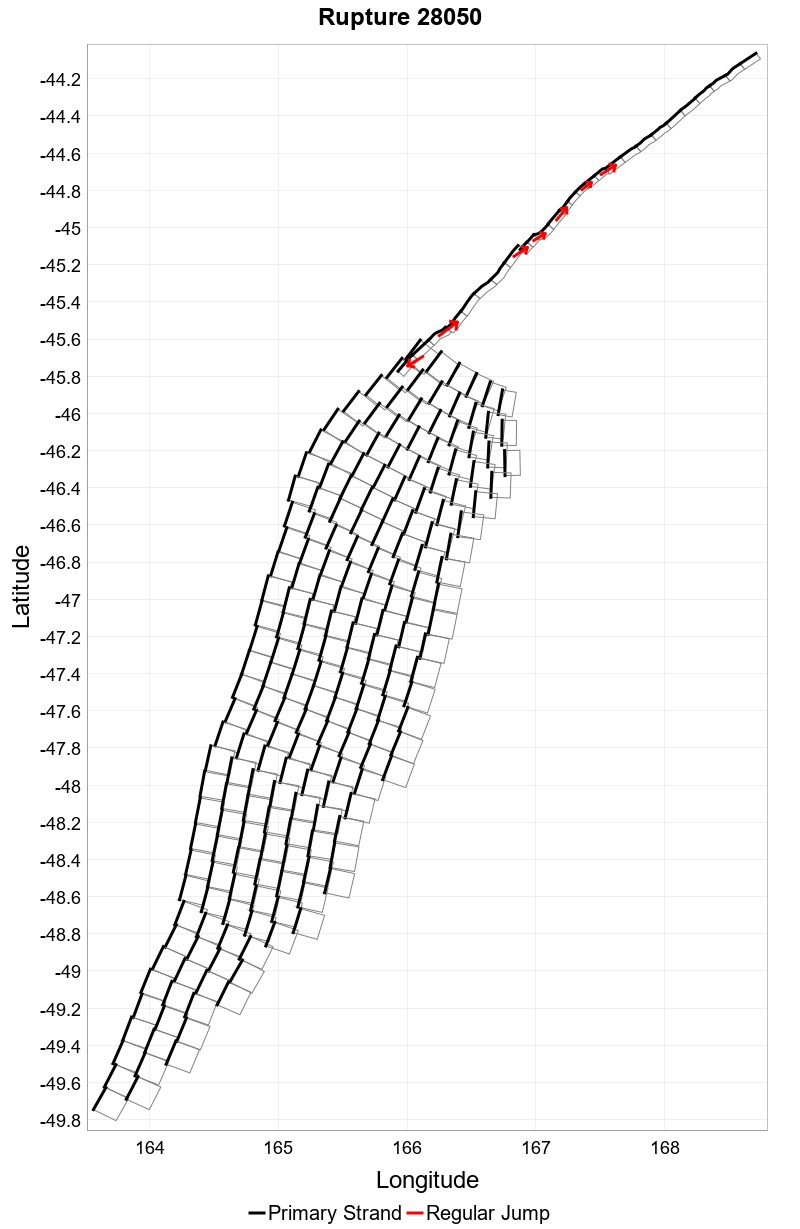
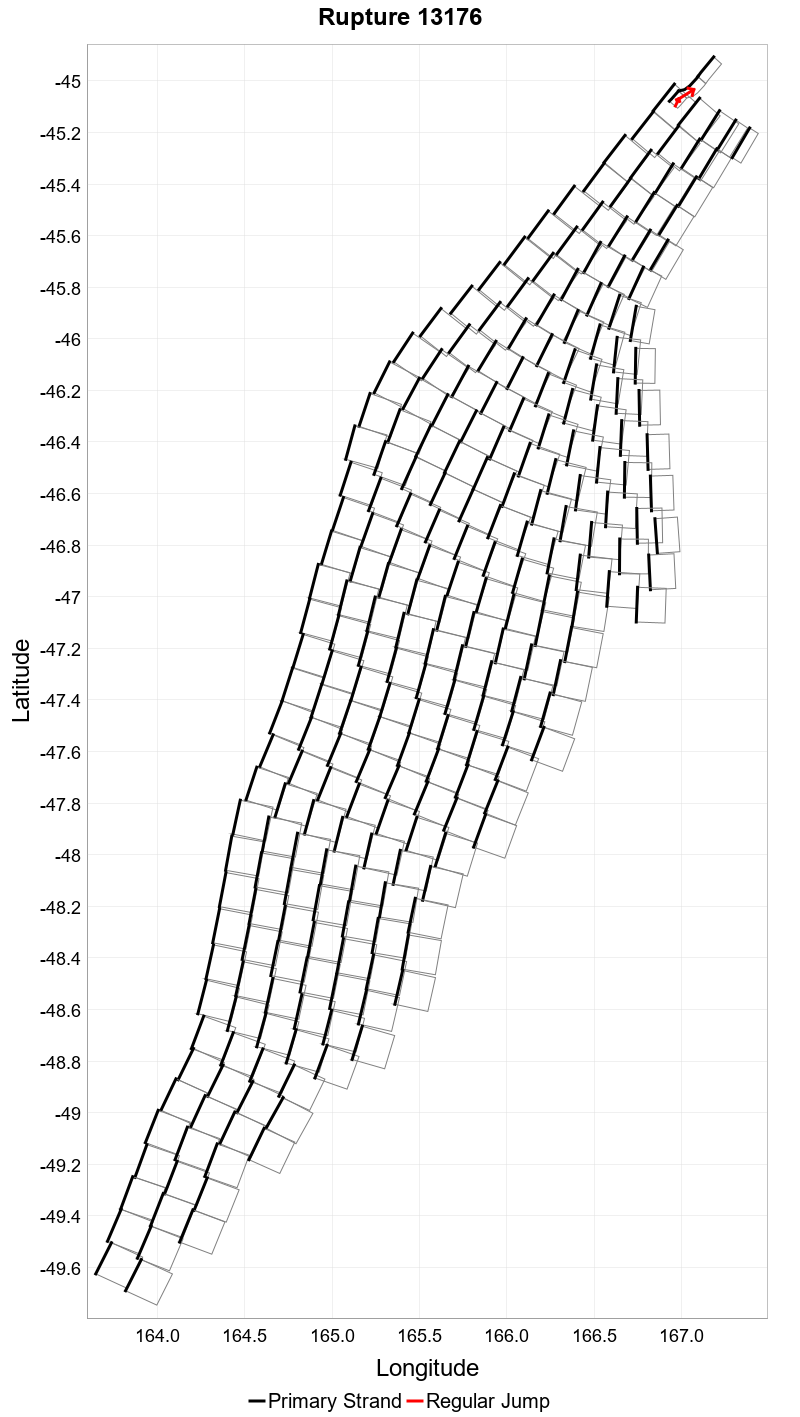
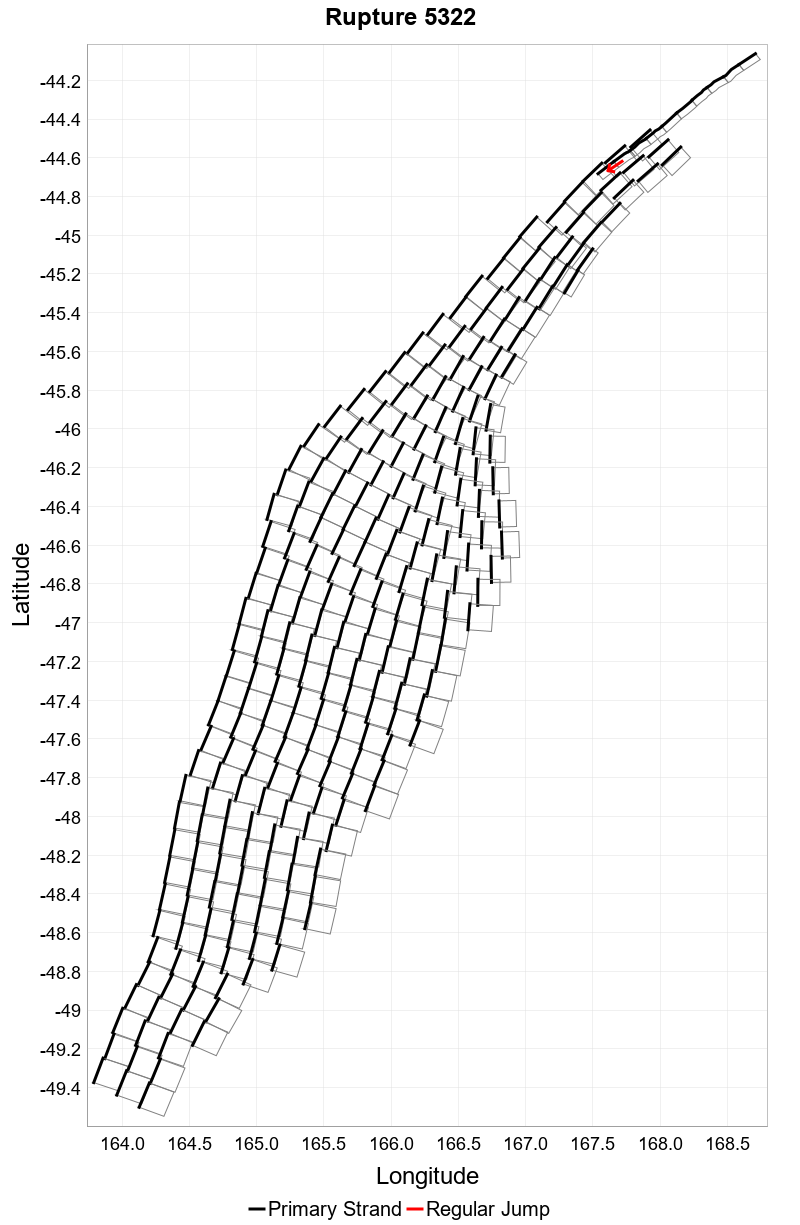
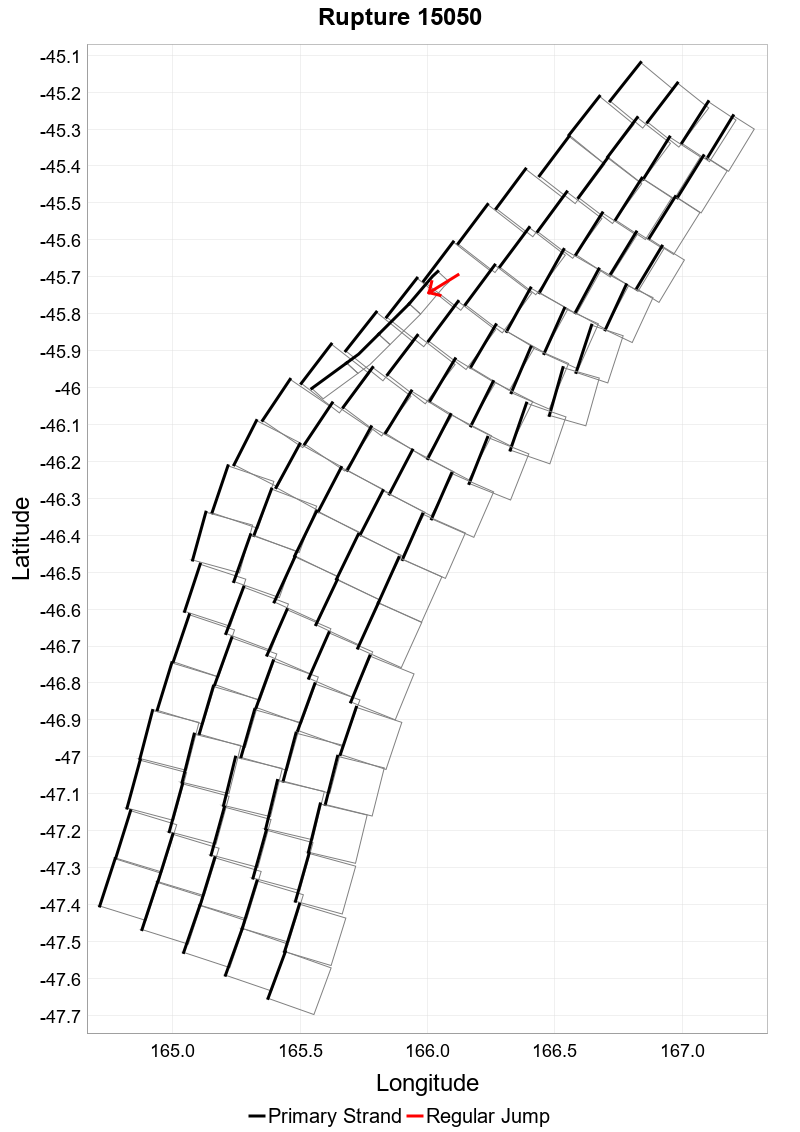
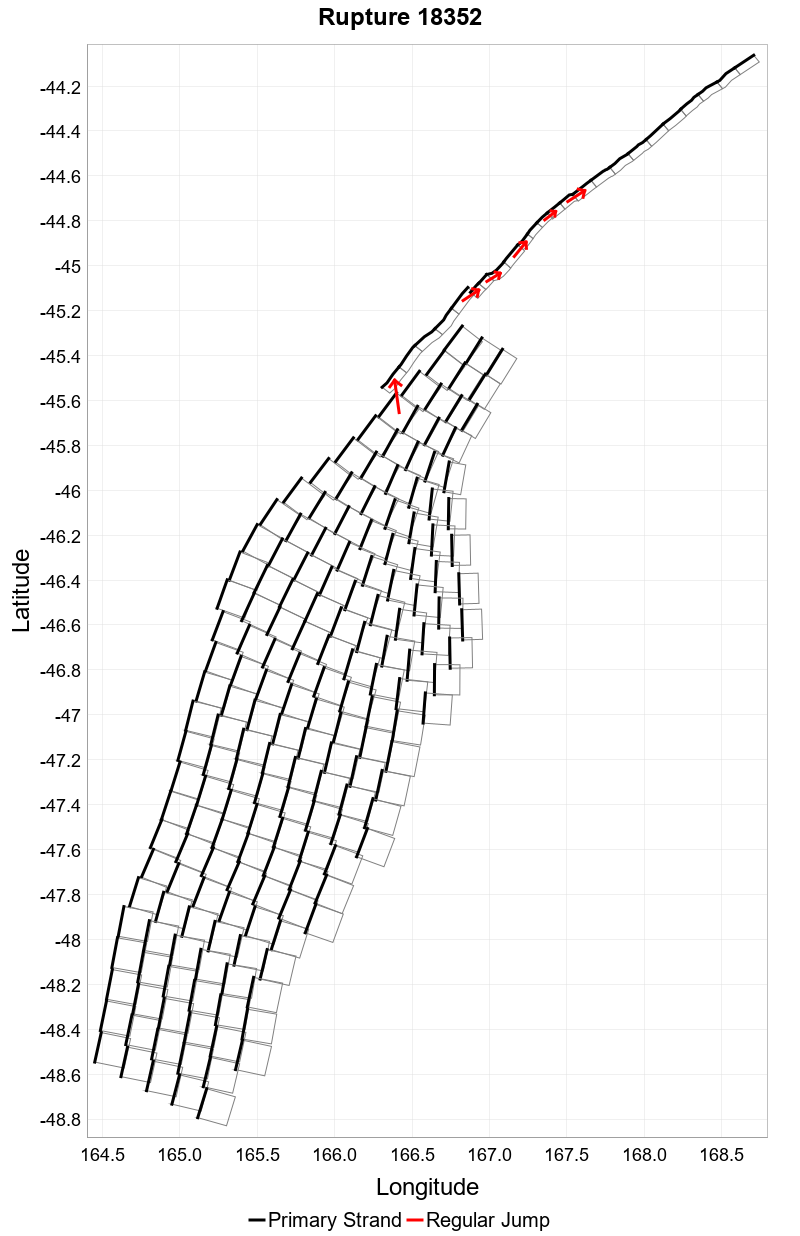
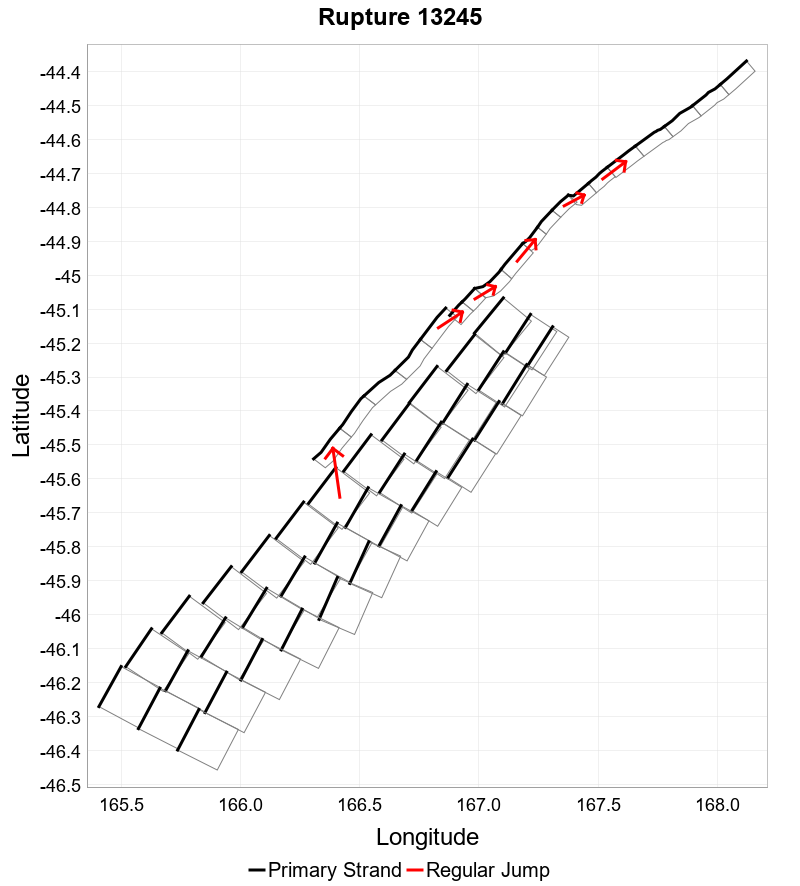
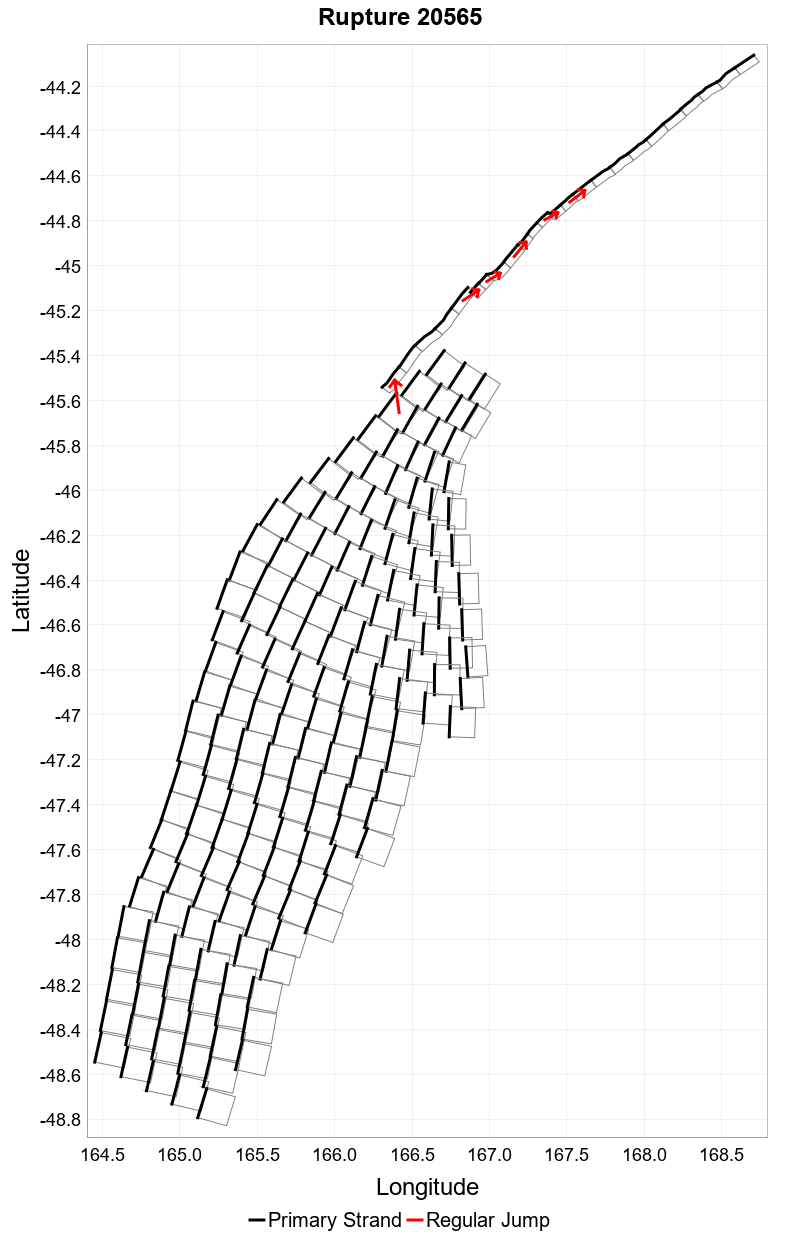
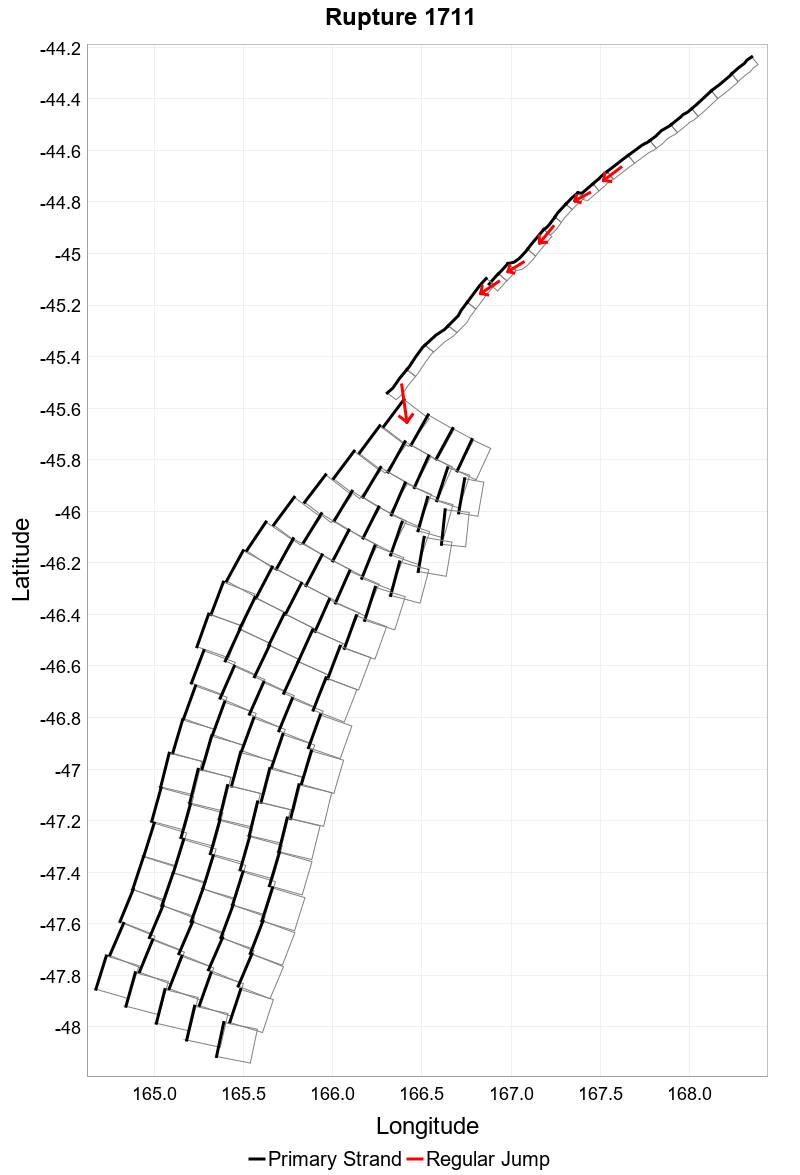
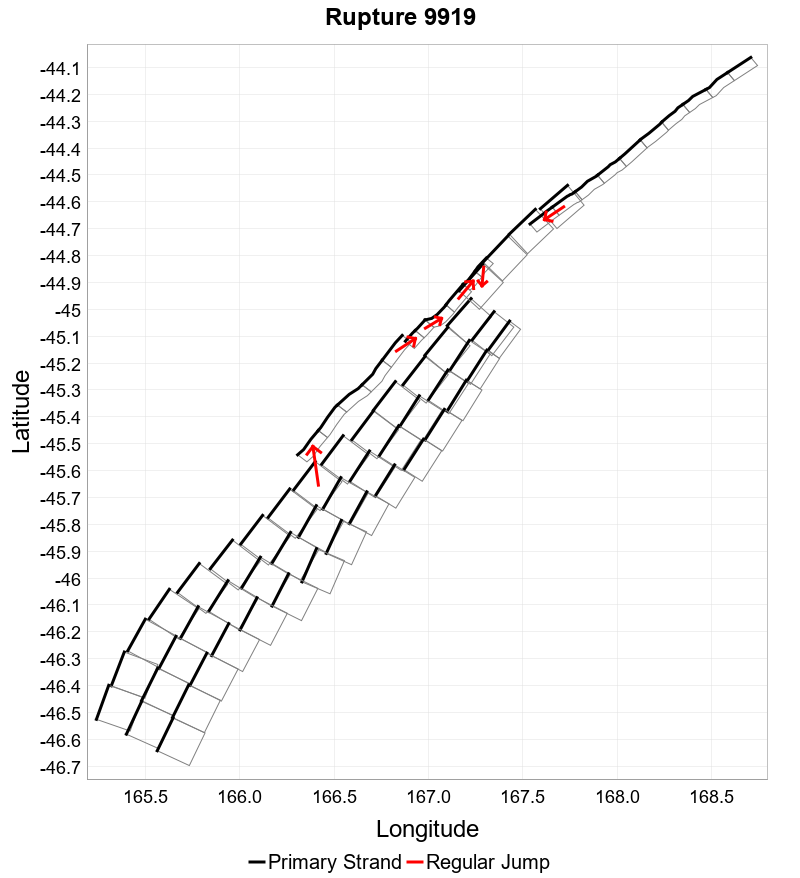
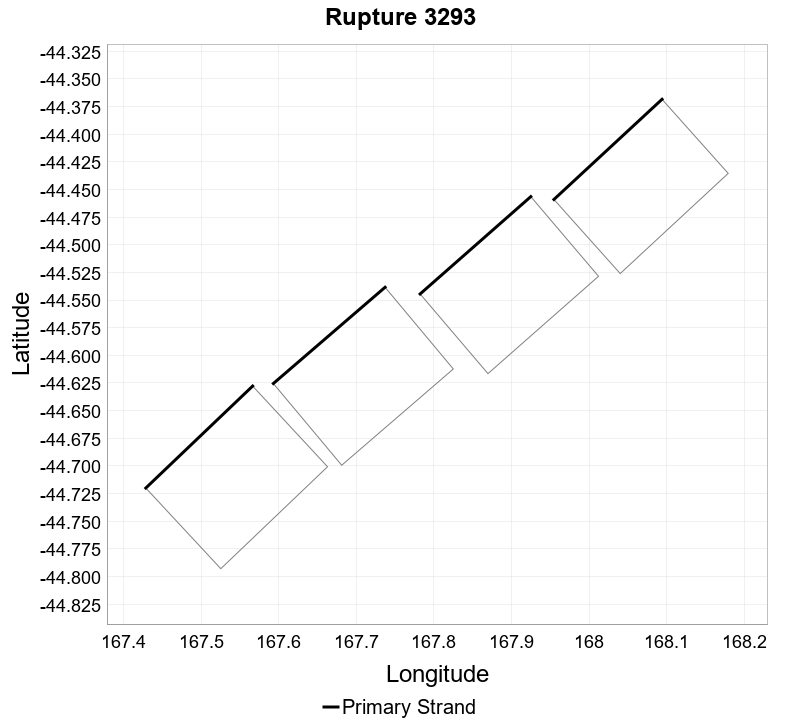
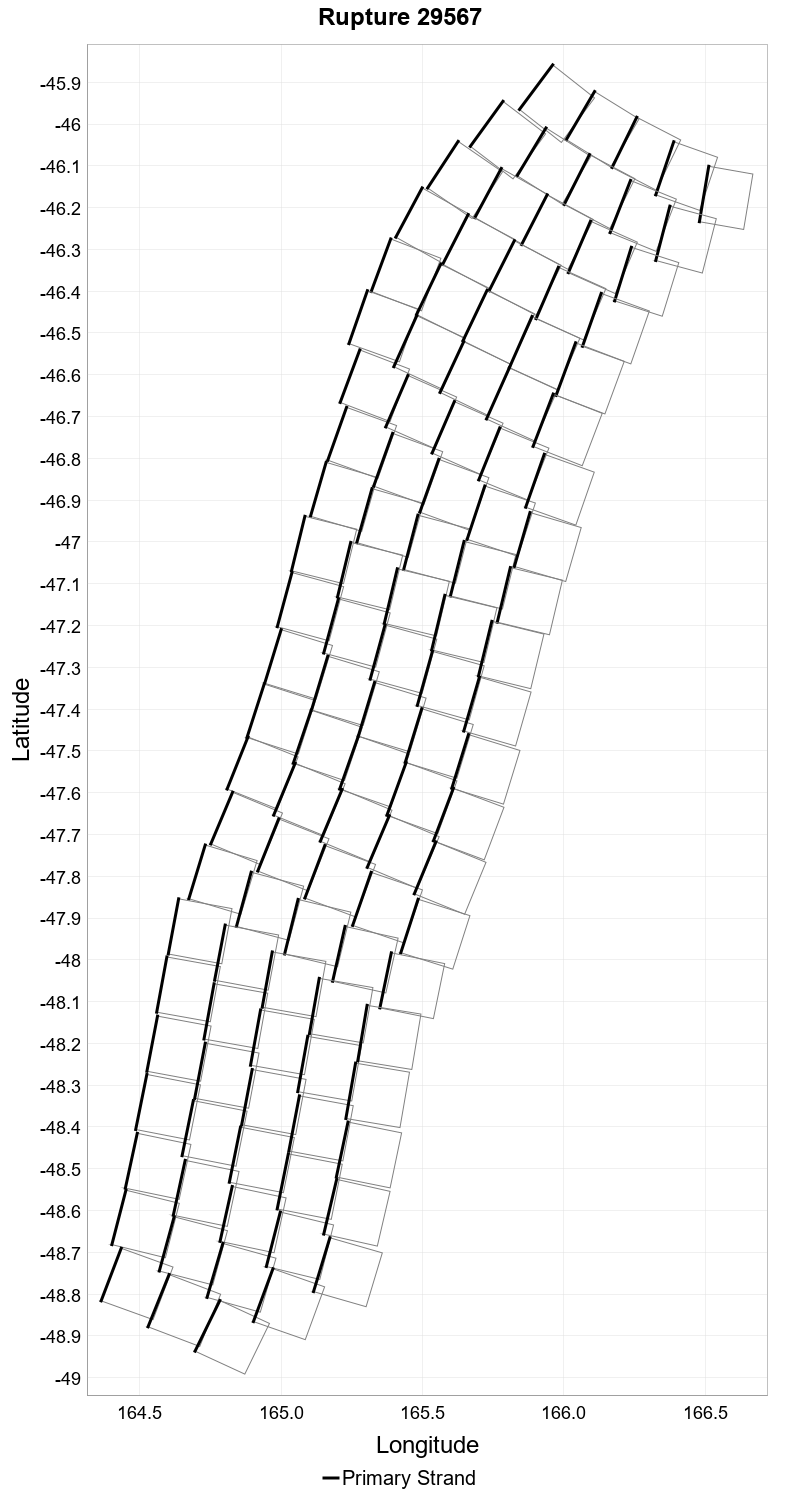
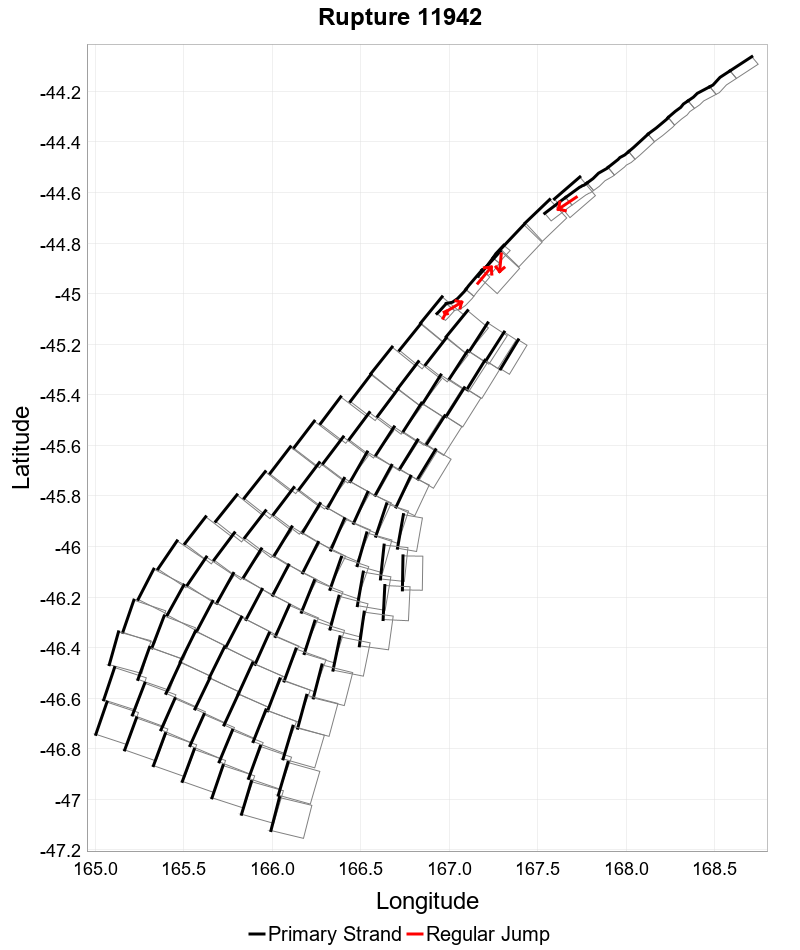
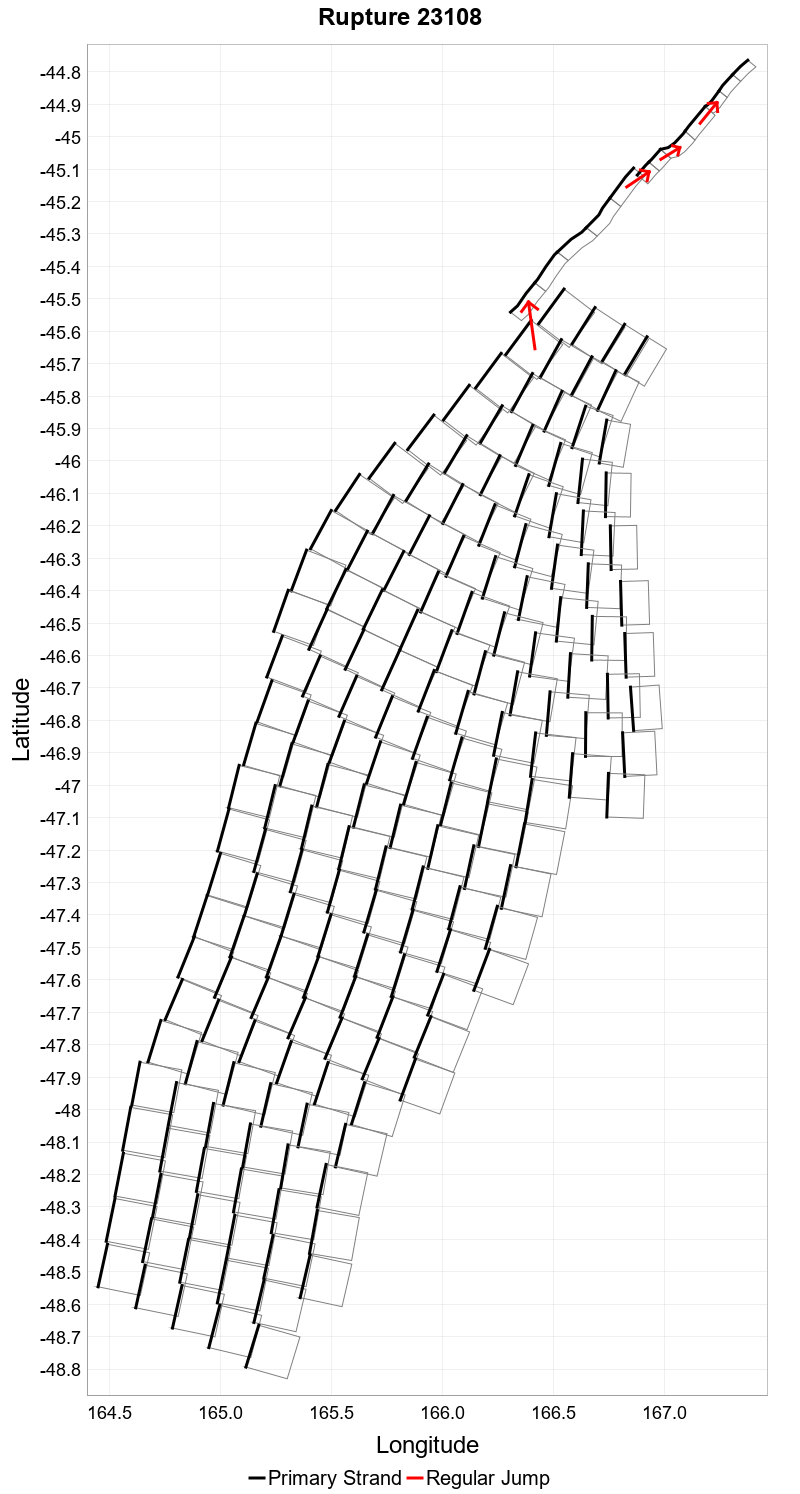
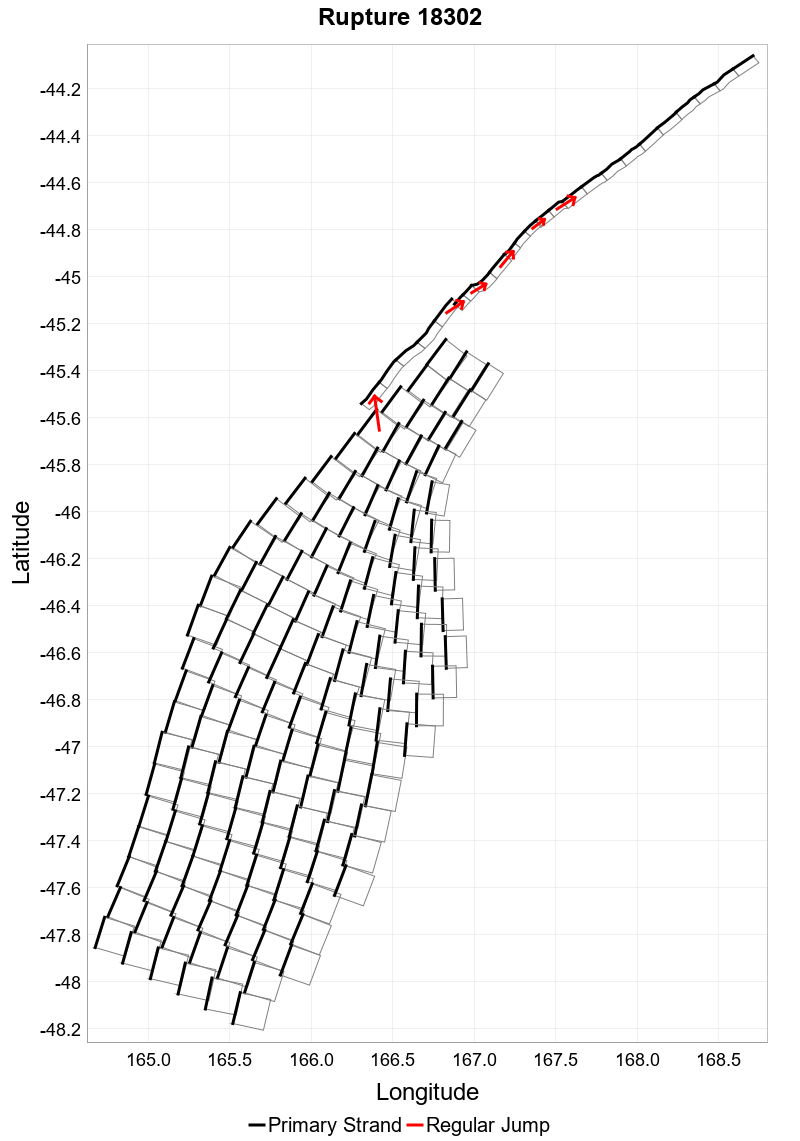
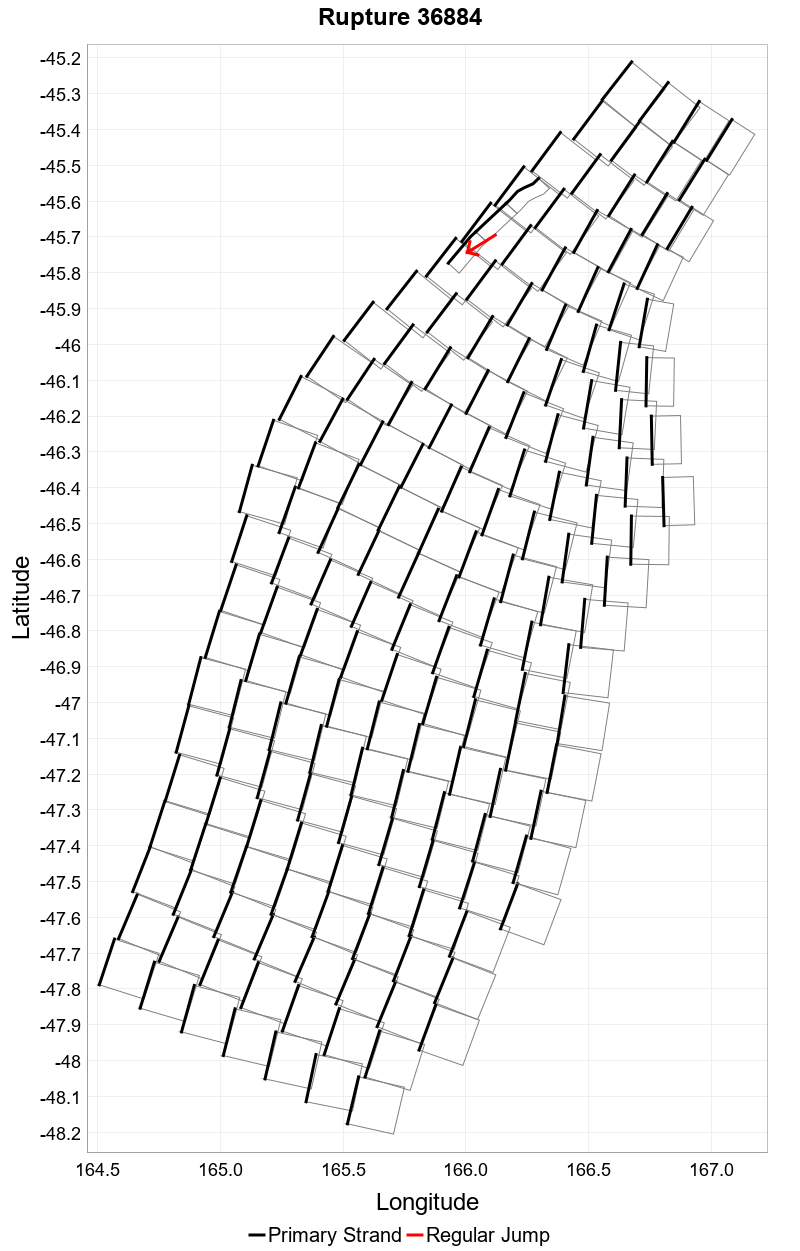
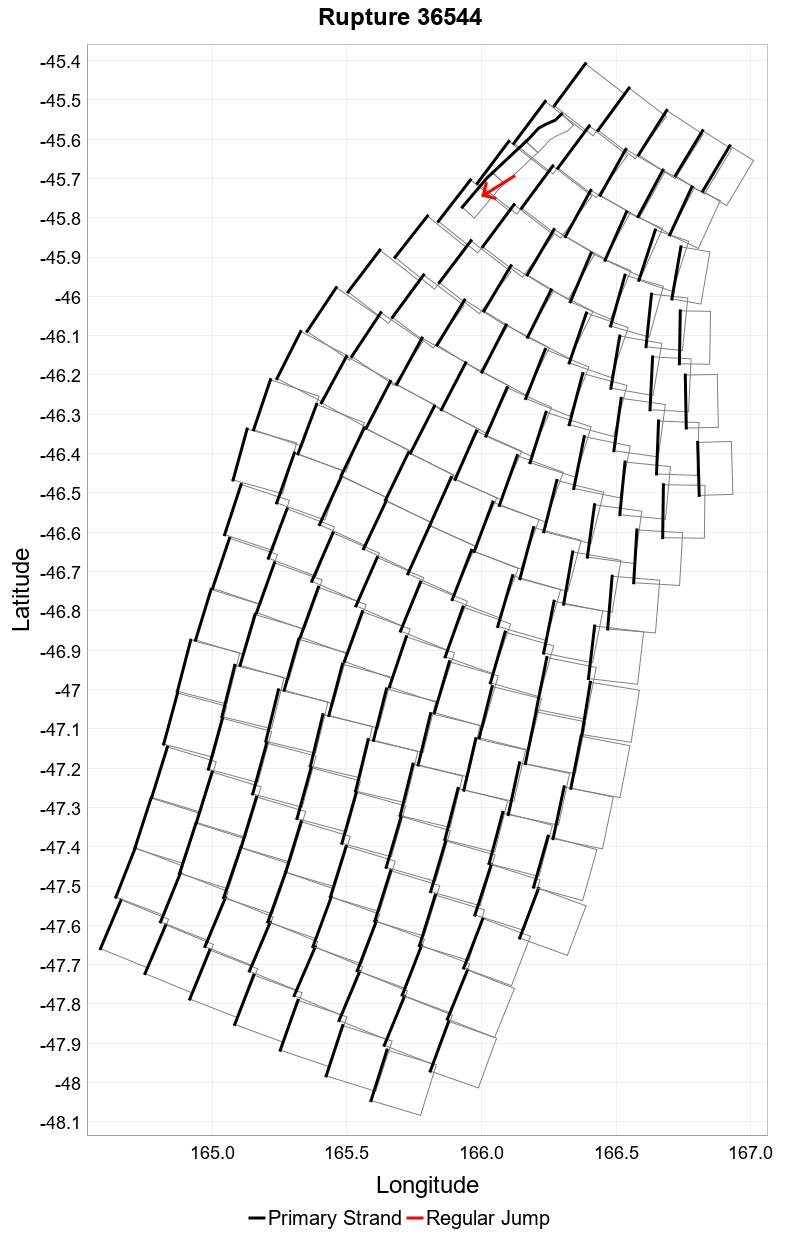
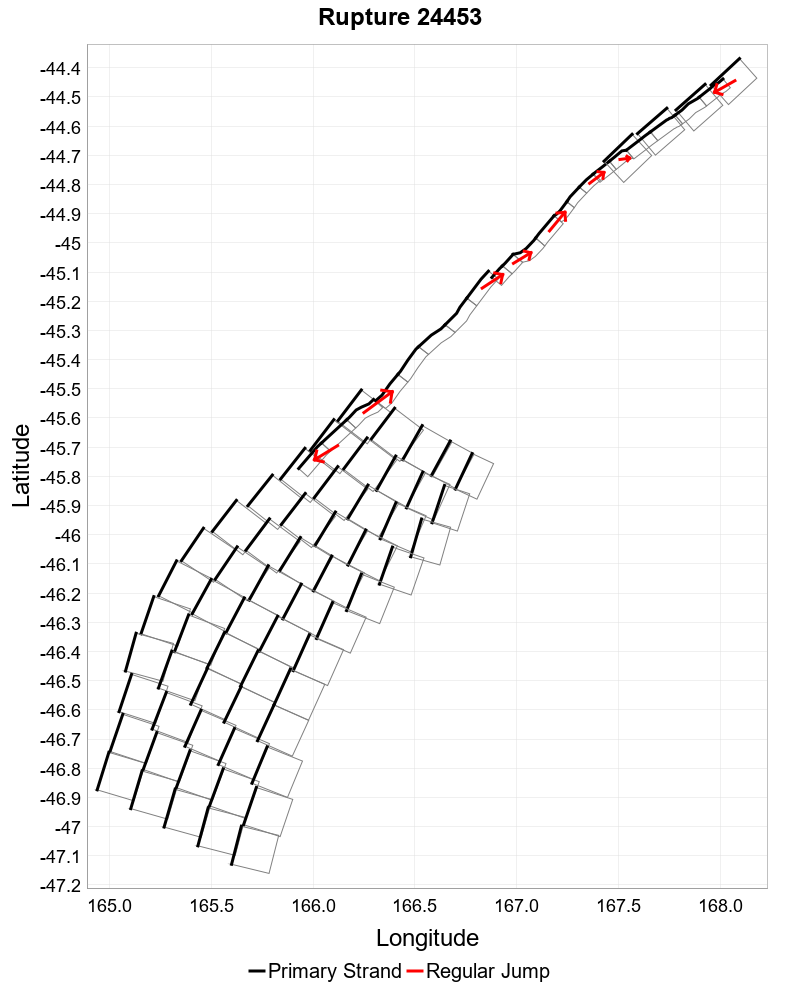
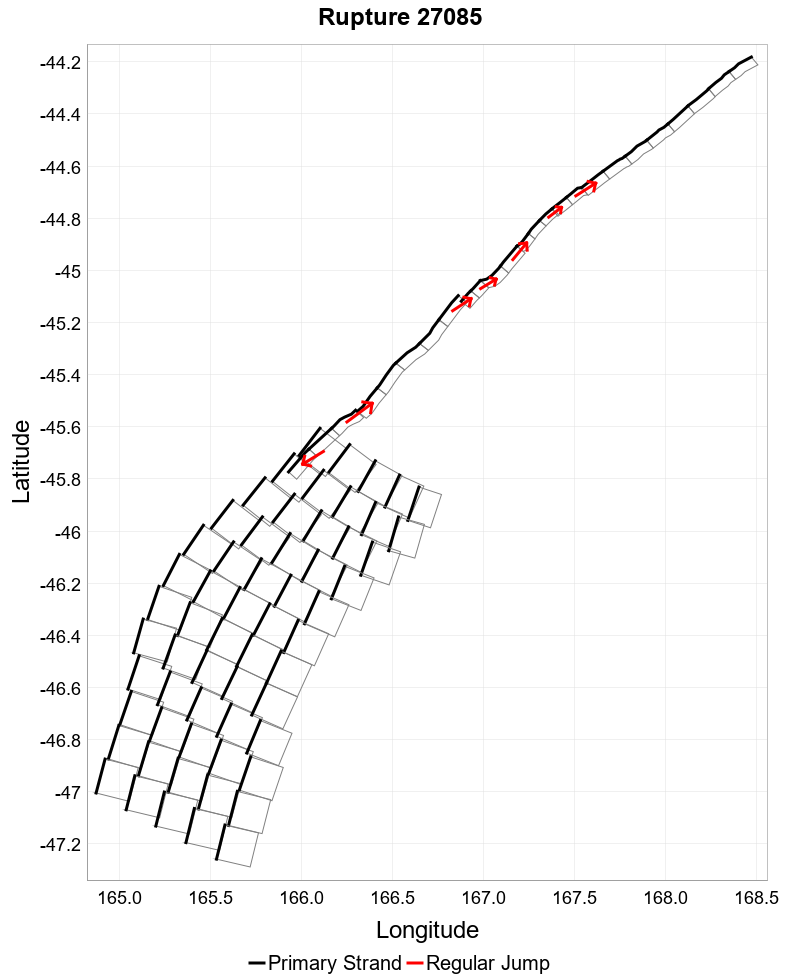
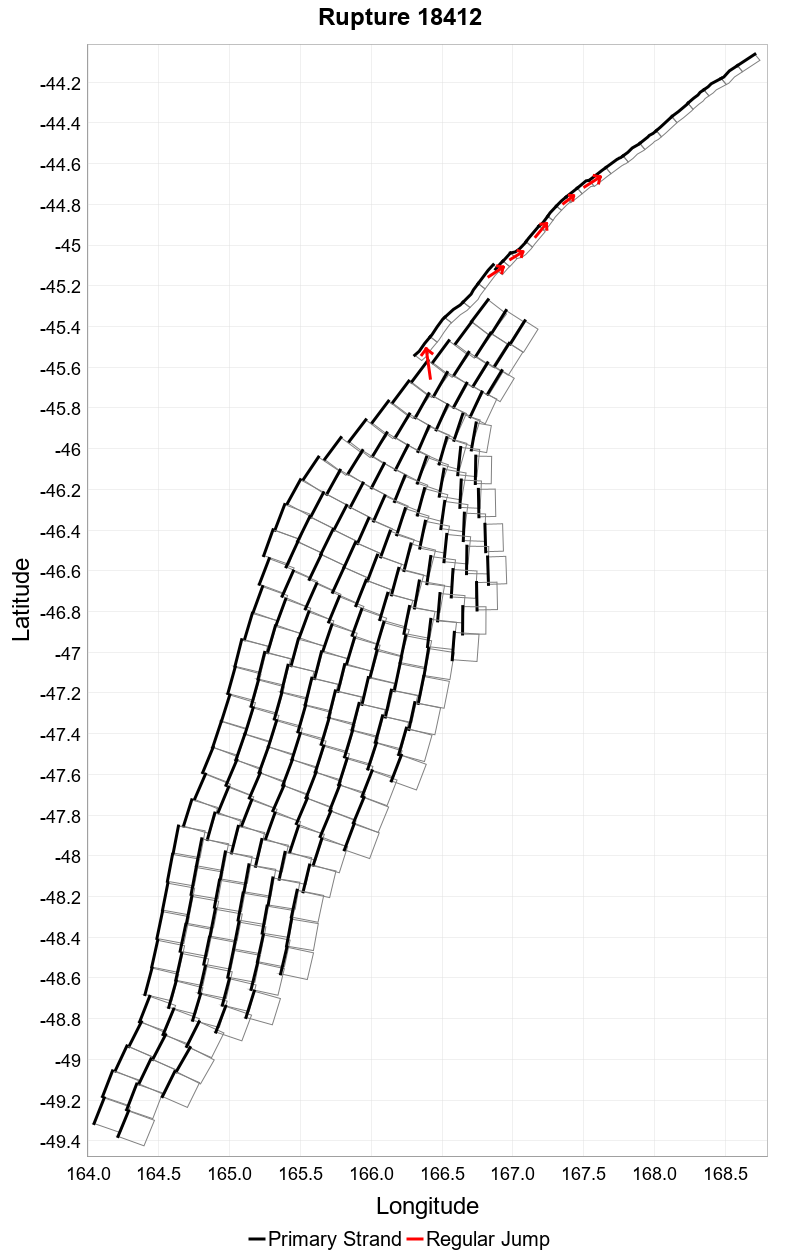
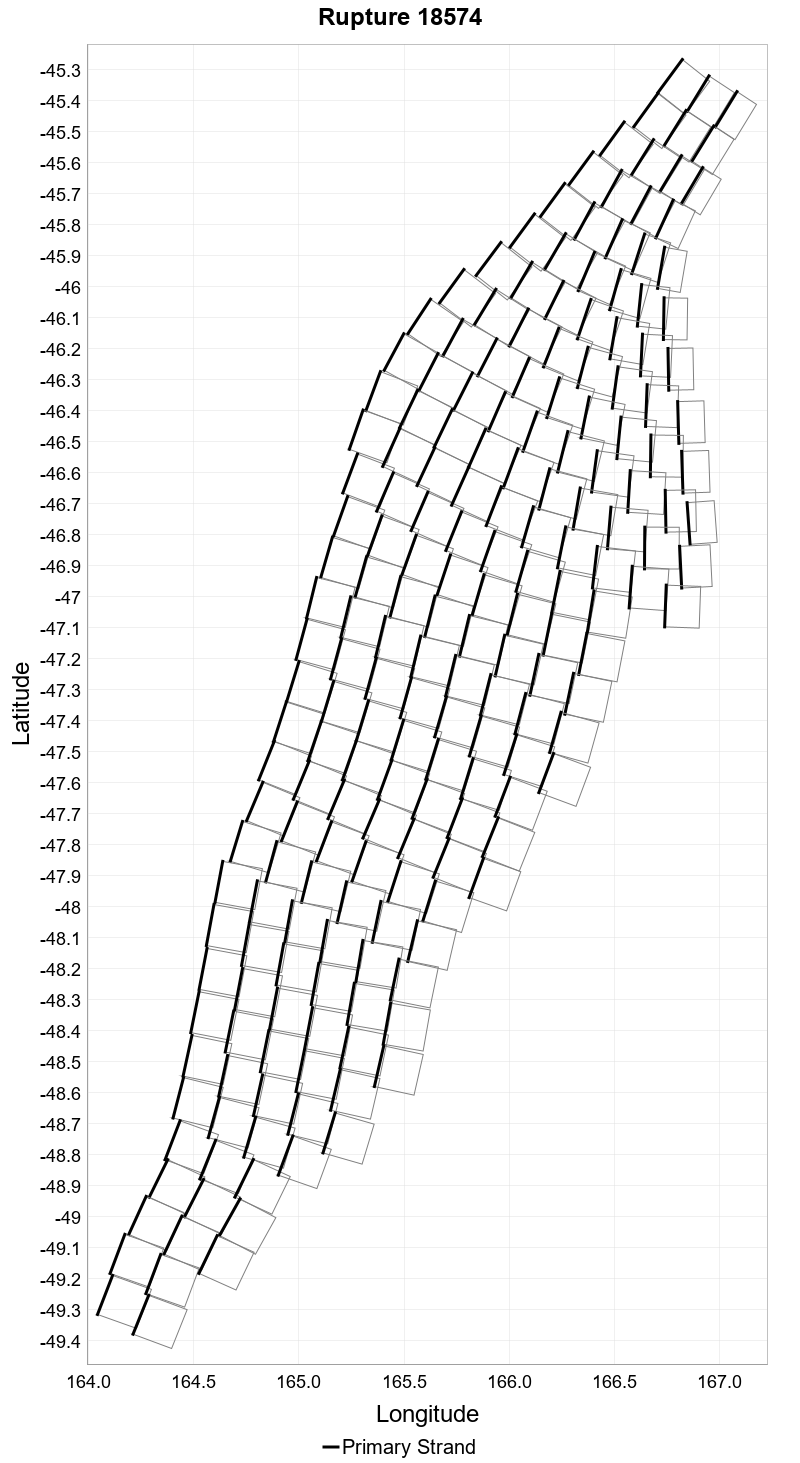
Example ruptures at various percentiles of Rupture Length
| Minimum: 10.02 | p50: 1304.17 | p90: 2894.15 | p95: 3139.6 |
|---|
 |  | 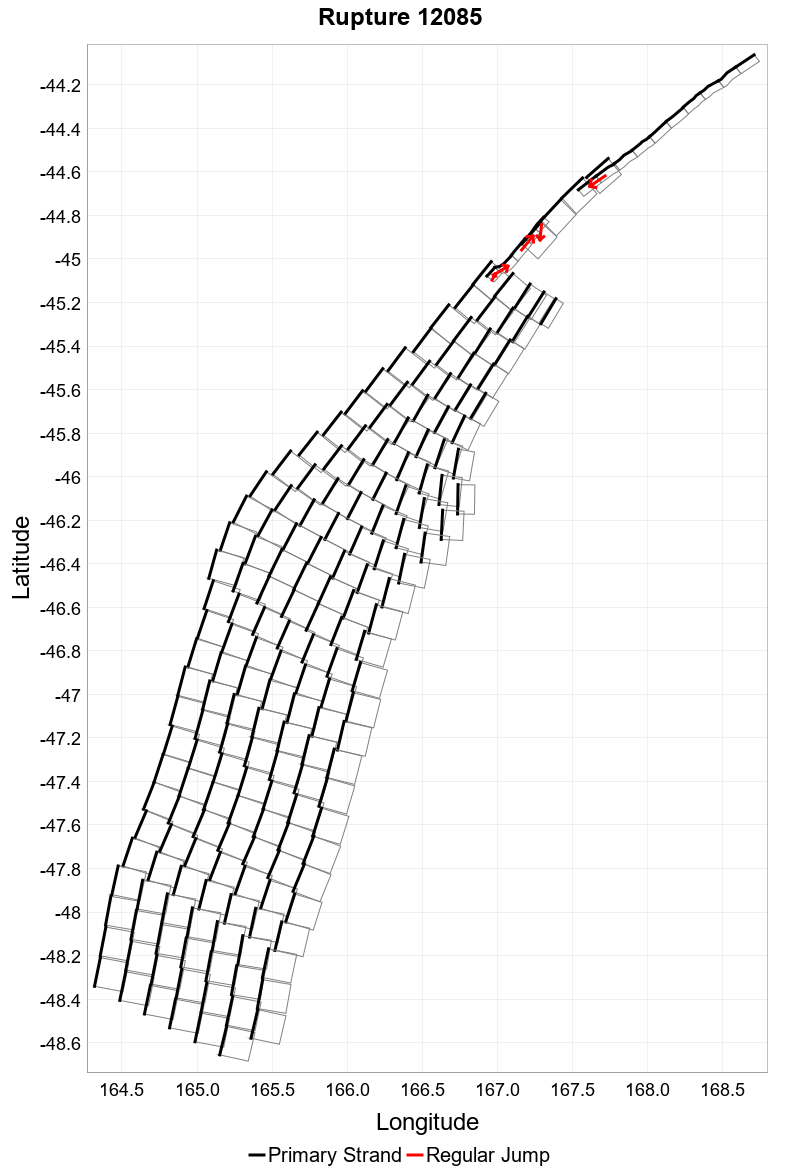 | 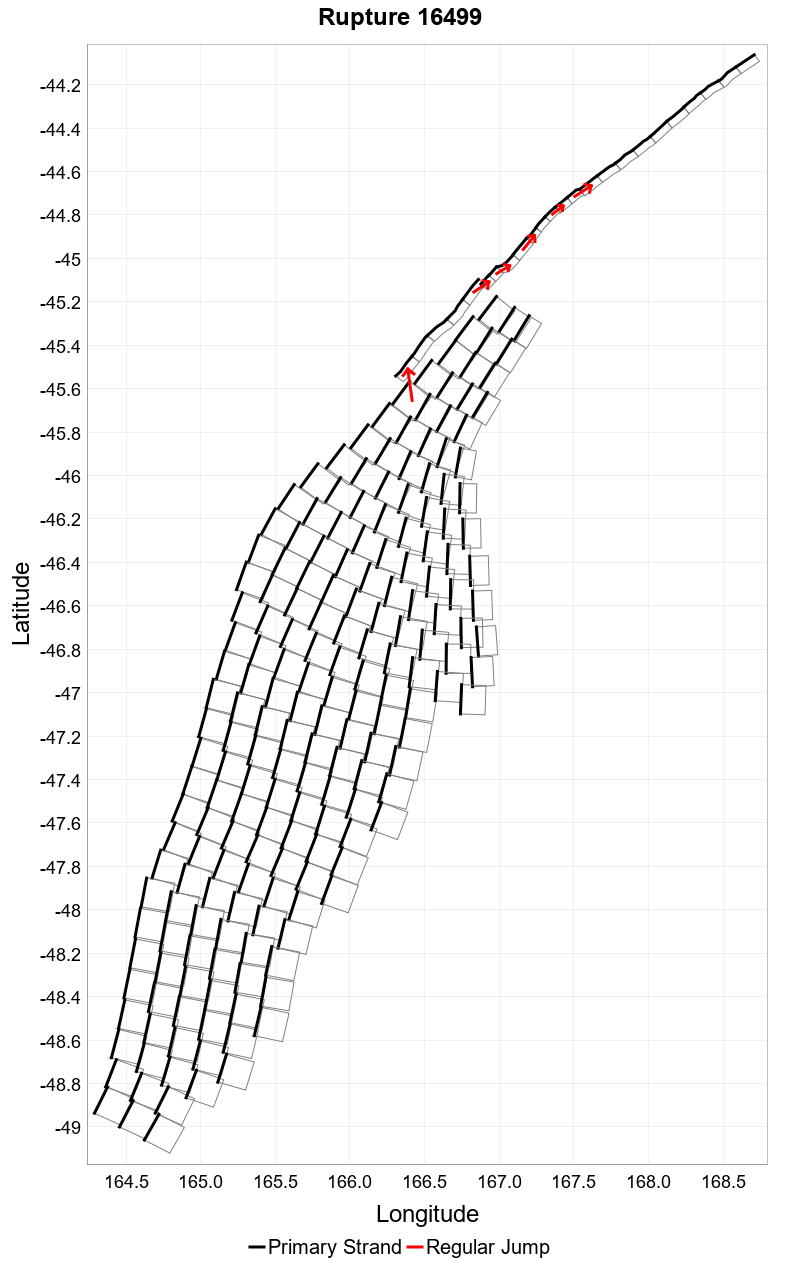 |
| p97.5: 3417.94 | p99: 3690.15 | p99.9: 4001.85 | Maximum: 4166.48 |
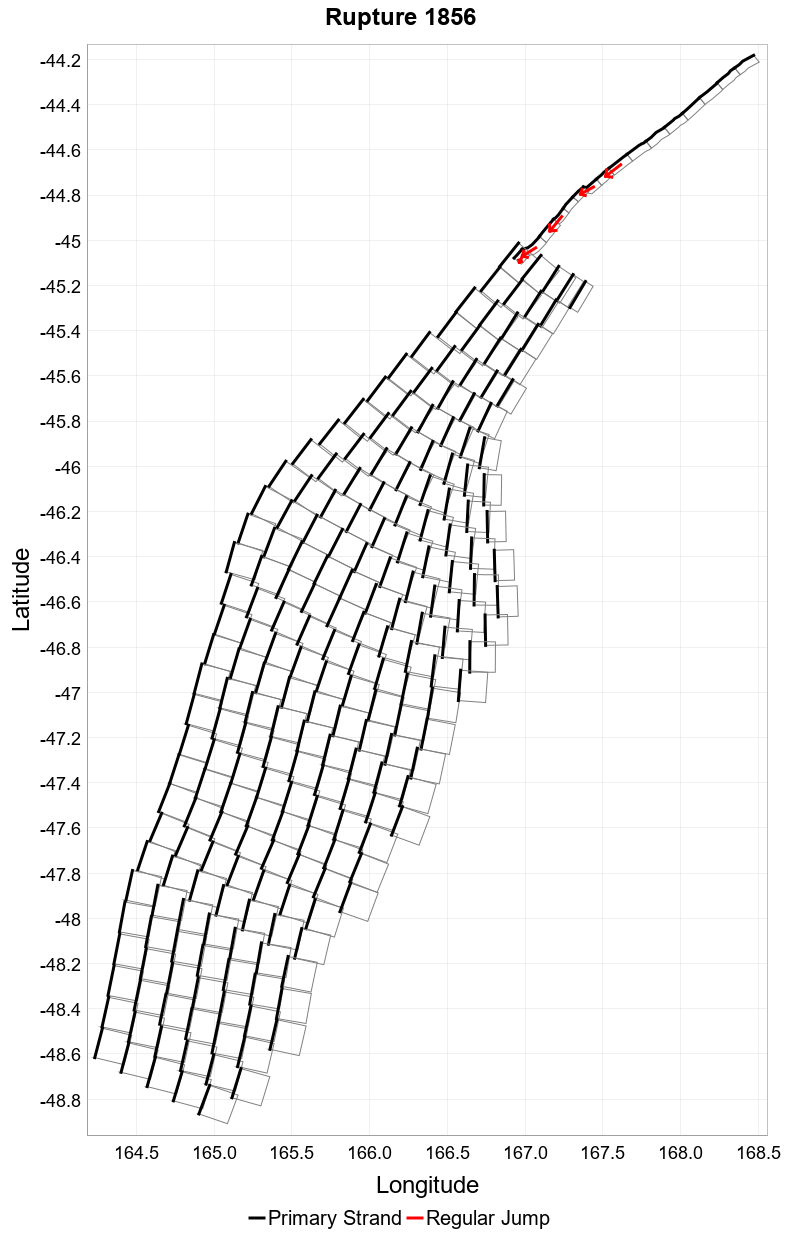 | 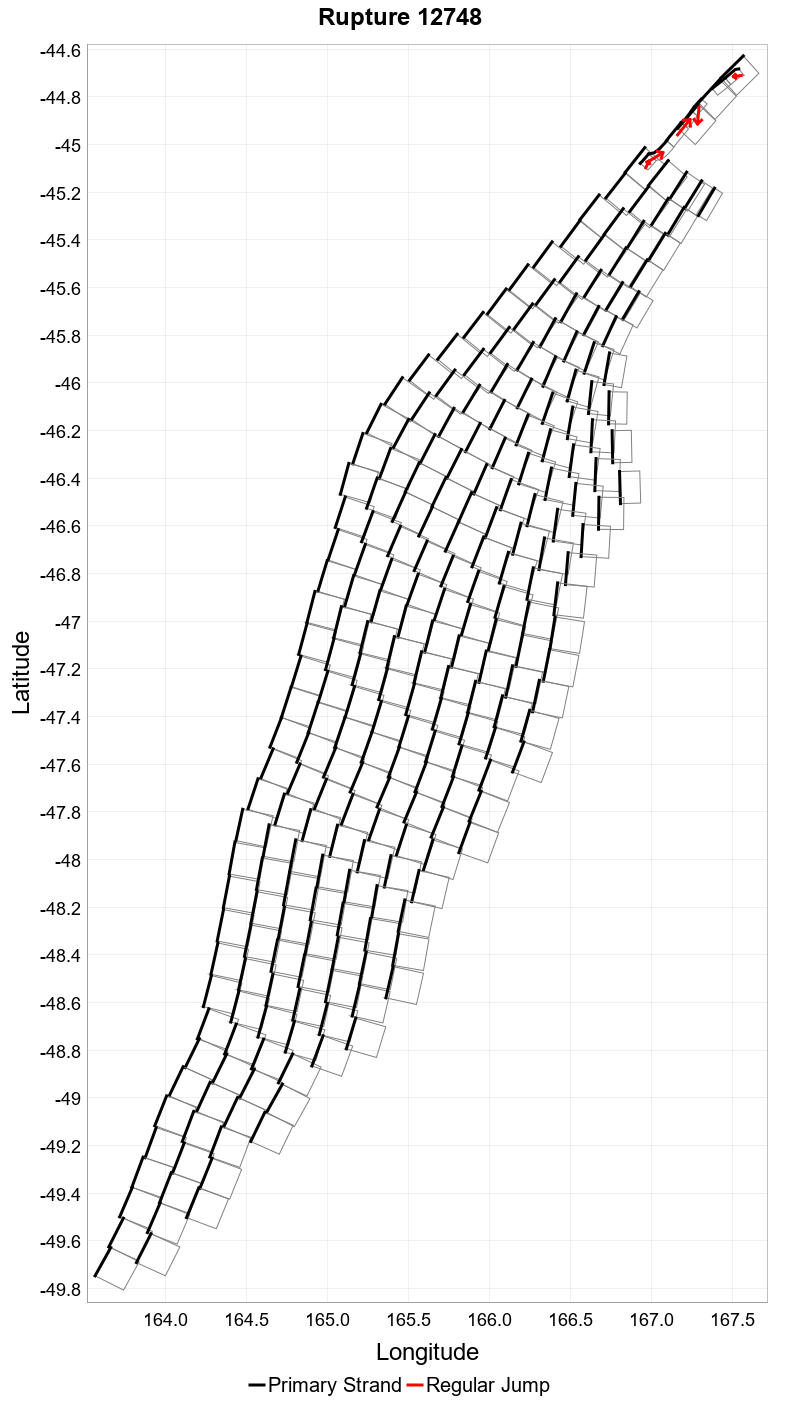 | 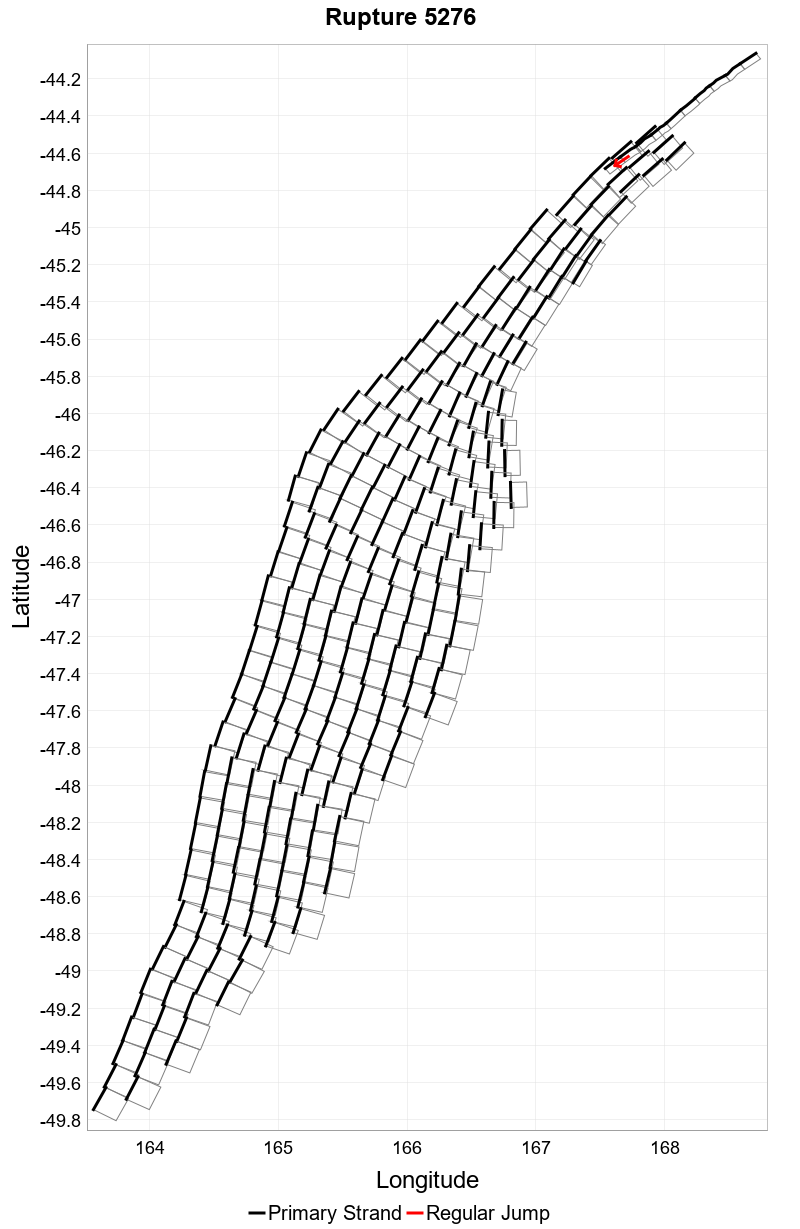 | 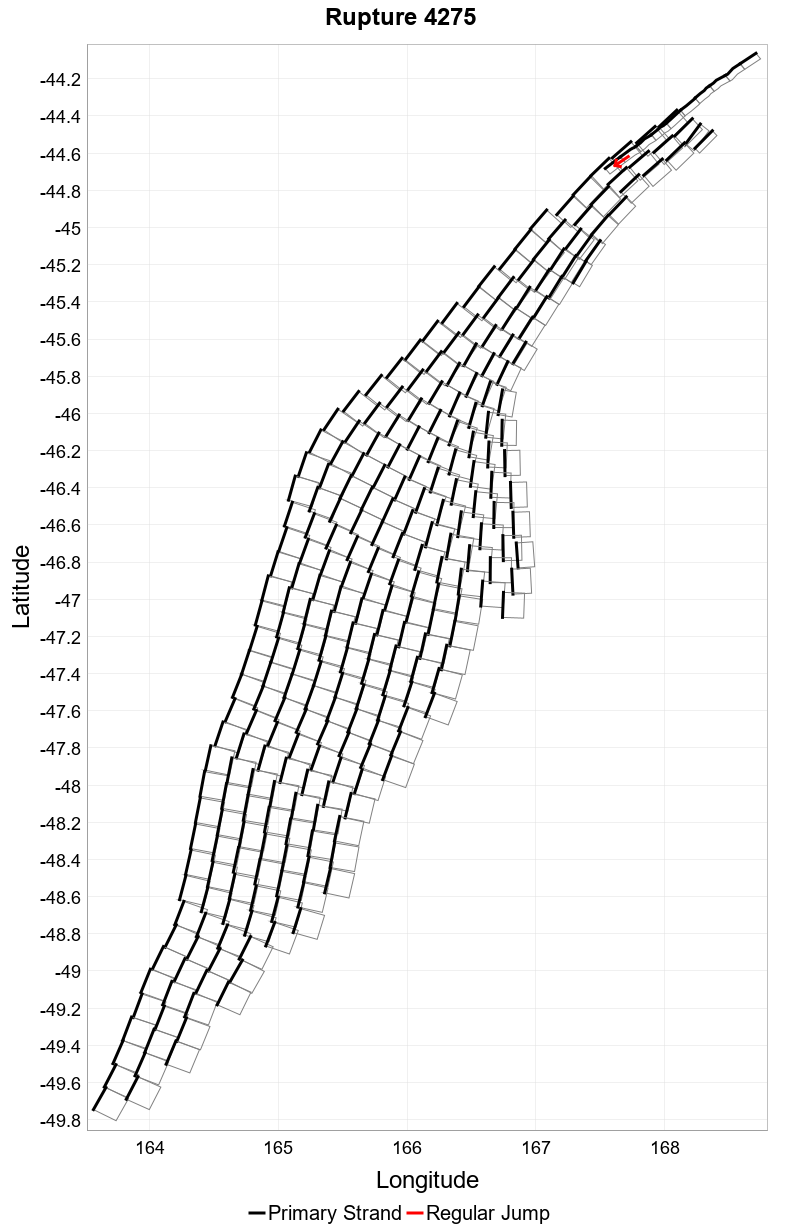 |
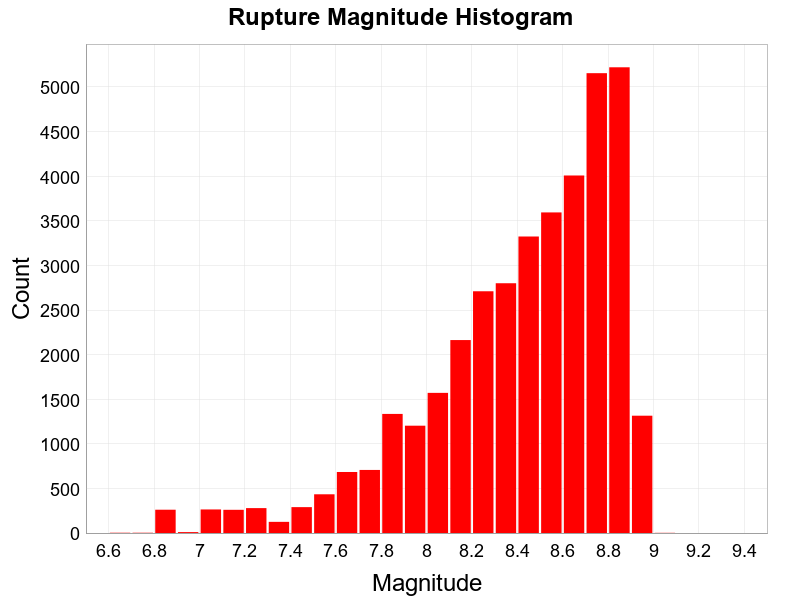
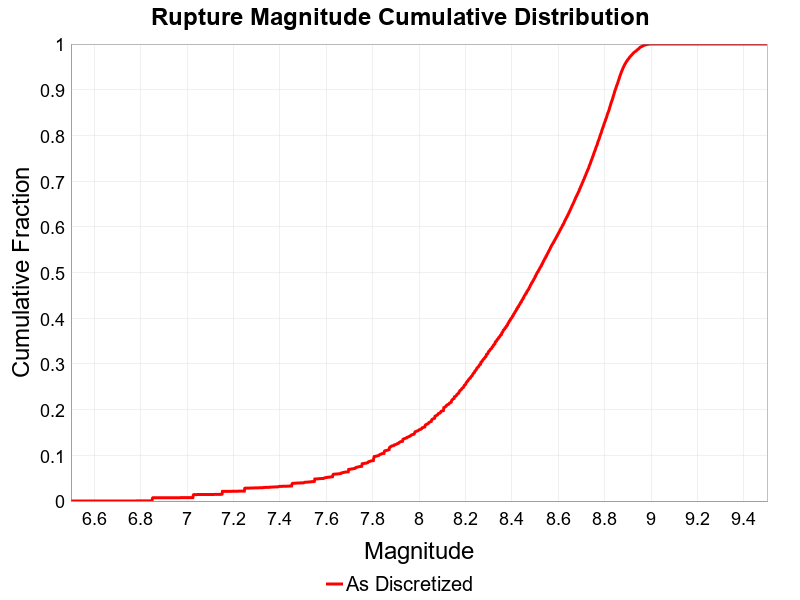
Rupture Magnitude
(top)
Magnitude of the rupture.
Rupture Magnitude Extremes & Examples
(top)
Example ruptures at various percentiles of Rupture Magnitude
| Minimum: 6.63 | p50: 8.51 | p90: 8.85 | p95: 8.88 |
|---|
|  |  |  |
| p97.5: 8.92 | p99: 8.95 | p99.9: 8.98 | Maximum: 9 |
 |  |  | |
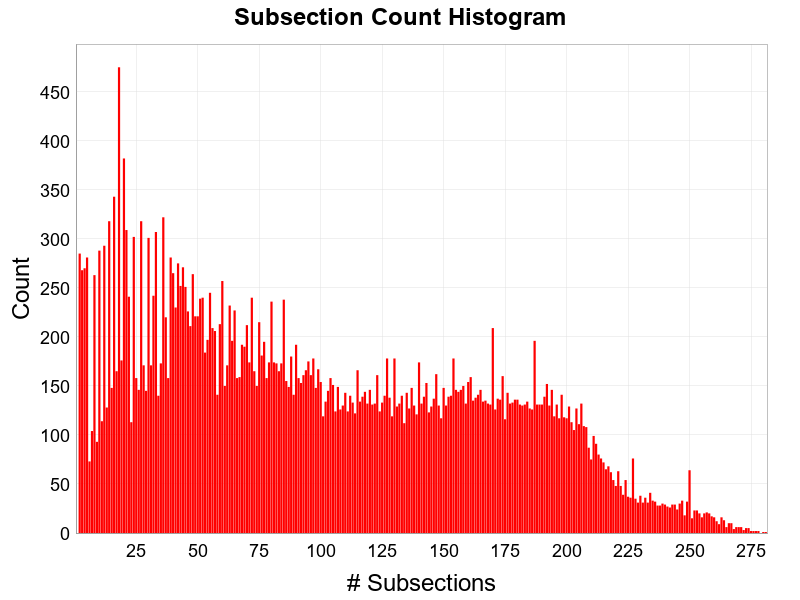
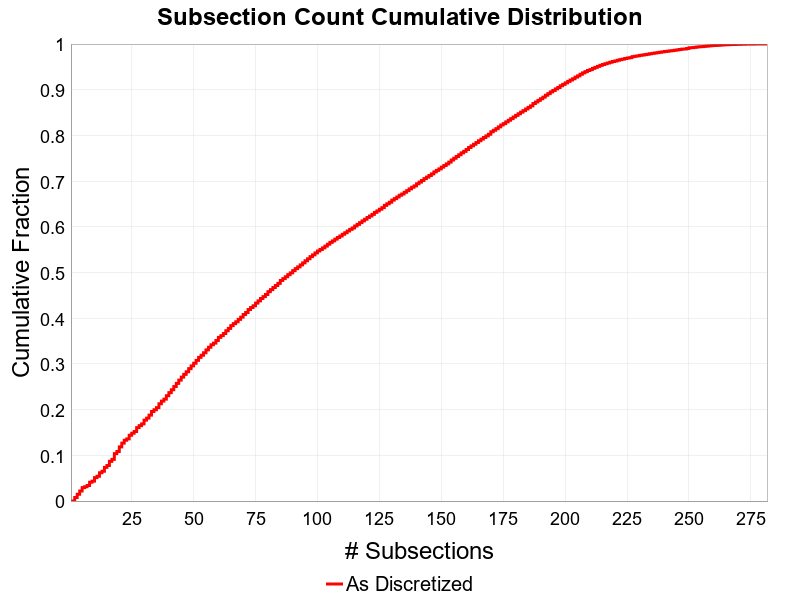
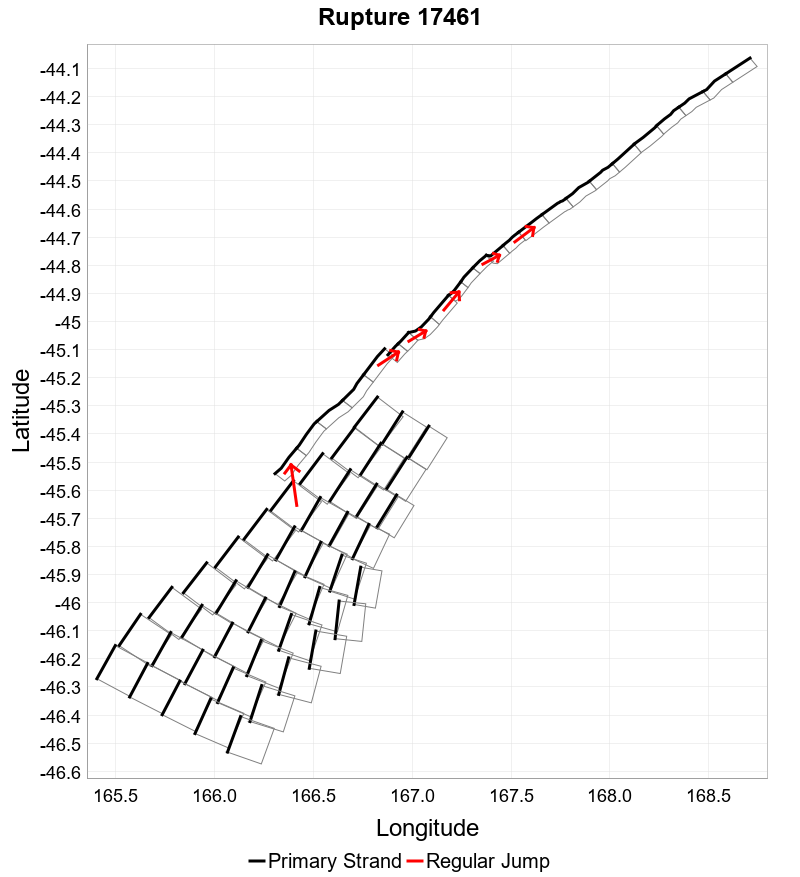
Subsection Count
(top)
Total number of subsections involved in a rupture.
Subsection Count Extremes & Examples
(top)
Example ruptures at various percentiles of Subsection Count
| Minimum: 2 | p50: 90 | p90: 196 | p95: 213 |
|---|
 |  |  |  |
| p97.5: 230 | p99: 249 | p99.9: 269 | Maximum: 281 |
 |  |  | |
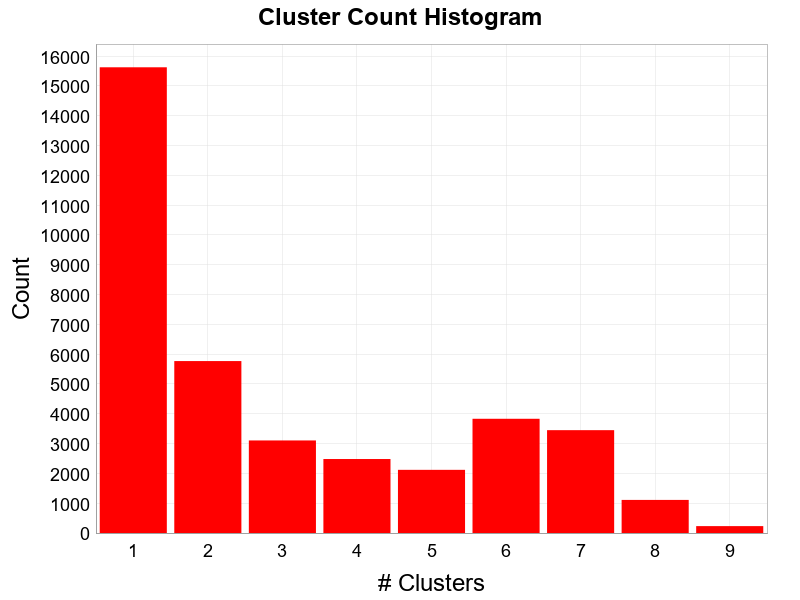
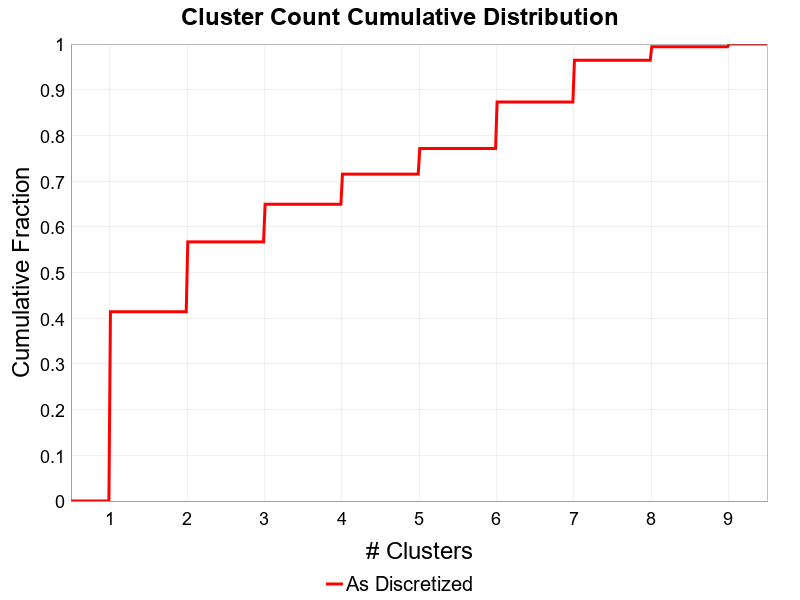
Cluster Count
(top)
Total number of clusters (of contiguous subsections on the same parent fault section) in a rupture.
Cluster Count Extremes & Examples
(top)
Example ruptures at various percentiles of Cluster Count
| Minimum: 1 | p50: 2 | p90: 7 | p95: 7 |
|---|
|  |  |  |
| p97.5: 8 | p99: 8 | p99.9: 9 | Maximum: 9 |
 |  |  |  |
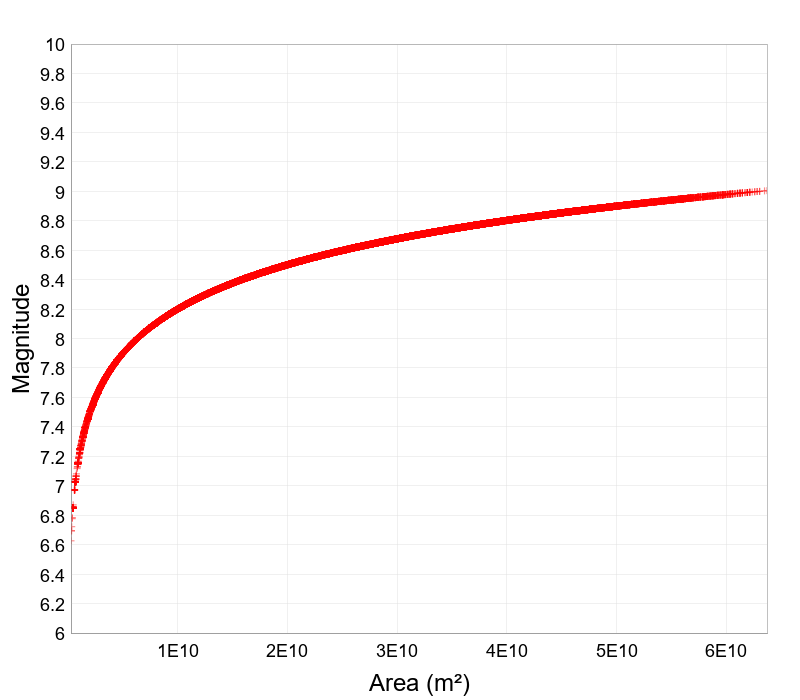
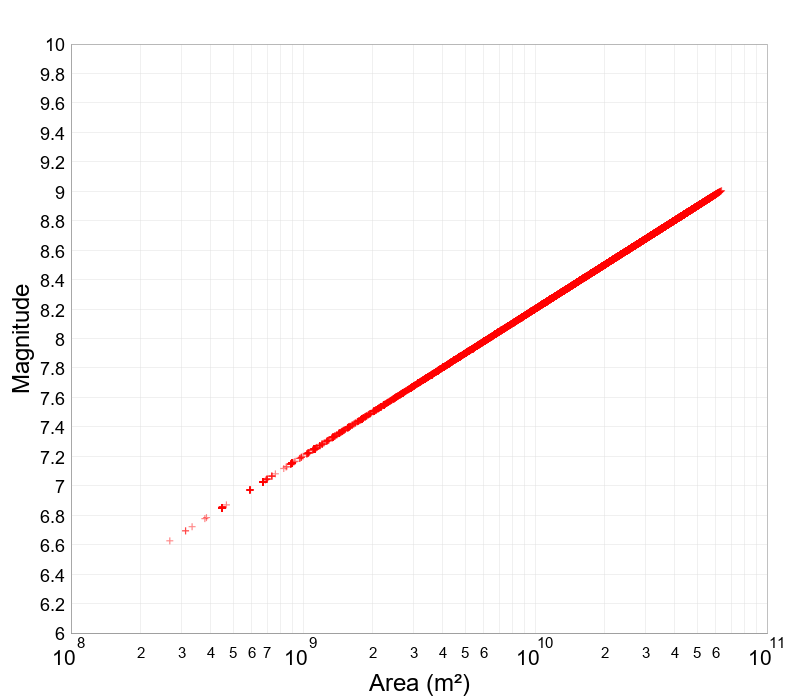
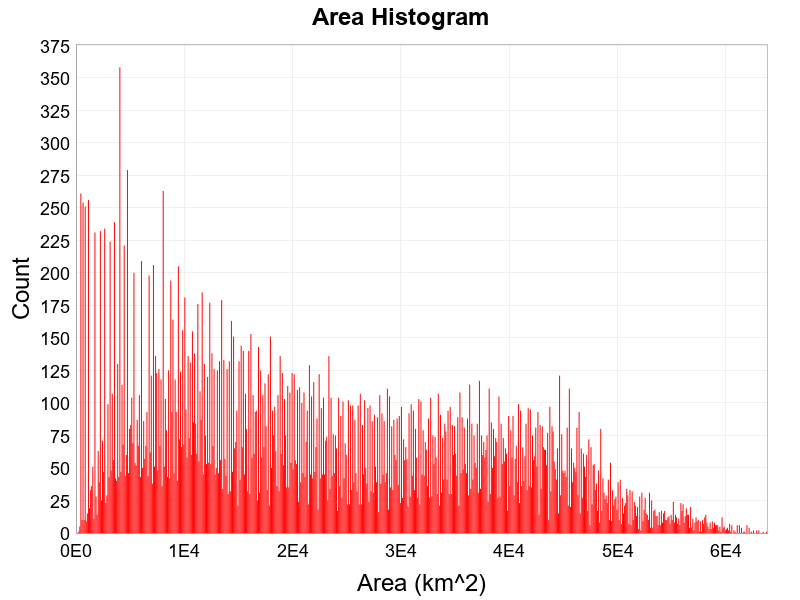
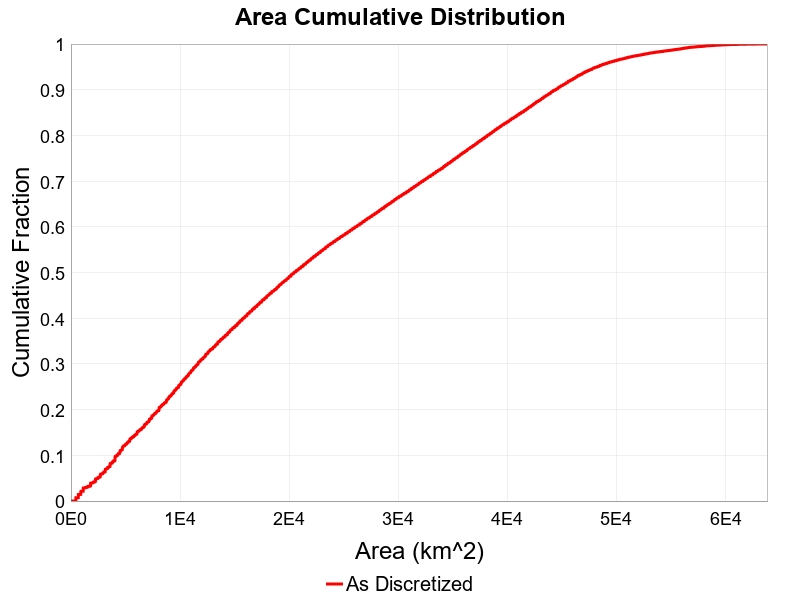
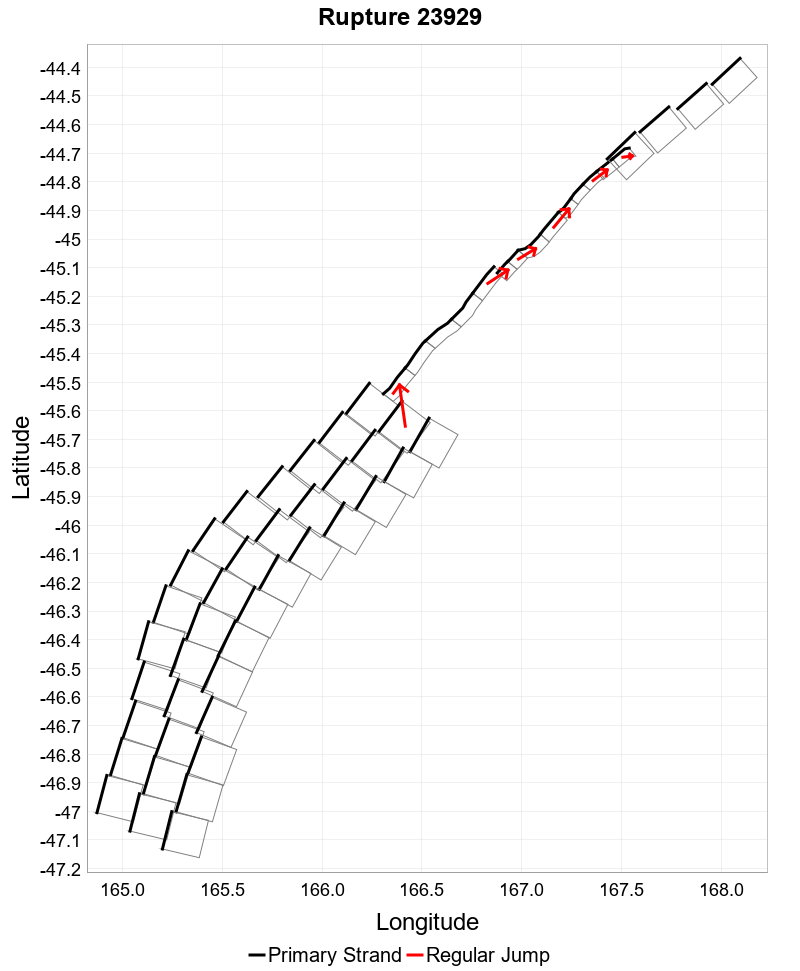
Area
(top)
Total area of the rupture (km^2).
Area Extremes & Examples
(top)
Example ruptures at various percentiles of Area
| Minimum: 266.63 | p50: 20465.98 | p90: 44425.16 | p95: 48231.31 |
|---|
| | | |
| p97.5: 52003.43 | p99: 56046.71 | p99.9: 60815.09 | Maximum: 63705.12 |
| | | |
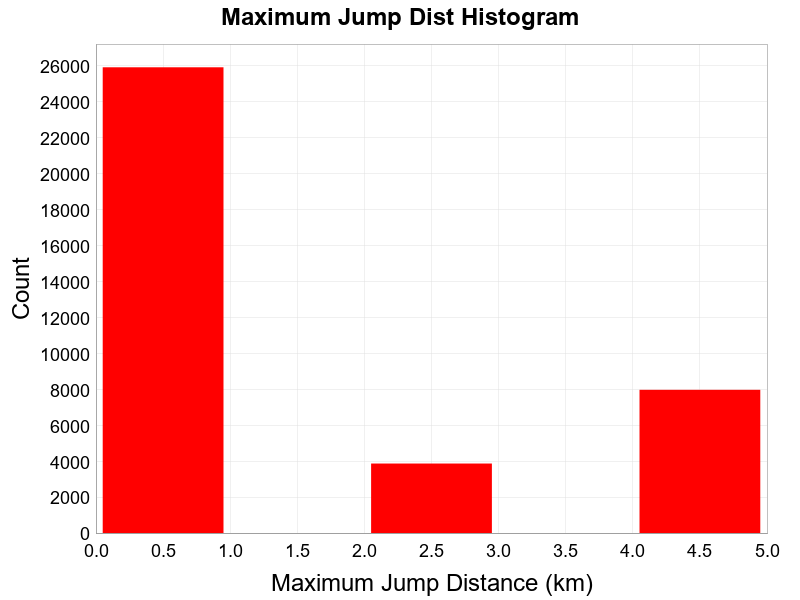
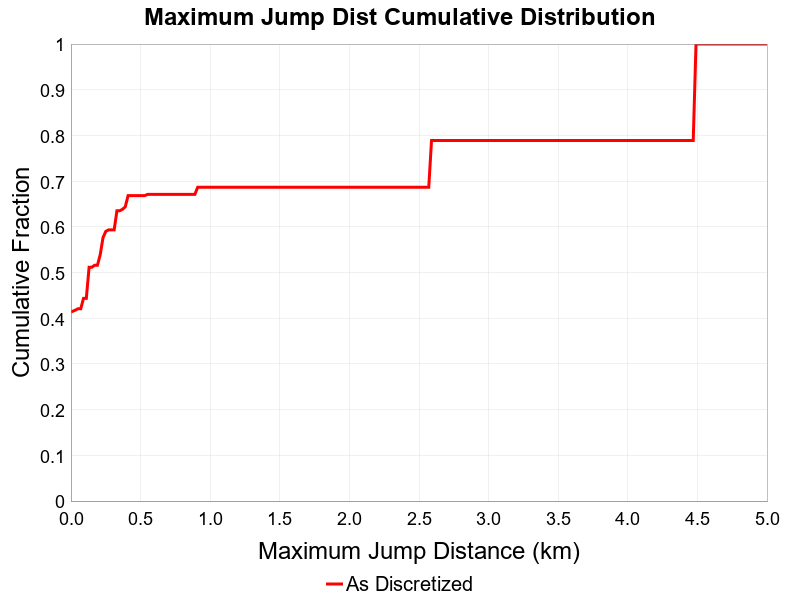
Maximum Jump Dist
(top)
The maximum jump distance in the rupture.
Maximum Jump Dist Extremes & Examples
(top)
Example ruptures at various percentiles of Maximum Jump Dist
| Minimum: 0.0 | p50: 0.13 | p90: 4.49 | p95: 4.49 |
|---|
|  |  |  |
| p97.5: 4.49 | p99: 4.49 | p99.9: 4.49 | Maximum: 4.49 |
 |  |  |  |
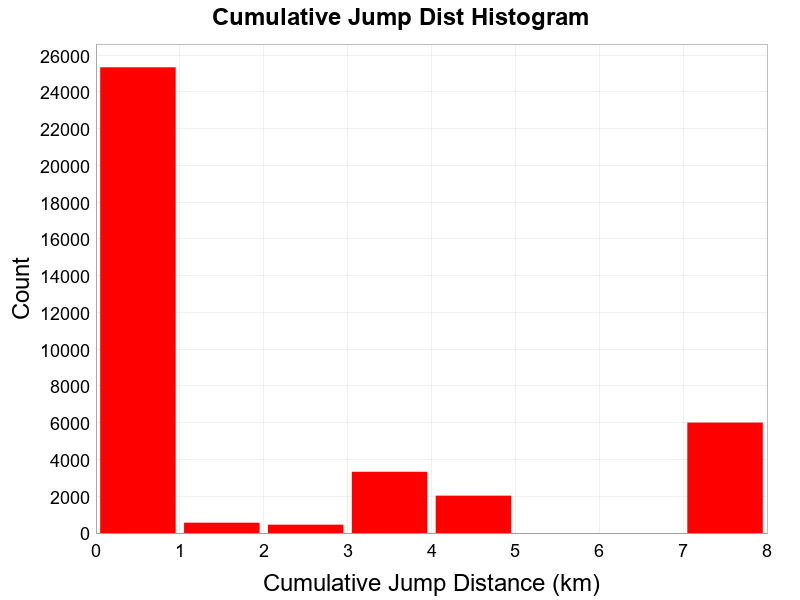
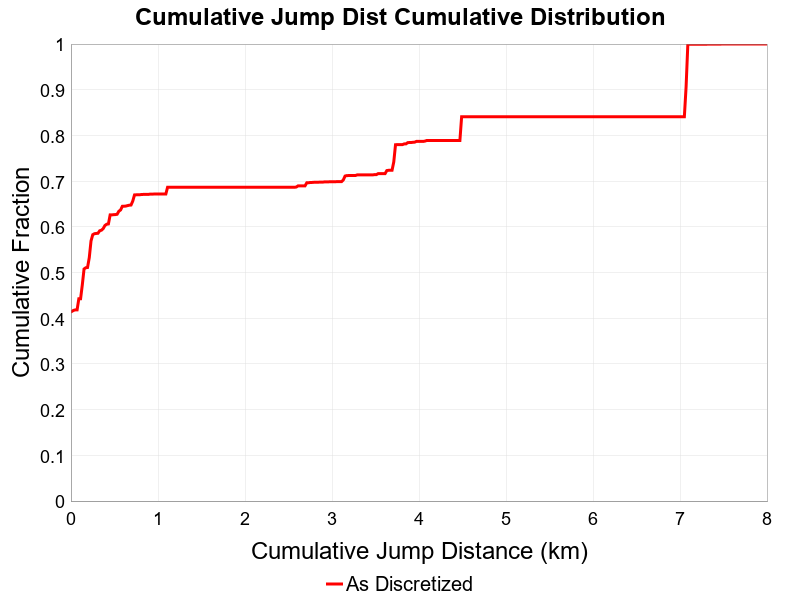
Cumulative Jump Dist
(top)
The total cumulative jump distance summed over all jumps in the rupture.
Cumulative Jump Dist Extremes & Examples
(top)
Example ruptures at various percentiles of Cumulative Jump Dist
| Minimum: 0.0 | p50: 0.16 | p90: 7.07 | p95: 7.1 |
|---|
| |  |  |
| p97.5: 7.1 | p99: 7.1 | p99.9: 7.1 | Maximum: 7.64 |
 |  |  |  |
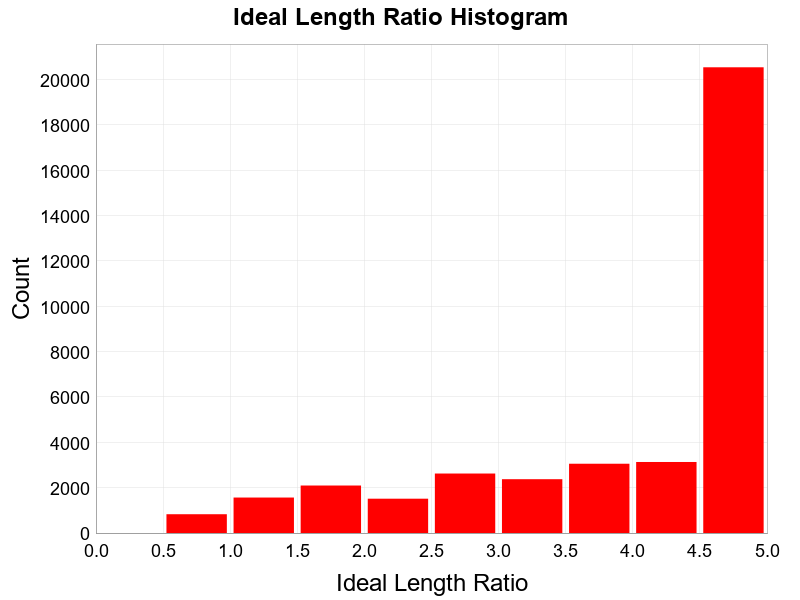
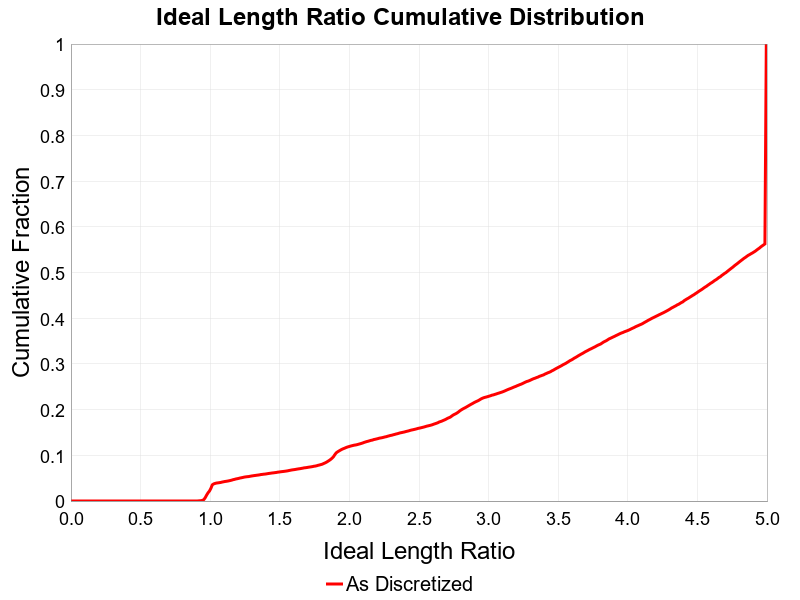
Ideal Length Ratio
(top)
The ratio between the total length of this rupture and the 'idealized length,' which we define as the straight line distance between the furthest two subsections.
Ideal Length Ratio Extremes & Examples
(top)
Example ruptures at various percentiles of Ideal Length Ratio
| Minimum: 0.91 | p50: 4.71 | p90: 6.72 | p95: 7.07 |
|---|
 |  |  |  |
| p97.5: 7.34 | p99: 7.61 | p99.9: 8.01 | Maximum: 9.13 |
 |  |  |  |
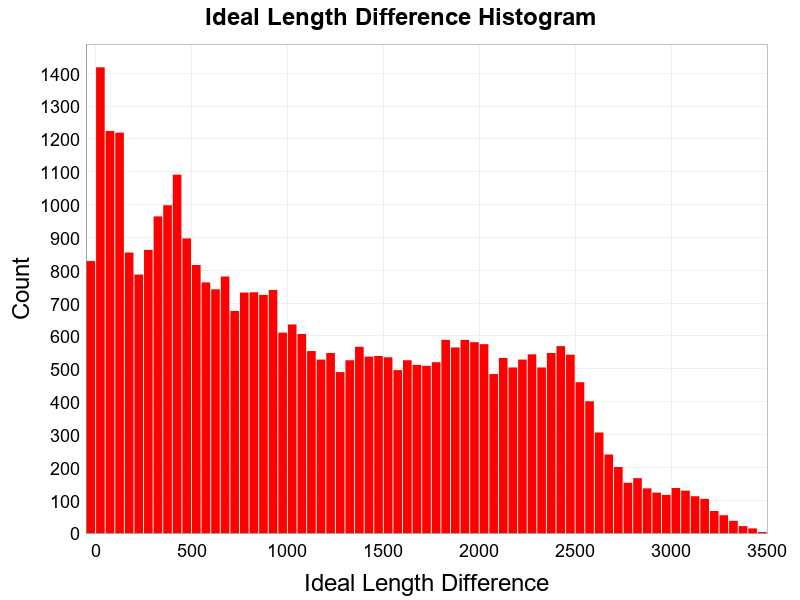
Ideal Length Difference
(top)
The difference between the total length of this rupture and the 'idealized length,' which we define as the straight line distance between the furthest two subsections.
Ideal Length Difference Extremes & Examples
(top)
Example ruptures at various percentiles of Ideal Length Difference
| Minimum: -6.609078 | p50: 1028.28 | p90: 2430.58 | p95: 2638.51 |
|---|
 |  |  |  |
| p97.5: 2893.34 | p99: 3111.08 | p99.9: 3356.49 | Maximum: 3477.01 |
 |  | | |
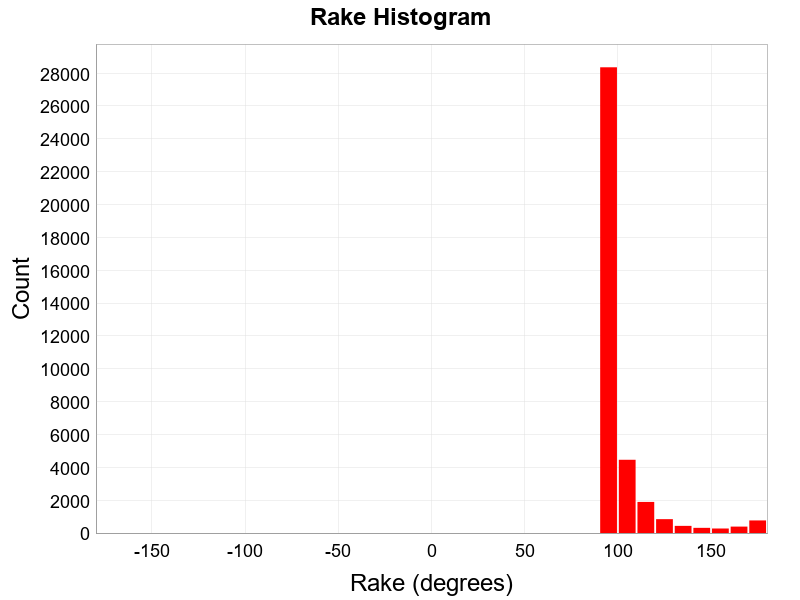
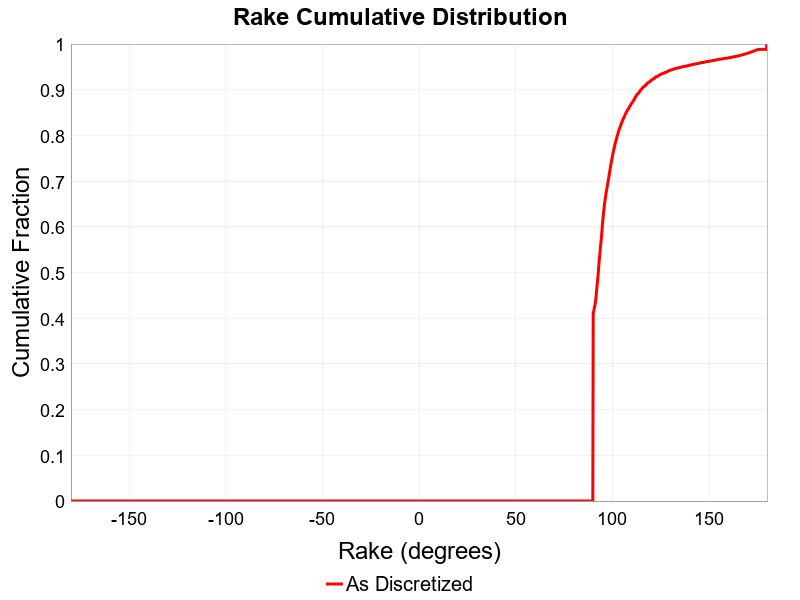
Rake
(top)
The area-averaged rake for this rupture.
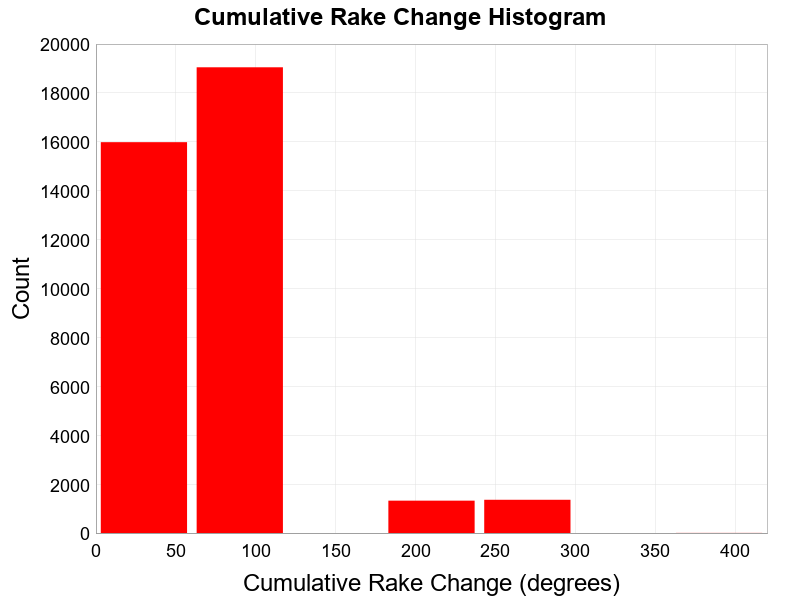
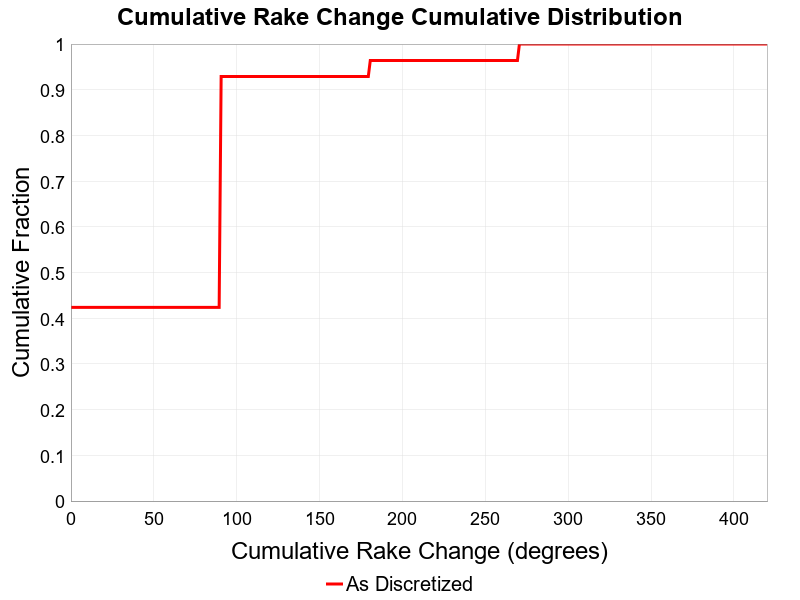
Cumulative Rake Change
(top)
Cumulative rake change for this rupture.
Cumulative Rake Change Extremes & Examples
(top)
Example ruptures at various percentiles of Cumulative Rake Change
| Minimum: 0.0 | p50: 90 | p90: 90 | p95: 180 |
|---|
|  |  |  |
| p97.5: 270 | p99: 270 | p99.9: 270 | Maximum: 360 |
 |  |  |  |
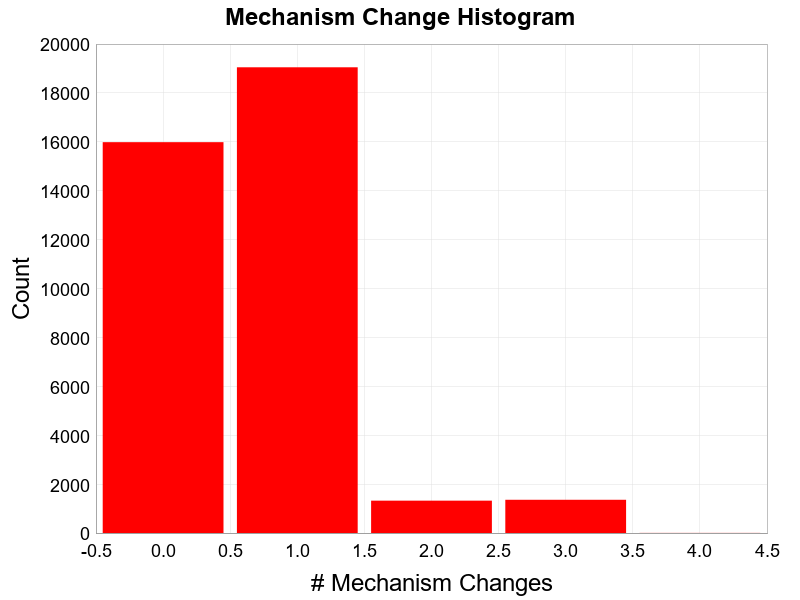
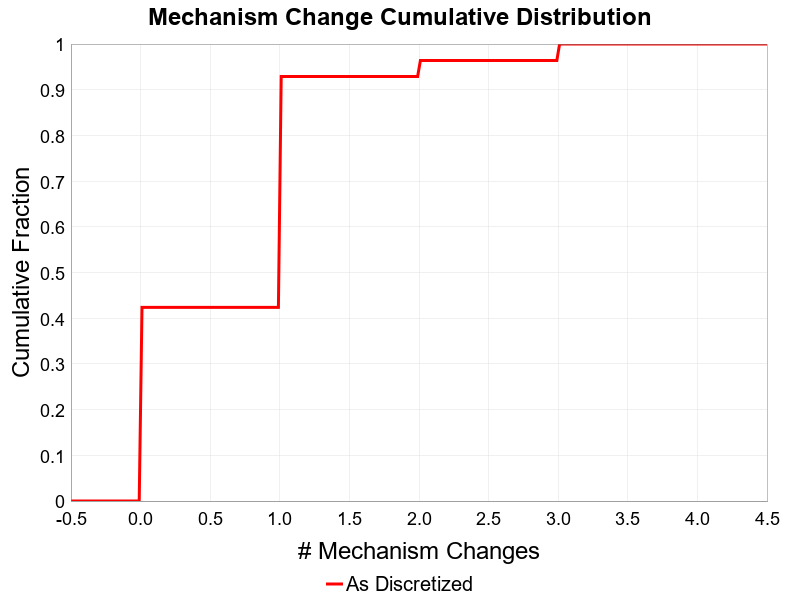
Mechanism Change
(top)
The number of times a rupture changed mechanisms, e.g., from right-lateral SS to left-lateral or SS to reverse.
Mechanism Change Extremes & Examples
(top)
Example ruptures at various percentiles of Mechanism Change
| Minimum: 0.0 | p50: 1 | p90: 1 | p95: 2 |
|---|
| | | |
| p97.5: 3 | p99: 3 | p99.9: 3 | Maximum: 4 |
| | | |
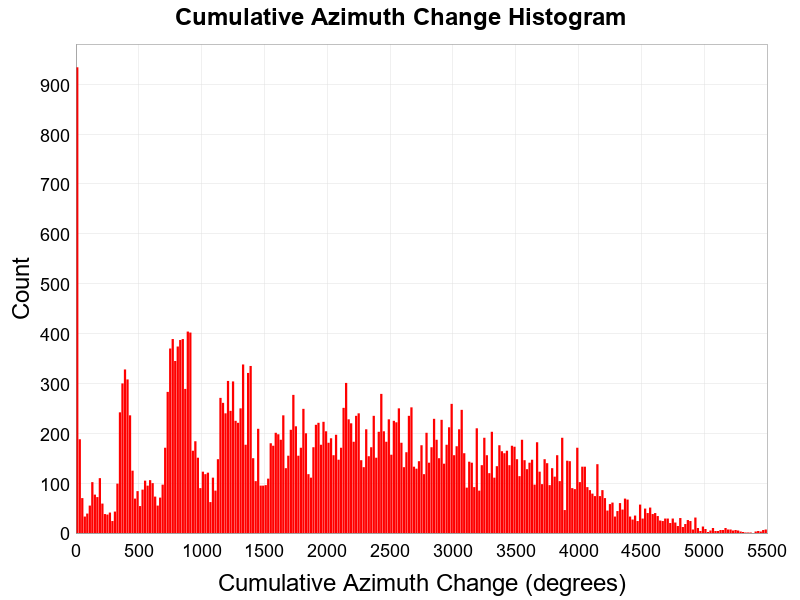
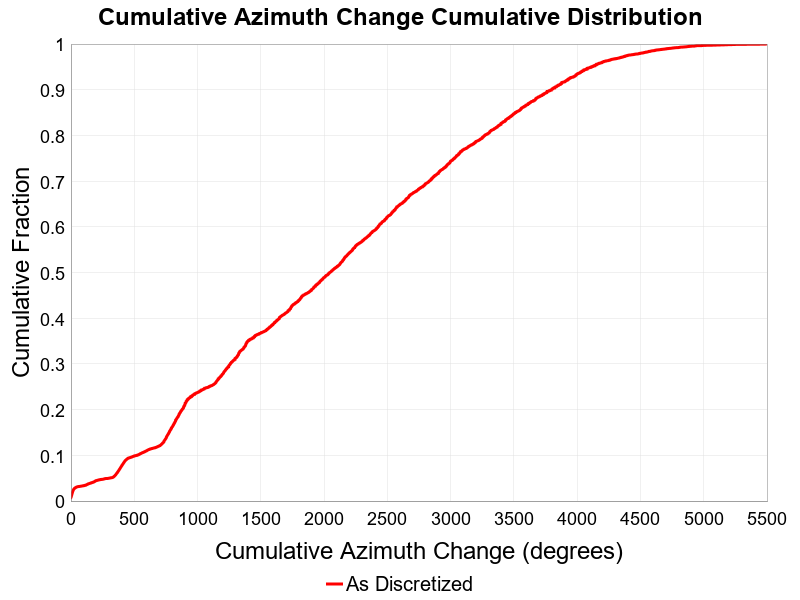
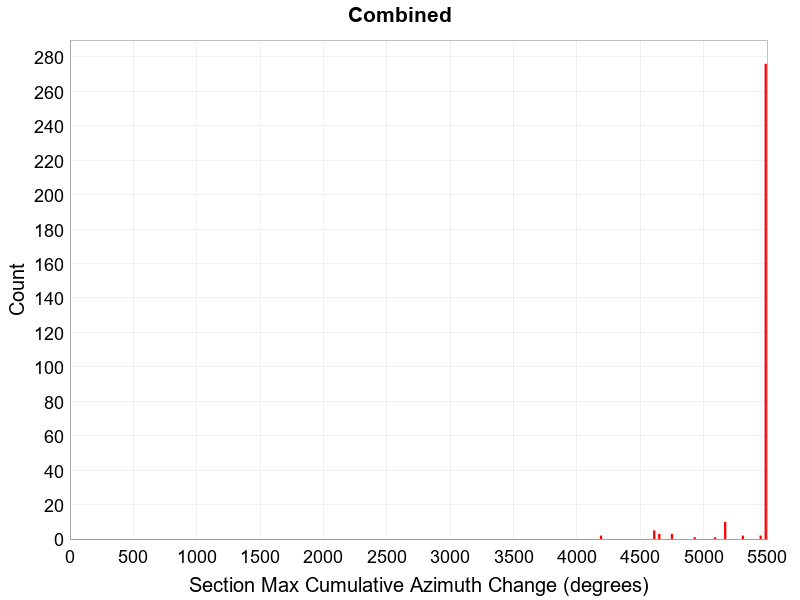
Cumulative Azimuth Change
(top)
Cumulative azimuth change for this rupture.
Cumulative Azimuth Change Extremes & Examples
(top)
Example ruptures at various percentiles of Cumulative Azimuth Change
| Minimum: 0.0 | p50: 2045.98 | p90: 3795.86 | p95: 4113.26 |
|---|
|  |  |  |
| p97.5: 4397.93 | p99: 4716.82 | p99.9: 5249.2 | Maximum: 5498.64 |
 |  |  |  |
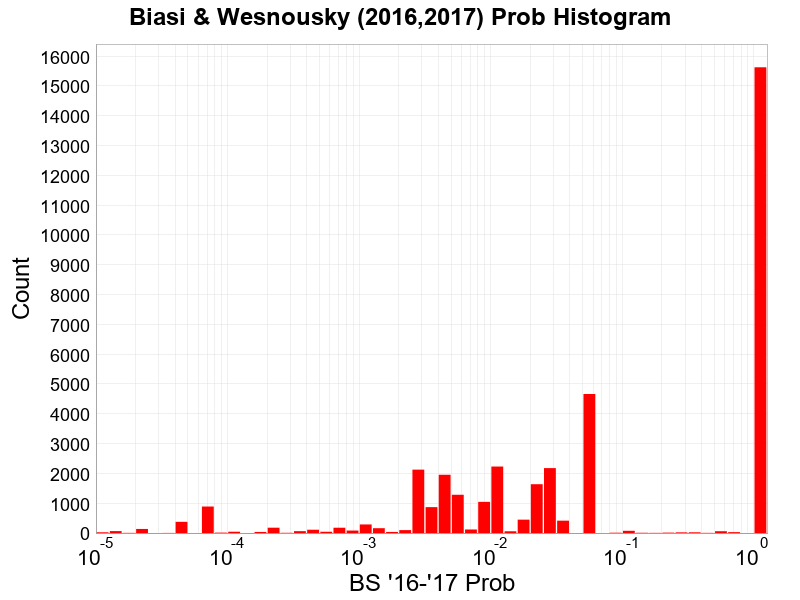
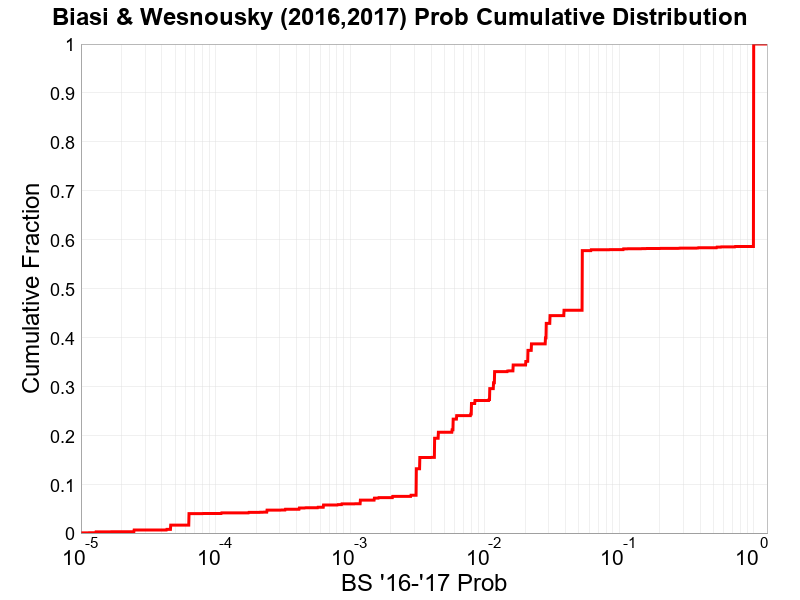
Biasi & Wesnousky (2016,2017) Prob
(top)
Biasi & Wesnousky (2016,2017) conditional probability of passing through each jump.
Biasi & Wesnousky (2016,2017) Prob Extremes & Examples
(top)
Example ruptures at various percentiles of Biasi & Wesnousky (2016,2017) Prob
| Maximum: 1 | p50: 0.053333335 | p10: 0.00310693 | p5: 4.2050812E-4 |
|---|
 |  |  |  |
| p2.5: 6.359517E-5 | p1: 4.6407287E-5 | p0.1: 1.2883654E-5 | Minimum: 2.4750552E-6 |
 |  |  |  |
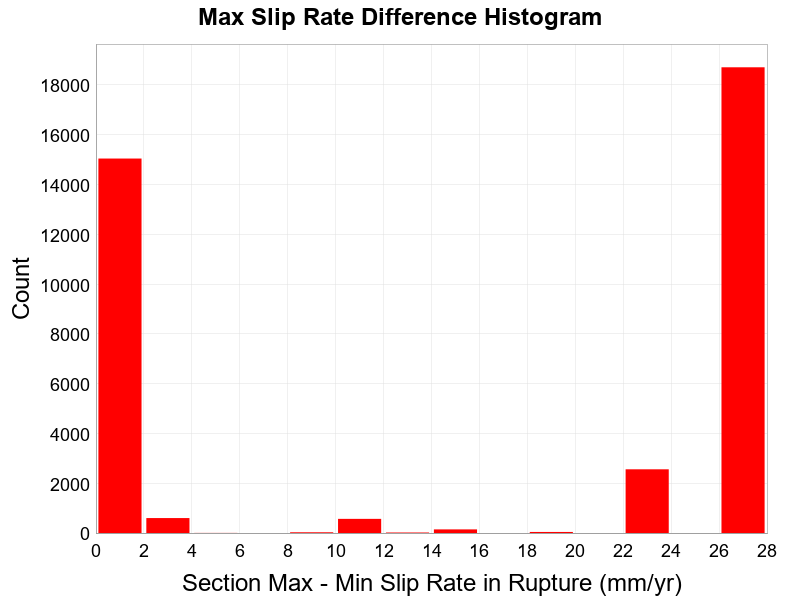
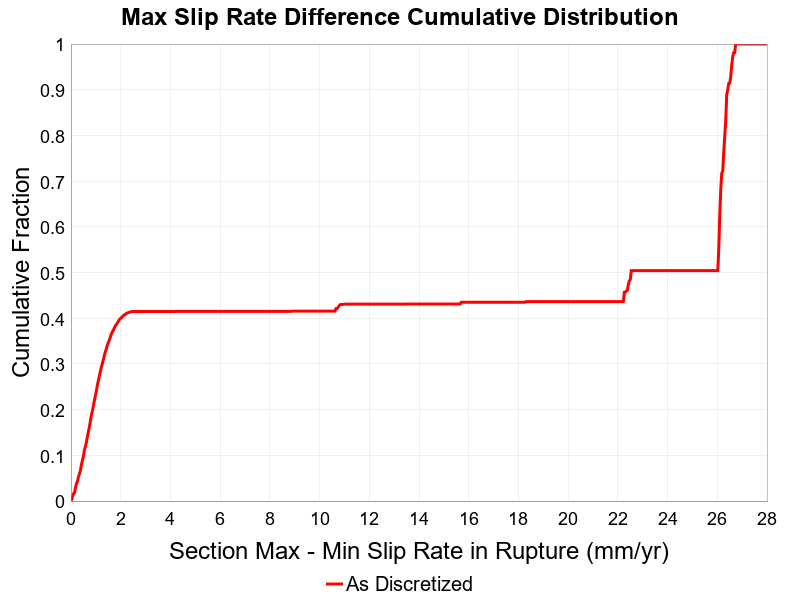
Max Slip Rate Difference
(top)
The difference between the slip rate of the sections with the highest and lowest slip rate in the rupture.
Max Slip Rate Difference Extremes & Examples
(top)
Example ruptures at various percentiles of Max Slip Rate Difference
| Minimum: 0.0 | p50: 22.52 | p90: 26.46 | p95: 26.58 |
|---|
|  |  |  |
| p97.5: 26.68 | p99: 26.72 | p99.9: 26.72 | Maximum: 26.72 |
 |  |  |  |
Attached Modules
(top)
List of all modules that have been attached to this Rupture Set.
Note: Modules classes in the standard modules package, org.opensha.sha.earthquake.faultSysSolution.modules, have been shortened to omit the package name.
| Name | Implementing Class |
|---|
| Logic Tree Branch | nz.cri.gns.NZSHM22.opensha.enumTreeBranches.NZSHM22_LogicTreeBranch |
| Precomputed Cluster Ruptures | ClusterRuptures$Precomputed |
| Section Distance-Azimuth Calculator | org.opensha.sha.earthquake.faultSysSolution.ruptures.util.SectionDistanceAzimuthCalculator |
| Rupture Connection Search | org.opensha.sha.earthquake.faultSysSolution.ruptures.util.RuptureConnectionSearch |
| Section Slip Rates | SectSlipRates$Default |
| Section Areas | SectAreas$Default |
| OpenSHA Build Information | BuildInfoModule |
| Precomputed Average Slips | AveSlipModule$Precomputed |
| Uniform Slip Along Rupture | SlipAlongRuptureModel$Uniform |
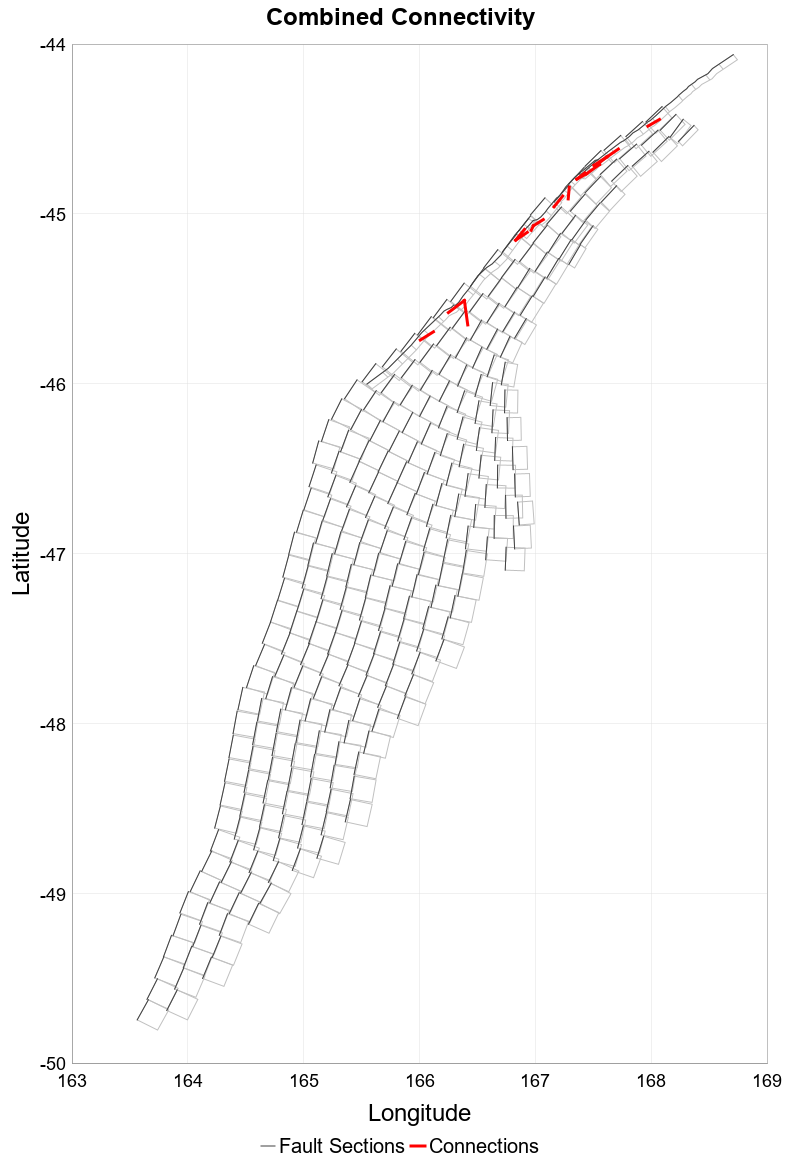
Fault Section Connections
(top)
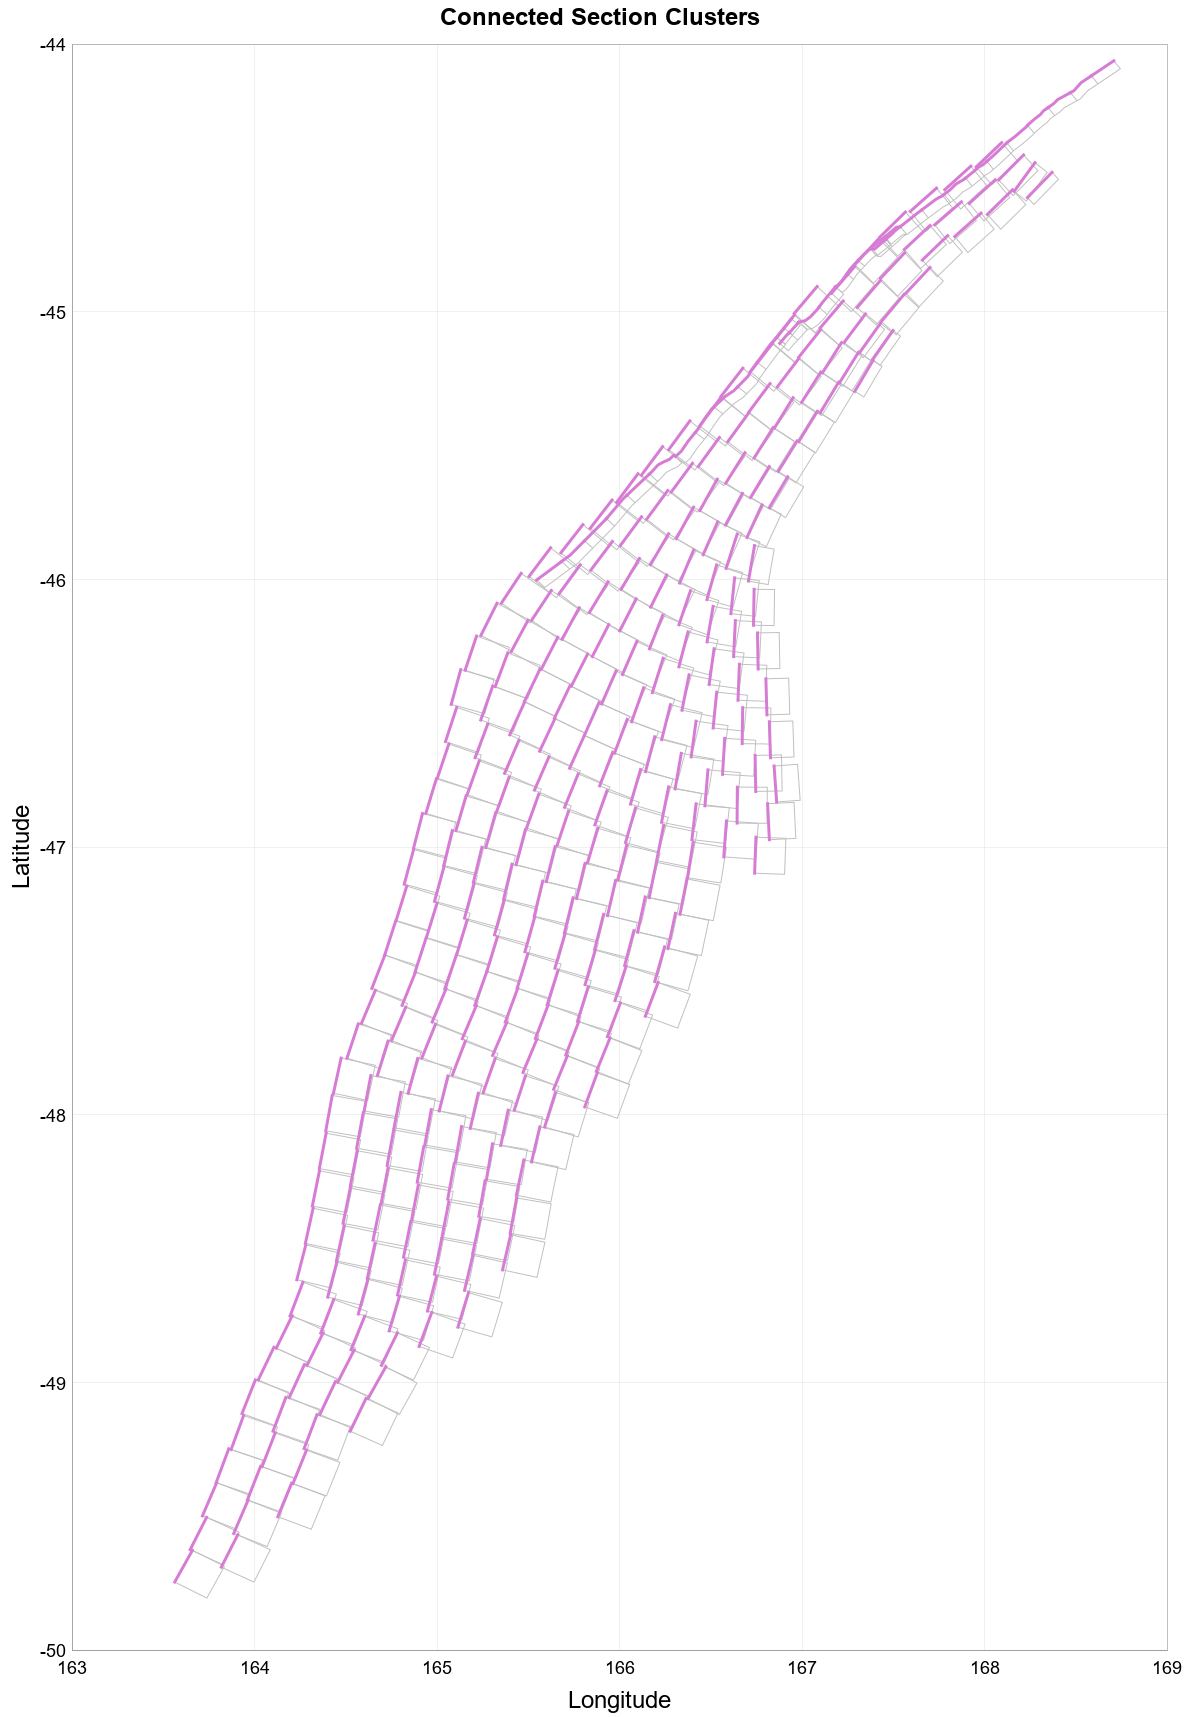
Connected Clusters
(top)
Connected clusters of fault sections, where all sections plotted in a given color connect with all other sections of the same color through ruptures. There may not be any single rupture that connects all such sections, but rather, chains of ruptures connect the sections. Only the first 10 clusters are plotted with bold colors; smaller clusters are plotted in random saturated colors (note that neighboring clusters can be similar colors by chance), and fully isolated faults are plotted in black.
| Rank | Sections | Parent Sections | Ruptures |
|---|
| 1 | 305 (100.00%) | 10 (100.00%) | 37,721 (100.00%) |
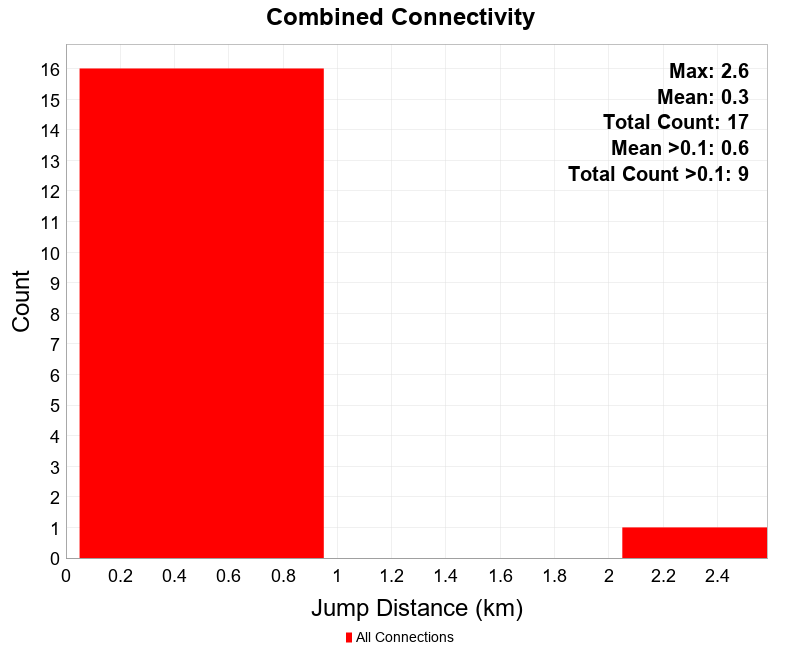
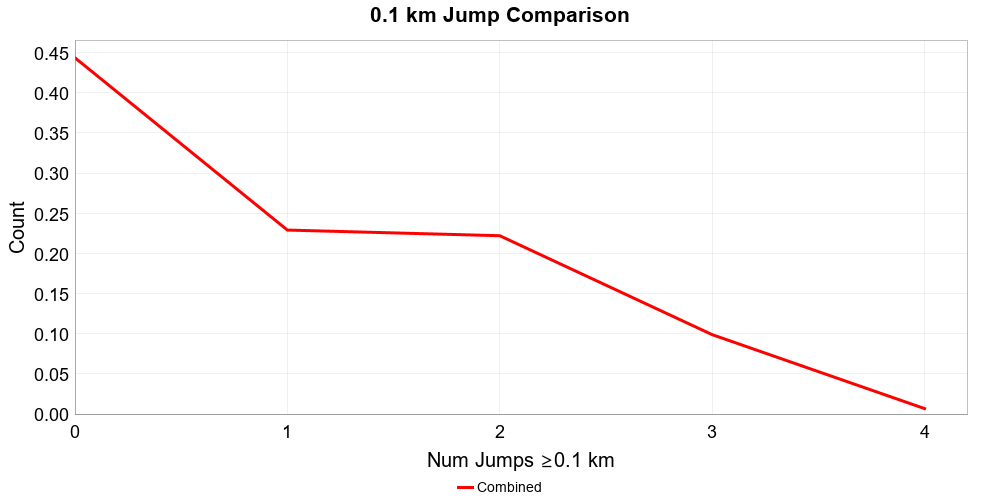
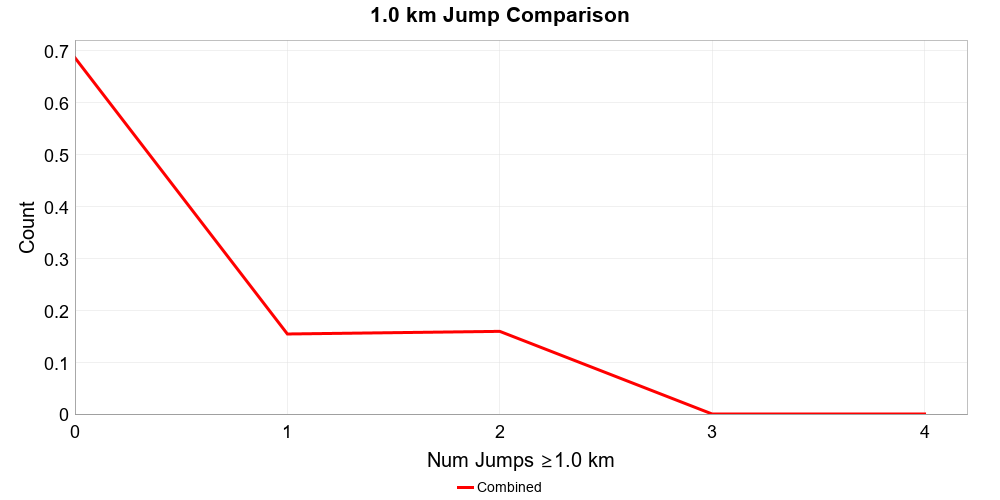
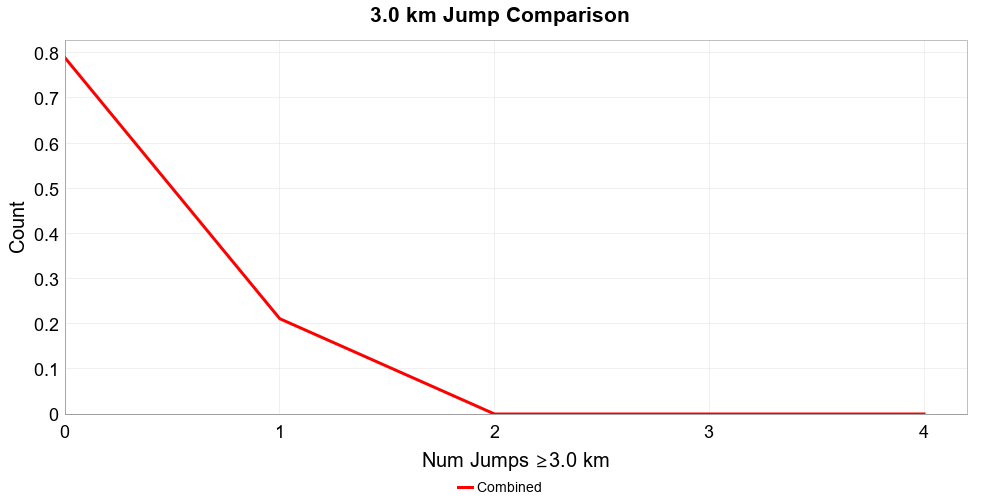
Jump Counts Over Distance
(top)
Supra-seismogenic Jump Counts
(top)
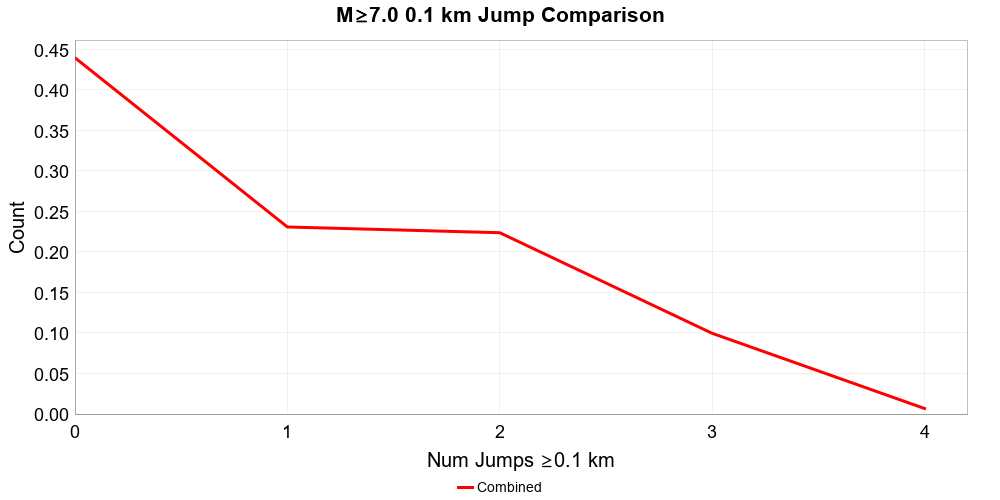
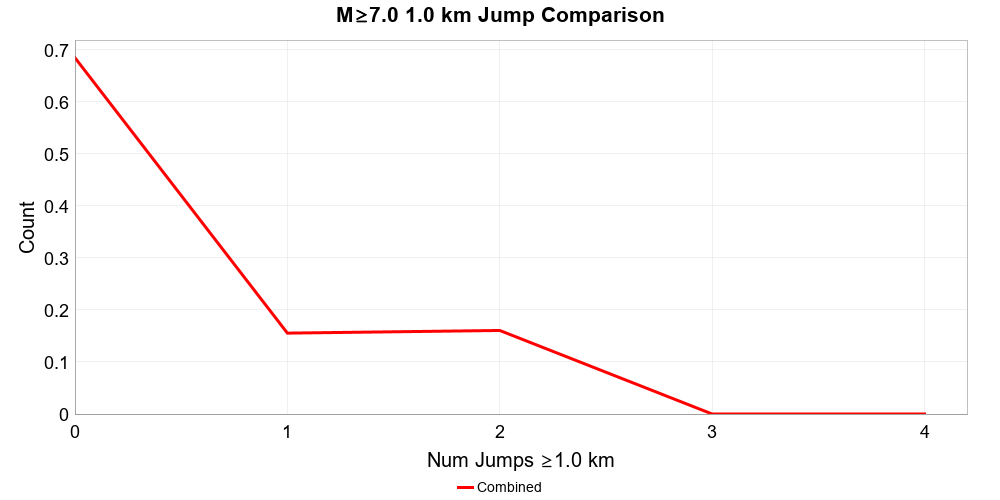
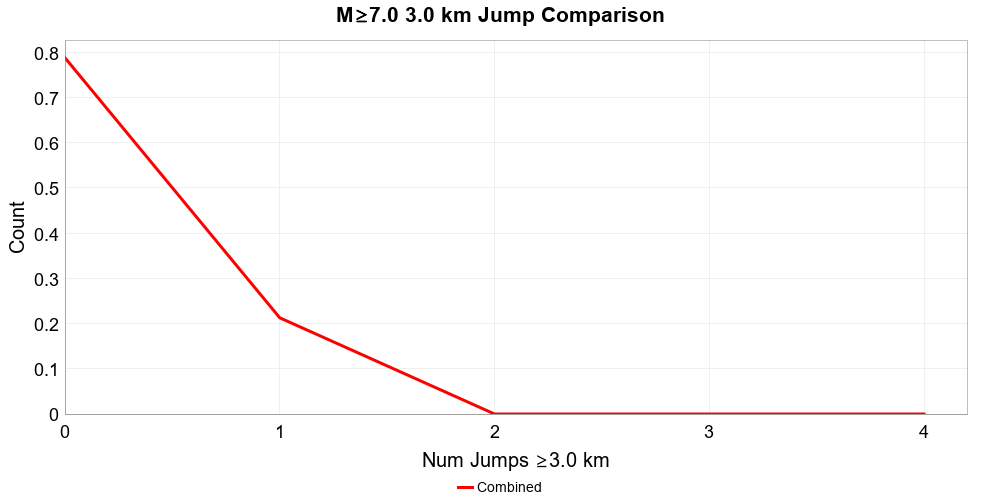
M≥7 Jump Counts
(top)
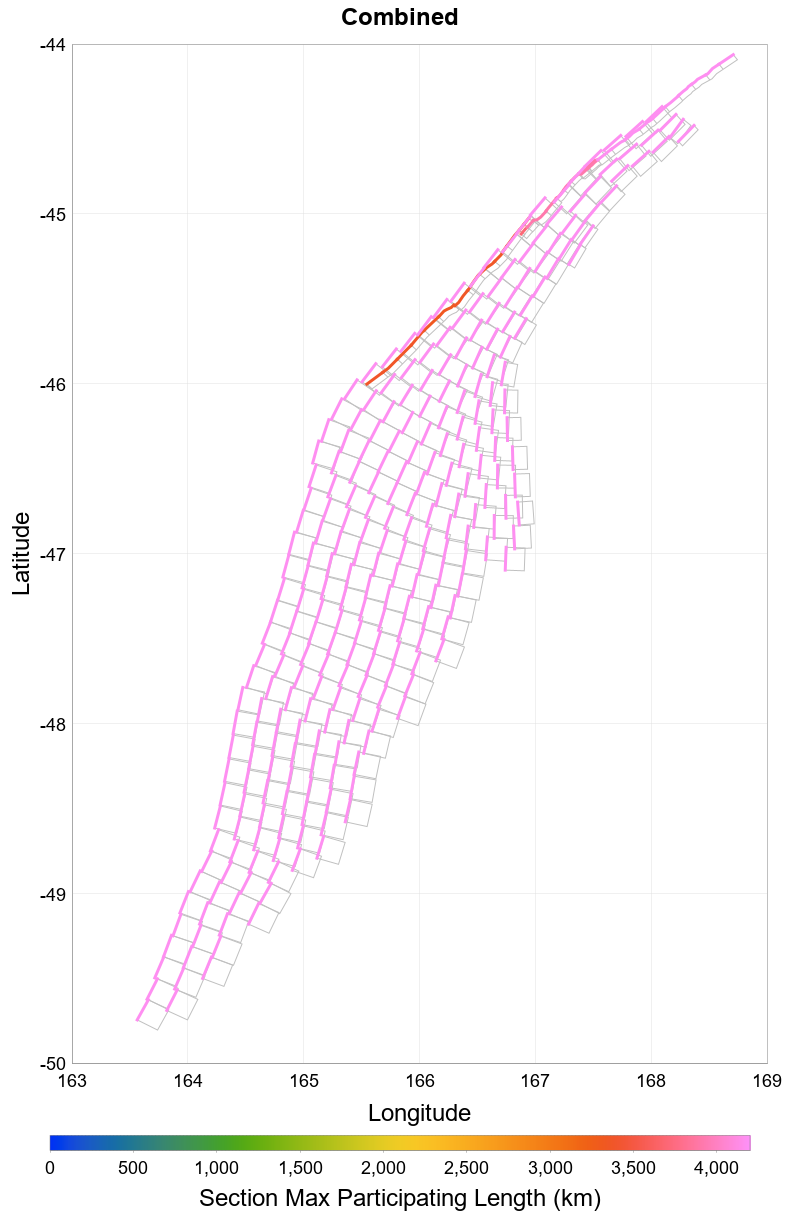
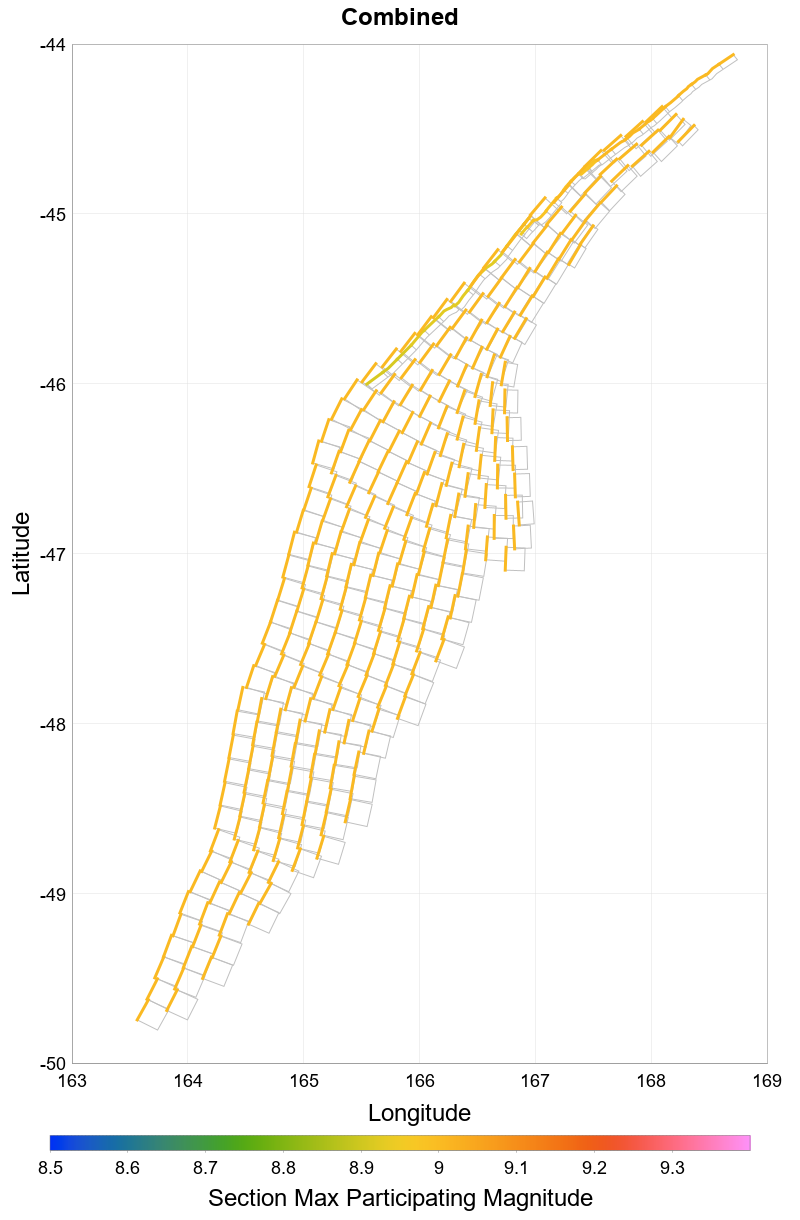
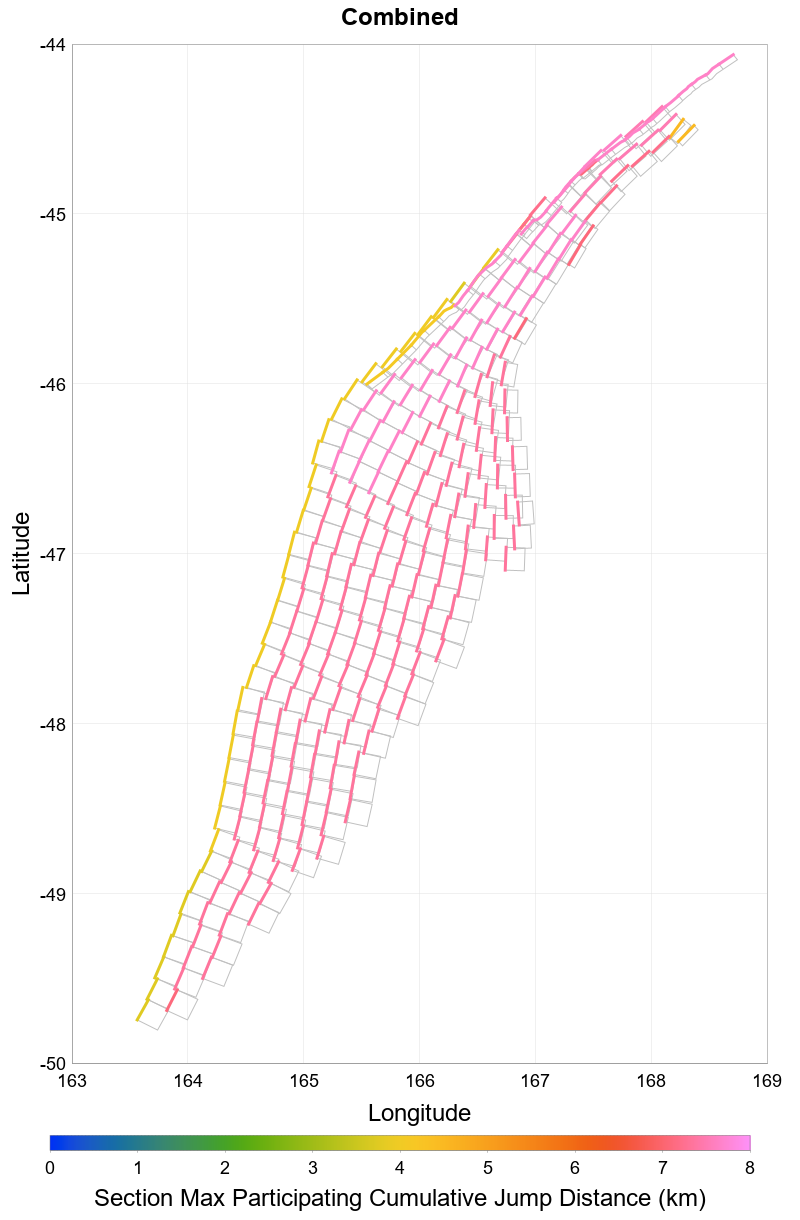
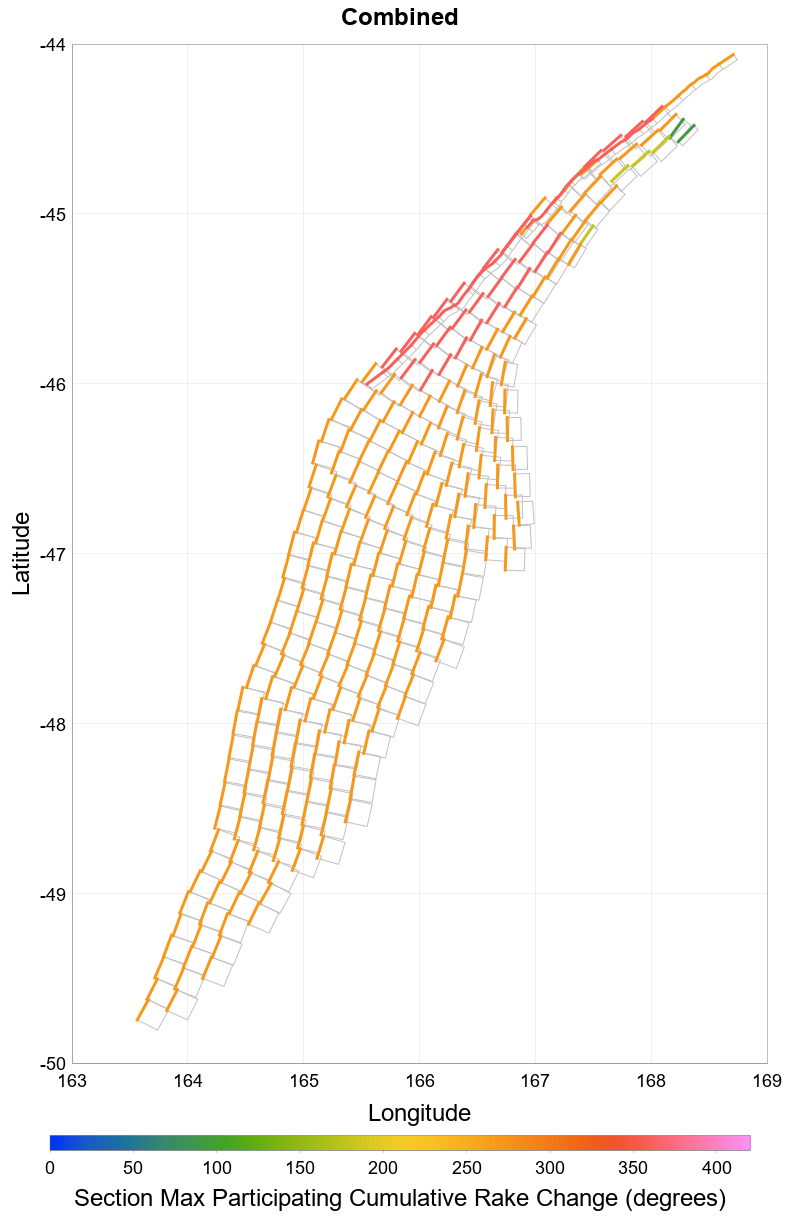
Subsection Maximum Values
(top)
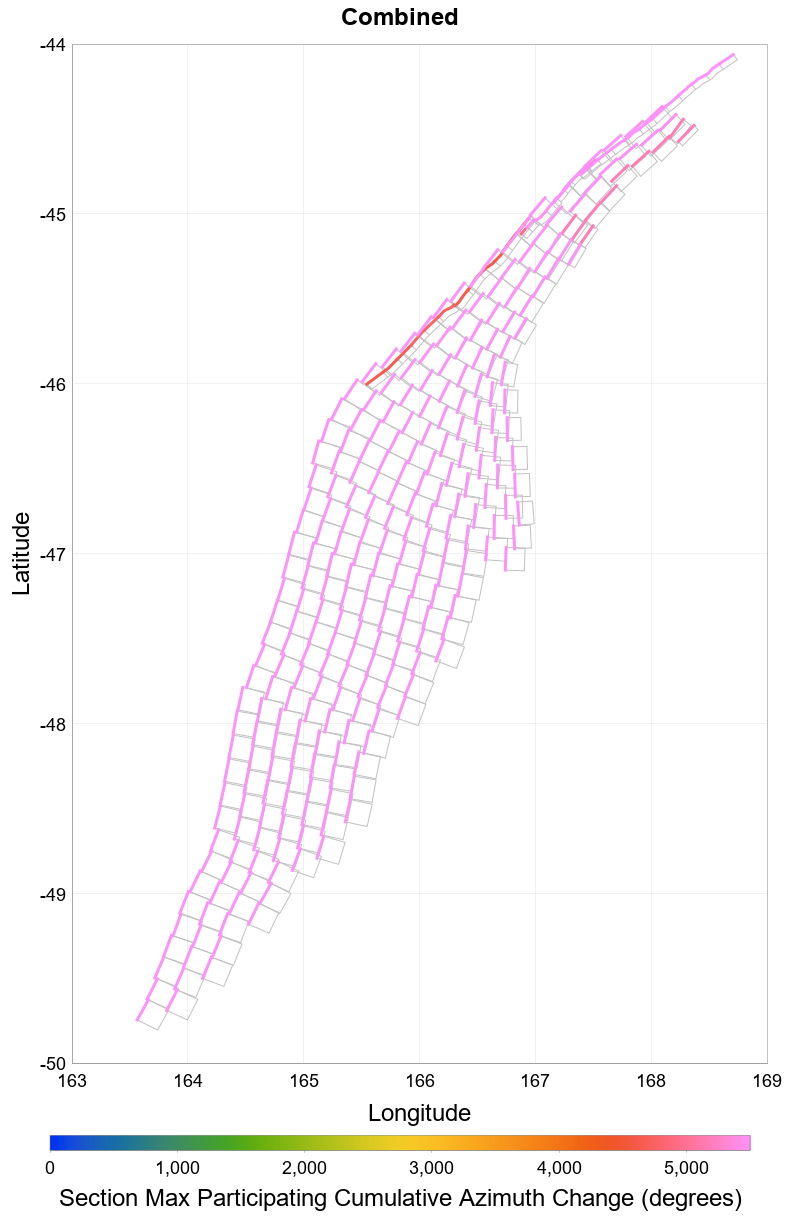
These plots show the maximum value of various quantities across all ruptures for which each individual subsection participates. This is useful, for example, to find sections with low maximum magnitudes (due to low or no connectivity).
Subsection Maximum Rupture Length
(top)
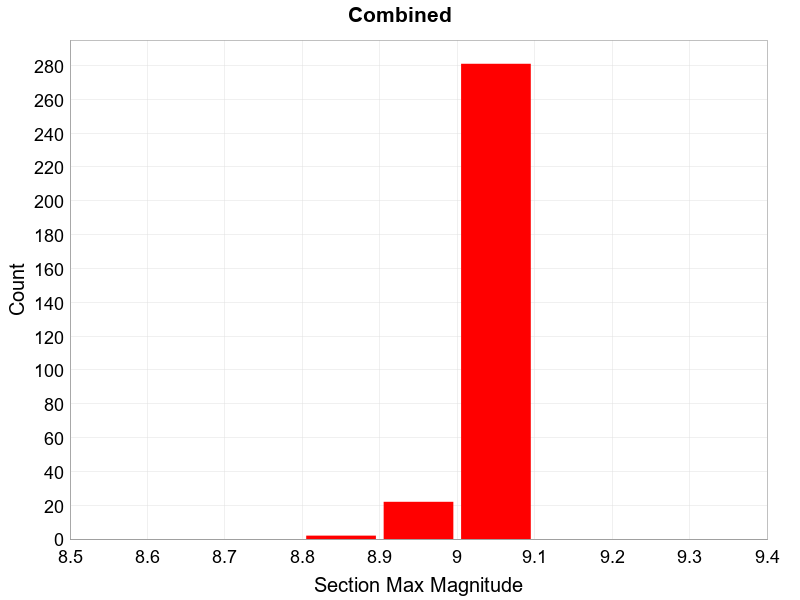
Subsection Maximum Rupture Magnitude
(top)
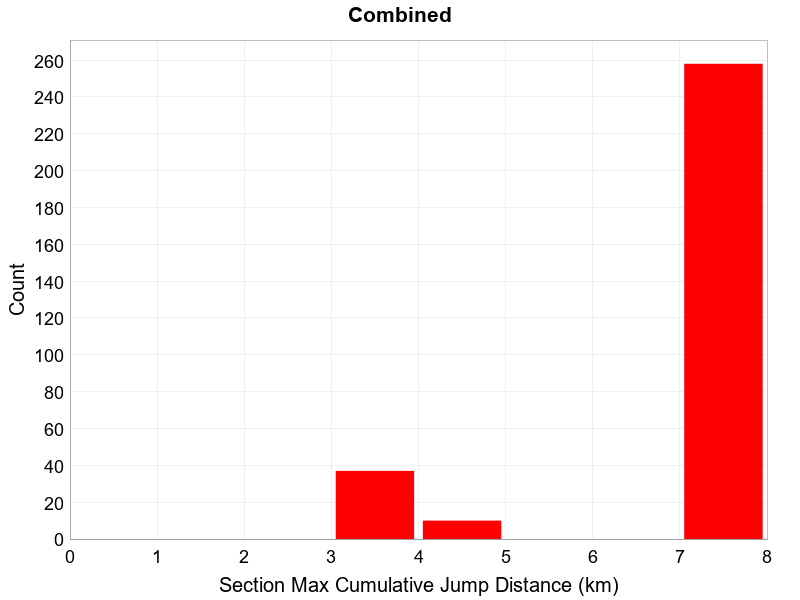
Subsection Maximum Cumulative Jump Dist
(top)
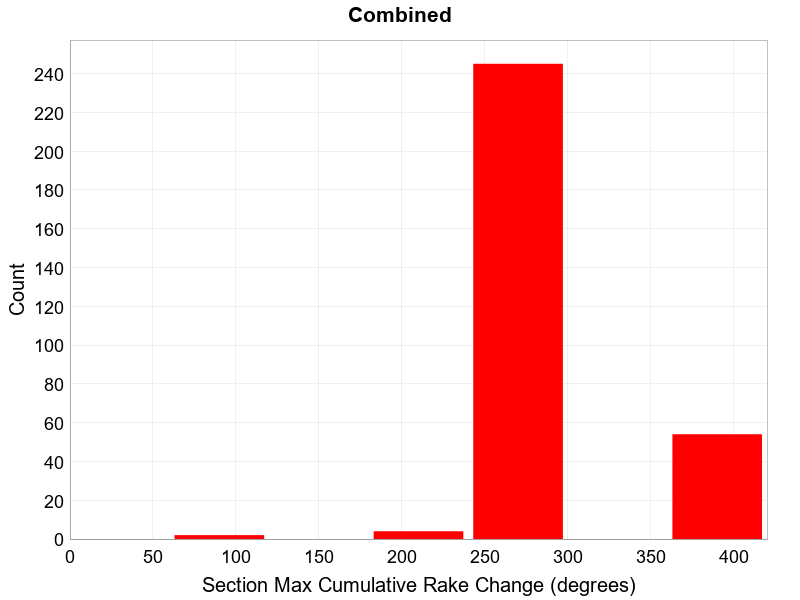
Subsection Maximum Cumulative Rake Change
(top)
Subsection Maximum Cumulative Azimuth Change
(top)